
On This Page:
Background
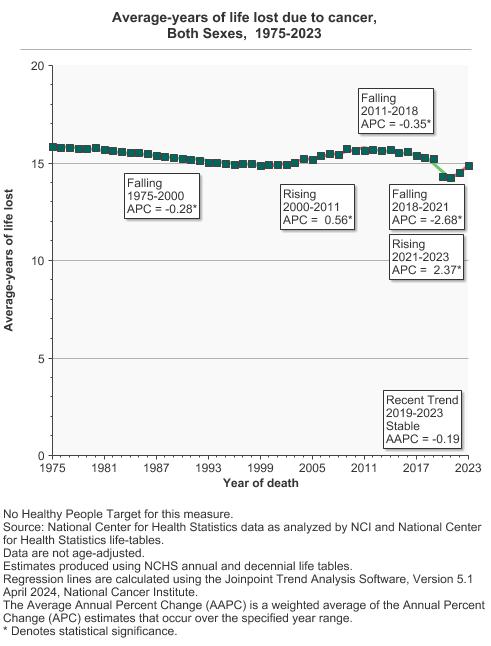
Death rates alone do not provide a complete picture of the burden that deaths impose on the population. Another useful measure that may add a different dimension is years of life lost (YLL)—the years of life lost because of early death from a particular cause or disease. YLL caused by cancer helps to describe the extent to which the lives of people with cancer are cut short.
Measure
Years of Life Lost is measured as the difference between the actual age stemming from the disease/cause and the expected age of death due to a particular disease or cause. Specifically, this measure is estimated by linking life table data to each death of a person of a given age and sex. The life table permits a determination of the number of additional years an average person of that age, race, and sex would have been expected to live.
Average Years of Life Lost represents Years of Life Lost divided by the number of people who lost their lives.
Healthy People 2030 Target
There is no Healthy People 2030 target for this measure.
Healthy People 2030 is a set of goals set forth by the Department of Health and Human Services.
Data Source
Centers for Disease Control and Prevention, National Center for Health Statistics, 1975-2020.
Trends and Most Recent Estimates
Average Years of Life Lost
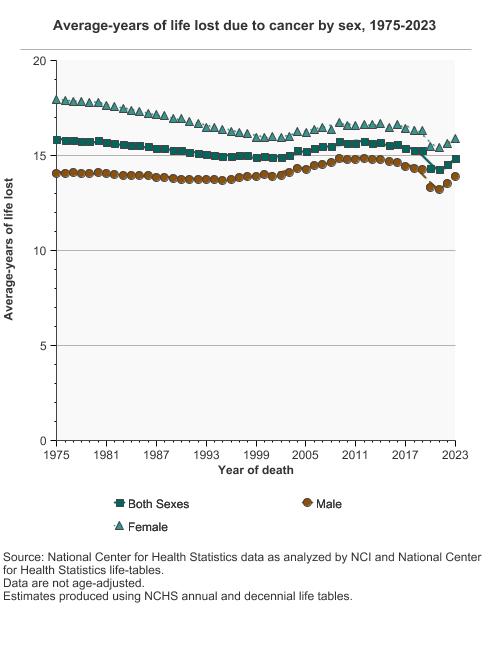
By Sex
| Overview Graph | Detailed Trend Graphs | Most Recent Estimates (2020) | |
|---|---|---|---|
| Average-years of life lost | 95% Confidence Interval | ||
|
Both Sexes
|
15.2 | Not available |
Male
|
14.2 | Not available | |
Female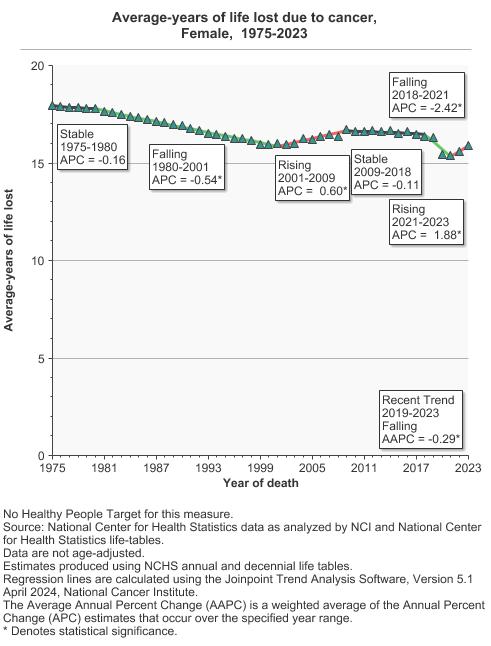
|
16.3 | Not available | |
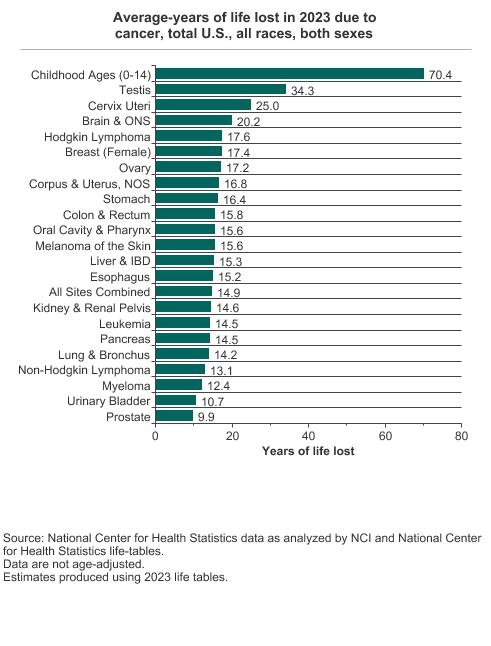
Cancer, All Races, Both Sexes
| Overview graph | Cause of death | Years of life lost |
|---|---|---|
|
Childhood Ages (0-14) | 71.3 |
| Testis | 34.7 | |
| Cervix Uteri | 26.2 | |
| Brain & ONS | 21.5 | |
| Hodgkin Lymphoma | 19.1 | |
| Breast (Female) | 18.8 | |
| Ovary | 17.7 | |
| Corpus & Uterus, NOS | 17.5 | |
| Oral Cavity & Pharynx | 16.9 | |
| Liver & IBD | 16.8 | |
| Melanoma of the Skin | 16.6 | |
| Stomach | 16.5 | |
| Esophagus | 16.0 | |
| Colon & Rectum | 15.7 | |
| Leukemia | 15.6 | |
| All Sites Combined | 15.6 | |
| Kidney & Renal Pelvis | 15.5 | |
| Pancreas | 15.0 | |
| Lung & Bronchus | 15.0 | |
| Non-Hodgkin Lymphoma | 13.7 | |
| Myeloma | 13.5 | |
| Urinary Bladder | 11.1 | |
| Prostate | 9.9 |
Person-years of Life Lost
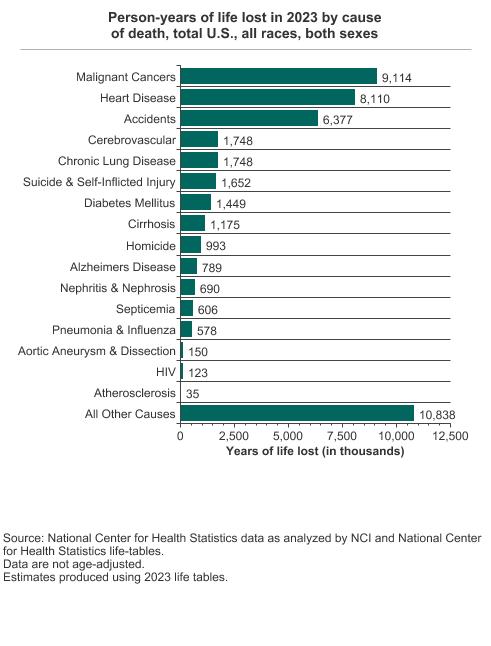
All Causes of Death, All Races, Both Sexes
| Overview graph | Cause of death | Years of life lost (in thousands) |
|---|---|---|
|
Malignant Cancers | 9,319 |
| Heart Disease | 7,635 | |
| Accidents | 4,809 | |
| Chronic Lung Disease | 1,883 | |
| Suicide & Self-Inflicted Injury | 1,539 | |
| Cerebrovascular | 1,539 | |
| Diabetes Mellitus | 1,223 | |
| Cirrhosis | 921 | |
| Homicide | 864 | |
| Alzheimers Disease | 751 | |
| Pneumonia & Influenza | 614 | |
| Nephritis & Nephrosis | 606 | |
| Septicemia | 589 | |
| HIV | 174 | |
| Aortic Aneurysm & Dissection | 140 | |
| Atherosclerosis | 49 | |
| All Other Causes | 9,020 |
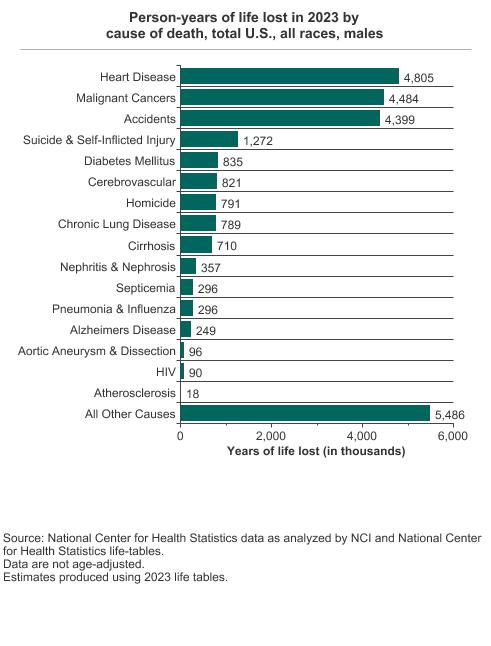
All Causes of Death, All Races, Males
| Overview graph | Cause of death | Years of life lost (in thousands) |
|---|---|---|
|
Malignant Cancers | 4,607 |
| Heart Disease | 4,454 | |
| Accidents | 3,240 | |
| Suicide & Self-Inflicted Injury | 1,157 | |
| Chronic Lung Disease | 861 | |
| Cerebrovascular | 705 | |
| Homicide | 686 | |
| Diabetes Mellitus | 675 | |
| Cirrhosis | 570 | |
| Pneumonia & Influenza | 305 | |
| Nephritis & Nephrosis | 304 | |
| Septicemia | 283 | |
| Alzheimers Disease | 231 | |
| HIV | 122 | |
| Aortic Aneurysm & Dissection | 89 | |
| Atherosclerosis | 24 | |
| All Other Causes | 4,524 |
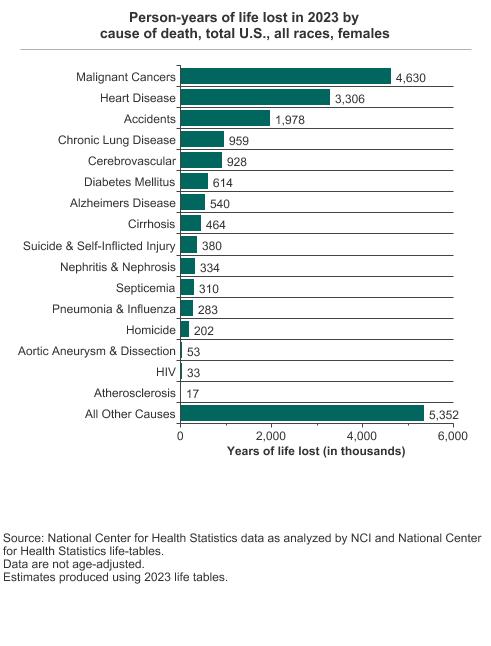
All Causes of Death, All Races, Females
| Overview graph | Cause of death | Years of life lost (in thousands) |
|---|---|---|
|
Malignant Cancers | 4,711 |
| Heart Disease | 3,181 | |
| Accidents | 1,569 | |
| Chronic Lung Disease | 1,022 | |
| Cerebrovascular | 833 | |
| Diabetes Mellitus | 549 | |
| Alzheimers Disease | 519 | |
| Suicide & Self-Inflicted Injury | 382 | |
| Cirrhosis | 351 | |
| Pneumonia & Influenza | 309 | |
| Septicemia | 306 | |
| Nephritis & Nephrosis | 302 | |
| Homicide | 178 | |
| HIV | 52 | |
| Aortic Aneurysm & Dissection | 51 | |
| Atherosclerosis | 25 | |
| All Other Causes | 4,496 |
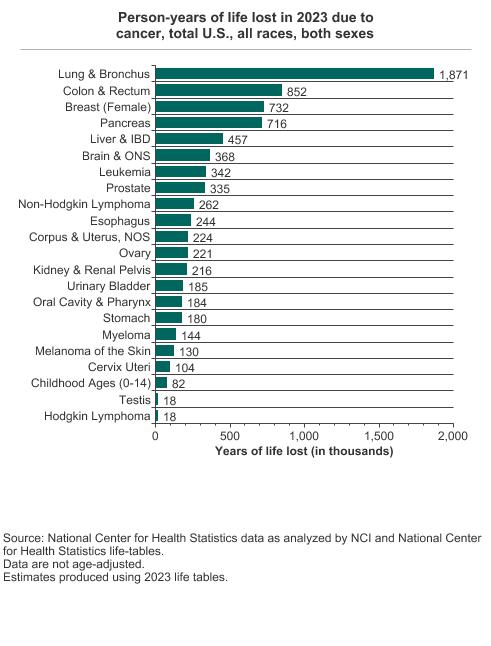
Cancer, All Races, Both Sexes
| Overview graph | Cause of death | Years of life lost (in thousands) |
|---|---|---|
|
Lung & Bronchus | 2,230 |
| Colon & Rectum | 820 | |
| Breast (Female) | 778 | |
| Pancreas | 643 | |
| Liver & IBD | 447 | |
| Leukemia | 364 | |
| Brain & ONS | 362 | |
| Prostate | 302 | |
| Non-Hodgkin Lymphoma | 278 | |
| Ovary | 252 | |
| Esophagus | 248 | |
| Kidney & Renal Pelvis | 214 | |
| Stomach | 189 | |
| Corpus & Uterus, NOS | 188 | |
| Urinary Bladder | 185 | |
| Oral Cavity & Pharynx | 172 | |
| Myeloma | 165 | |
| Melanoma of the Skin | 136 | |
| Cervix Uteri | 110 | |
| Childhood Ages (0-14) | 94 | |
| Hodgkin Lymphoma | 19 | |
| Testis | 15 |
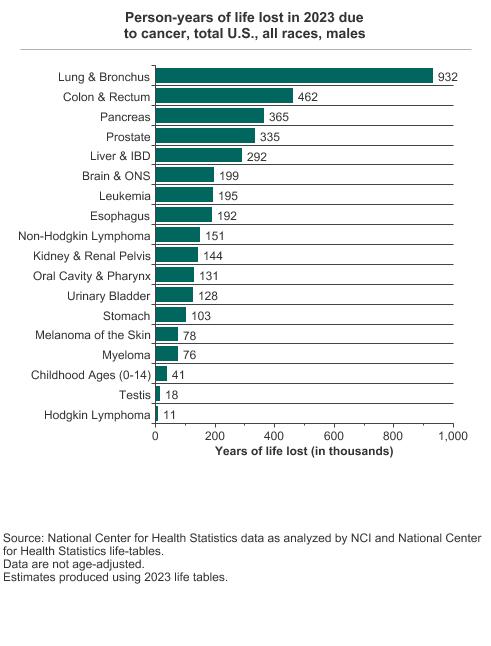
Cancer, All Races, Males
| Overview graph | Cause of death | Years of life lost (in thousands) |
|---|---|---|
|
Lung & Bronchus | 1,155 |
| Colon & Rectum | 433 | |
| Pancreas | 327 | |
| Liver & IBD | 303 | |
| Prostate | 302 | |
| Leukemia | 202 | |
| Brain & ONS | 199 | |
| Esophagus | 198 | |
| Non-Hodgkin Lymphoma | 158 | |
| Kidney & Renal Pelvis | 140 | |
| Urinary Bladder | 130 | |
| Oral Cavity & Pharynx | 122 | |
| Stomach | 110 | |
| Myeloma | 88 | |
| Melanoma of the Skin | 85 | |
| Childhood Ages (0-14) | 51 | |
| Testis | 15 | |
| Hodgkin Lymphoma | 11 |
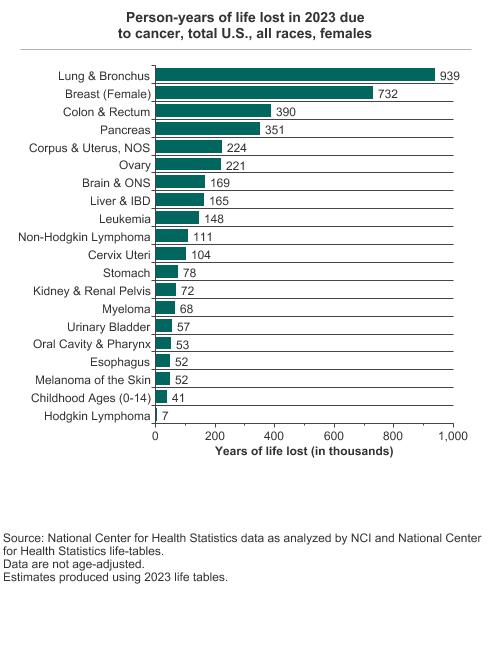
Cancer, All Races, Females
| Overview graph | Cause of death | Years of life lost (in thousands) |
|---|---|---|
|
Lung & Bronchus | 1,075 |
| Breast (Female) | 778 | |
| Colon & Rectum | 387 | |
| Pancreas | 316 | |
| Ovary | 252 | |
| Corpus & Uterus, NOS | 188 | |
| Brain & ONS | 163 | |
| Leukemia | 161 | |
| Liver & IBD | 144 | |
| Non-Hodgkin Lymphoma | 120 | |
| Cervix Uteri | 110 | |
| Stomach | 79 | |
| Myeloma | 77 | |
| Kidney & Renal Pelvis | 74 | |
| Urinary Bladder | 55 | |
| Melanoma of the Skin | 50 | |
| Oral Cavity & Pharynx | 50 | |
| Esophagus | 50 | |
| Childhood Ages (0-14) | 44 | |
| Hodgkin Lymphoma | 8 |
Additional Information on Years of Life Lost
- For Health Care Professionals. National Cancer Institute..
- Resources for Health Professionals. National Cancer Institute.
- Annual Report to the Nation on the Status of Cancer. National Cancer Institute.
- SEER Cancer Statistics Review. National Cancer Institute.
- Life Tables. U.S. Department of Health and Human Services, Centers for Disease Control and Prevention, National Center for Health Statistics National Vital Statistics System.