
Weight, Sleep, and Physical Activity - Prevention Summary Table
Only one measure per topic is displayed in the summary table. A complete set of measures, where they exist, can be found by following the More Information link in the table below.
 |
green - headed in the right direction |
 |
red - headed in the wrong direction |
 |
black - stable or non-significant change (NSC) |
 |
purple - indeterminate |
 |
blue - Healthy People 2030 target |
| Measure Name | Adolescent Physical Activity | Sleep | Weight | Adult Physical Activity |
|---|---|---|---|---|
| Year Range | 2011-2021 | 2004-2022 | 1971-2018 | 1997-2022 |
| Measure |
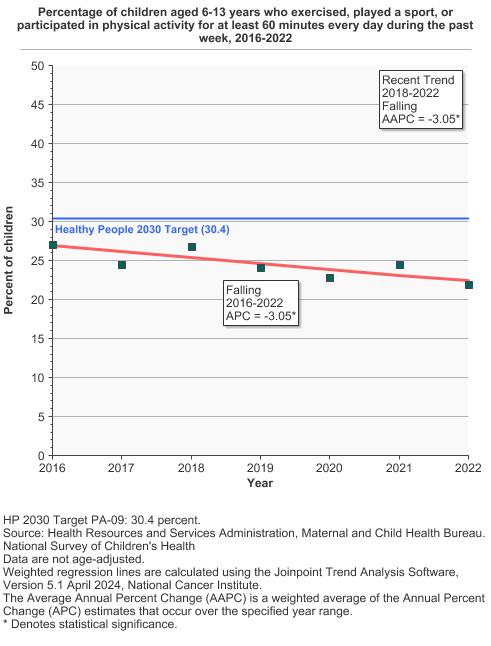
Percentage of adolescents in grades 9 through 12 who reported engaging in physical activity for at least 60 minutes on all days of the past week. Percentage of adolescents in grades 9 through 12 who participated in muscle-strengthening activity on 3 or more days of the past week. |
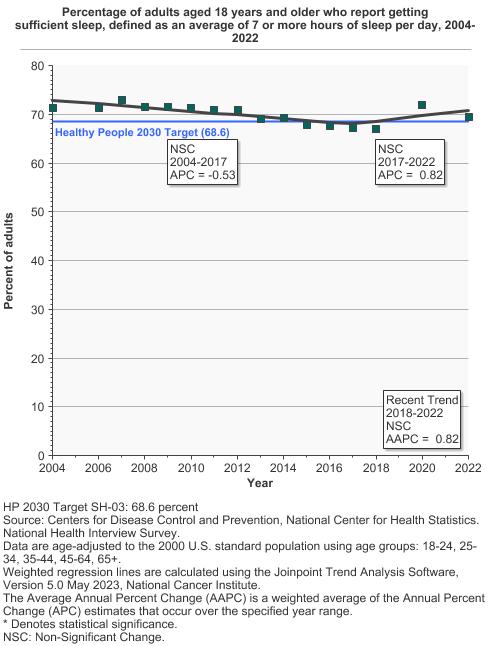
Percentage of adults aged 18 years and older who report getting sufficient sleep, defined as an average of 7 or more hours of sleep per day. |
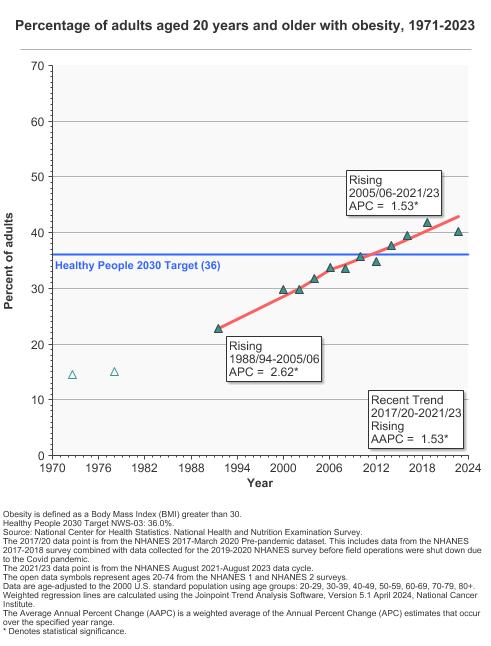
Adults: The percentage of adults aged 20 years and older with a healthy weight, overweight, or obesity. These weight groups are defined by BMI, which is calculated by dividing weight in kilograms by height in meters squared. For most adults, experts consider a BMI within the range of 18.5 to 24.9 as healthy weight, a BMI between 25 and 29.9 as overweight, and a BMI of 30 and above as having obesity. |
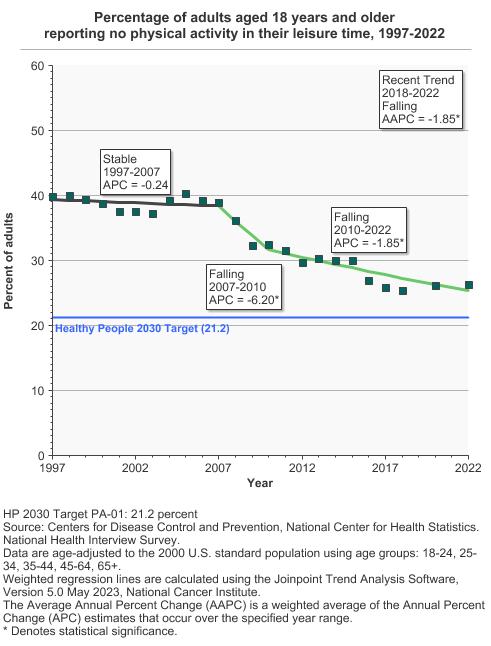
Percentage of adults aged 18 years and older who reported no leisure-time physical activity during the past month and percentage of adults who meet both the aerobic and muscle-strengthening guidelines. |
| Recent Summary Trend | Non-Significant Change | Non-Significant Change | Rising | Falling |
| Recent Summary Trend Year Range | 2017-2021 | 2018-2022 | 2013-2018 | 2018-2022 |
| Desired Direction | Rising | Rising | Falling | Falling |
| Summary Graph |
|
|
|
|
| Trends and Most Recent Estimates | In 2021, 23.9% of adolescents in grades 9-12 were physically active at least 60 minutes per day. | In 2022, 69.6% of adults 18 and older reported getting sufficient sleep. | During 2017.5, 42.4% percent of adults aged 20 years and older had obesity. | In 2022, 26.3% of adults 18 and older reported no physical activity in their leisure time. |
| Healthy People 2030 Target | Increase to 30.6% the proportion of adolescents who meet the current aerobic physical activity guideline |
Increase to 68.6 percent the proportion of adults who get sufficient sleep. |
Decrease to 36.0% percent the proportion of adults with obesity. | Reduce to 21.2% the proportion of adults who engage in no leisure-time physical activity. |
| More Information | Adolescent Physical Activity | Sleep | Weight | Adult Physical Activity |
| Last Updated | March 2024 | March 2024 | March 2024 | March 2024 |
| Measure Name | Adolescent Physical Activity |
|---|---|
| Year Range | 2011-2021 |
| Measure |
Percentage of adolescents in grades 9 through 12 who reported engaging in physical activity for at least 60 minutes on all days of the past week. Percentage of adolescents in grades 9 through 12 who participated in muscle-strengthening activity on 3 or more days of the past week. |
| Recent Summary Trend | Non-Significant Change |
| Recent Summary Trend Year Range | 2017-2021 |
| Desired Direction | Rising |
| Summary Graph |
|
| Trends and Most Recent Estimates | In 2021, 23.9% of adolescents in grades 9-12 were physically active at least 60 minutes per day. |
| Healthy People 2020 Target | Increase to 30.6% the proportion of adolescents who meet the current aerobic physical activity guideline |
| More Information | Adolescent Physical Activity |
| Measure Name | Sleep |
|---|---|
| Year Range | 2004-2022 |
| Measure |
Percentage of adults aged 18 years and older who report getting sufficient sleep, defined as an average of 7 or more hours of sleep per day. |
| Recent Summary Trend | Non-Significant Change |
| Recent Summary Trend Year Range | 2018-2022 |
| Desired Direction | Rising |
| Summary Graph |
|
| Trends and Most Recent Estimates | In 2022, 69.6% of adults 18 and older reported getting sufficient sleep. |
| Healthy People 2020 Target |
Increase to 68.6 percent the proportion of adults who get sufficient sleep. |
| More Information | Sleep |
| Measure Name | Adult Physical Activity |
|---|---|
| Year Range | 1997-2022 |
| Measure |
Percentage of adults aged 18 years and older who reported no leisure-time physical activity during the past month and percentage of adults who meet both the aerobic and muscle-strengthening guidelines. |
| Recent Summary Trend | Falling |
| Recent Summary Trend Year Range | 2018-2022 |
| Desired Direction | Falling |
| Summary Graph |
|
| Trends and Most Recent Estimates | In 2022, 26.3% of adults 18 and older reported no physical activity in their leisure time. |
| Healthy People 2020 Target | Reduce to 21.2% the proportion of adults who engage in no leisure-time physical activity. |
| More Information | Adult Physical Activity |
| Measure Name | Weight |
|---|---|
| Year Range | 1971-2018 |
| Measure |
Adults: The percentage of adults aged 20 years and older with a healthy weight, overweight, or obesity. These weight groups are defined by BMI, which is calculated by dividing weight in kilograms by height in meters squared. For most adults, experts consider a BMI within the range of 18.5 to 24.9 as healthy weight, a BMI between 25 and 29.9 as overweight, and a BMI of 30 and above as having obesity. |
| Recent Summary Trend | Rising |
| Recent Summary Trend Year Range | 2013-2018 |
| Desired Direction | Falling |
| Summary Graph |
|
| Trends and Most Recent Estimates | During 2017.5, 42.4% percent of adults aged 20 years and older had obesity. |
| Healthy People 2020 Target | Decrease to 36.0% percent the proportion of adults with obesity. |
| More Information | Weight |