On This Page:
- Background
- Measure
- Healthy People 2030 Target
- Data Source
- Trends and Most Recent Estimates
- Related Cancers
- Additional Information
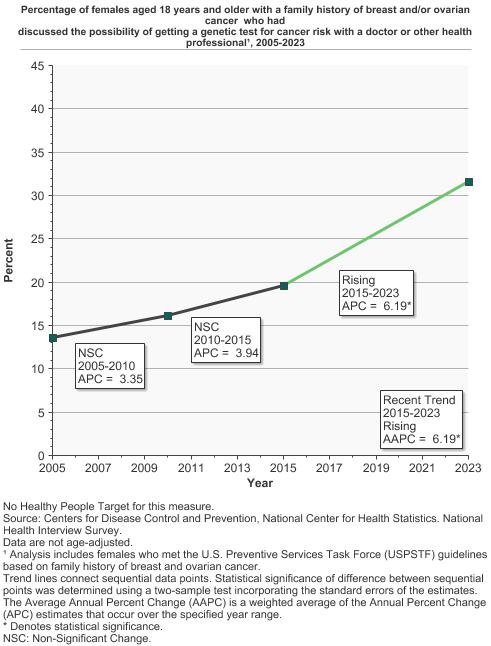
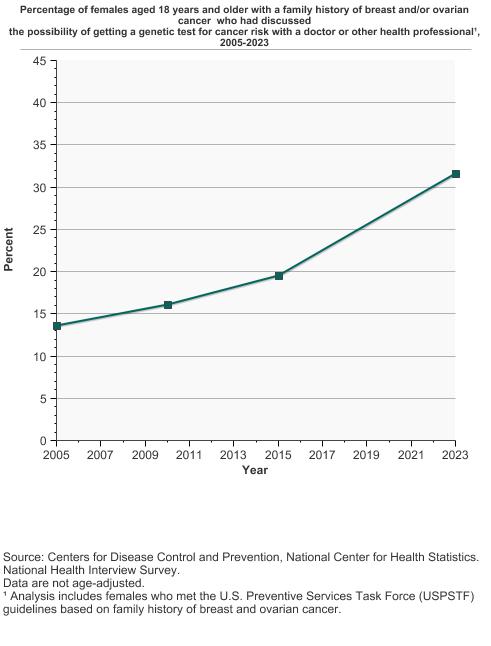
In 2023, 31.6% of females aged 18 years and older with a family history of breast and/or ovarian cancer had discussed the possibility of getting a genetic test for cancer risk with a doctor or other health professional.
Background
Genetic testing looks for specific inherited changes (or genetic mutations) in a person’s DNA that may increase their chance of developing a disease such as cancer. Genetic testing should be considered if personal or family history suggests an inherited cancer risk condition based on established criteria, such as those for breast or ovarian cancer risk. The test results can help guide a person’s future medical care.
Any person who is considering genetic testing should speak with a genetic counselor before deciding whether to be tested. A genetic counselor is a health professional who has special training in medical genetics and counseling. Genetic counselors can discuss the risks, benefits, and limitations of genetic testing for individuals to help them understand their situation.
Measure
Percentage of females aged 18 years and older with a family history of breast and/or ovarian cancer, but without a personal history, who had discussed the possibility of getting a genetic test for cancer risk with a doctor or other health professional, 2005-2023.
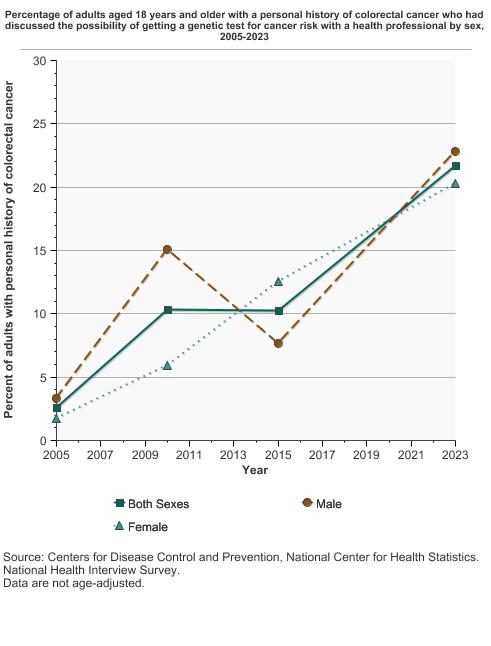
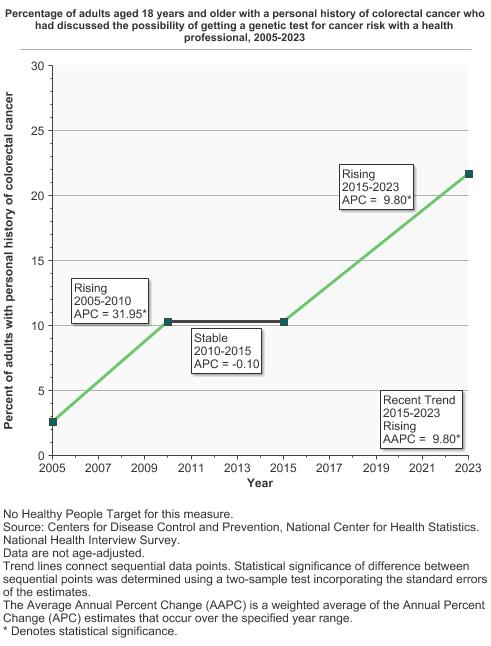
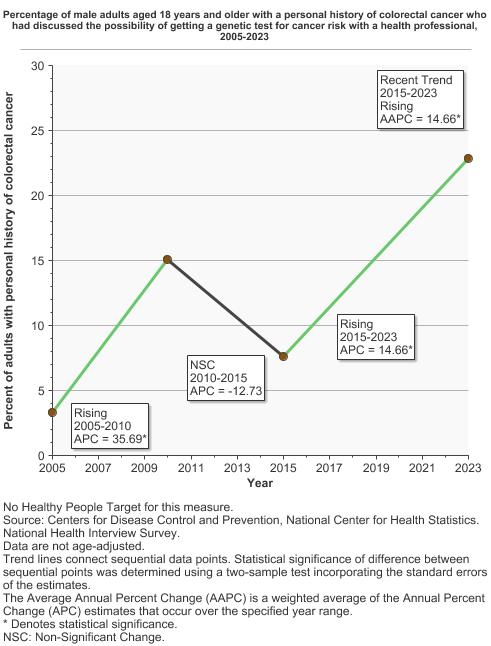
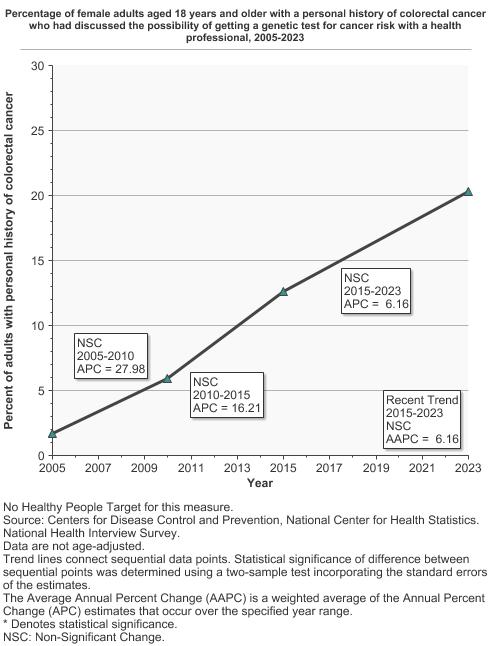
Percentage of adults aged 18 years and older with a personal history of colorectal cancer who had discussed the possibility of getting a genetic test for cancer risk with a doctor or other health professional, by sex, 2005-2023.
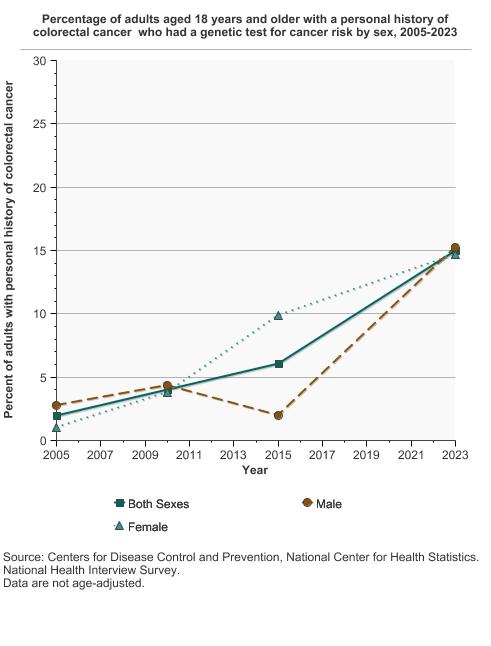
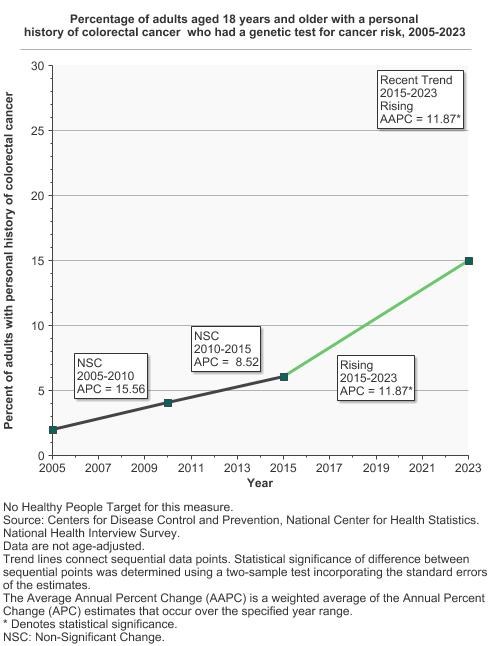
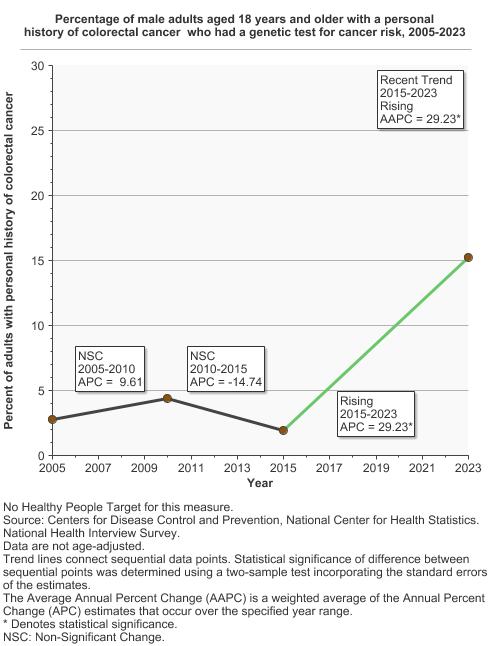
Percentage of adults aged 18 years and older with a personal history of colorectal cancer who had a genetic test for cancer risk, by sex, 2005-2023.
Note: The US Preventative Services Task Force (USPSTF) recommends that females aged 18 years and older talk to their doctor about the possibility of getting a genetic test for cancer risk if they have a personal or family history of breast cancer. The relevant trends shown in this web page include females without a personal history of breast cancer and with family history defined as any of the following:
- 2 first degree relatives with breast cancer, 1 of whom received the diagnosis at age <=50
- Combination of 3 or more first degree relatives with breast cancer regardless of age at diagnosis
- Combination of both breast and ovarian cancer among first degree relatives
- Combination of 2 or more first degree relatives with ovarian cancer regardless of age
- History of breast cancer in a male relative
Data Source
Centers for Disease Control and Prevention, National Center for Health Statistics. National Health Interview Survey NCI and CDC co-sponsored Cancer Control Supplement, 2005-2023.
Refer to the Data Sources page for more information about data collection years 2019+.
Healthy People 2030 Target
- (Developmental Objective) Increase the proportion of women with a family history of breast and/or ovarian cancer who receive genetic counseling.
- (Research Objective) Increase the proportion of persons with newly diagnosed colorectal cancer who receive genetic testing to identify Lynch syndrome or familial colorectal cancer syndromes.
Healthy People 2030 is a set of goals set forth by the Department of Health and Human Services.
Note: Healthy People 2030 Developmental and Research Objectives do not have targets, so there is no target line on the Detailed Trend Graphs. Learn more about different types of Healthy People Objectives.
Trends and Most Recent Estimates
- Breast and Ovarian Cancer
Percentage of females aged 18 years and older with a family history of breast and/or ovarian cancer who had discussed the possibility of getting a genetic test for cancer risk with a doctor or other health professional¹, 2005-2023 Overview Graph Detailed Trend Graphs Most Recent Estimates (2023) Percent 95% Confidence Interval 

Discussed the Possibility of a Genetic Test for Cancer Risk 
31.6 27.1 - 36.5 ¹ Analysis includes females who met the U.S. Preventive Services Task Force (USPSTF) guidelines based on family history of breast and ovarian cancer. - Colorectal Cancer
Genetic Counseling
Percentage of adults aged 18 years and older with a personal history of colorectal cancer who had discussed the possibility of getting a genetic test for cancer risk with a health professional by sex, 2005-2023 Overview Graph Detailed Trend Graphs Most Recent Estimates (2023) Percent of adults with personal history of colorectal cancer 95% Confidence Interval 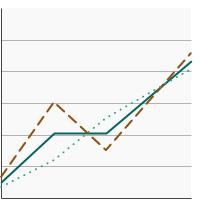
Both Sexes 21.7 15.6 - 29.4 Male 22.8 13.9 - 35.2 Female 20.3 13.3 - 29.8 Genetic Testing
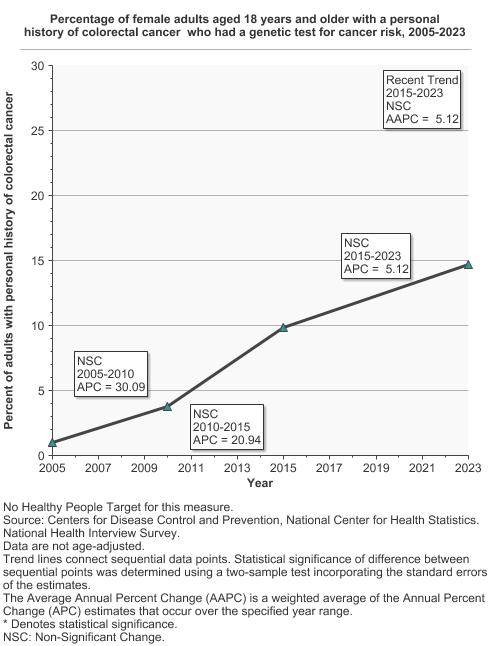
Percentage of adults aged 18 years and older with a personal history of colorectal cancer who had a genetic test for cancer risk by sex, 2005-2023 Overview Graph Detailed Trend Graphs Most Recent Estimates (2023) Percent of adults with personal history of colorectal cancer 95% Confidence Interval 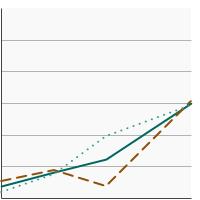
Both Sexes 15.0 9.7 - 22.5 Male 15.3 7.7 - 28.0 Female 14.7 8.9 - 23.2
Additional Information
- The Genetics of Cancer. National Cancer Institute.
- Genetic Testing for Inherited Cancer Susceptibility Syndromes. National Cancer Institute.
- Genetic Testing for Cancer Risk. American Society of Clinical Oncology.
- Cancer Genetics Overview (PDQ®)–Health Professional Version. National Cancer Institute.
- Cancer Genetics Risk Assessment and Counseling (PDQ®)–Health Professional Version. National Cancer Institute.
- Prevalence of Americans reporting a family history of cancer indicative of increased cancer risk: Estimates from the 2015 National Health Interview Survey. Kumerow MT, Rodriguez JL, Dai S, Kolor K, Rotunno M, Peipins LA. Prev Med. 2022;159:107062.
- Risk Assessment, Genetic Counseling, and Genetic Testing for BRCA-Related Cancer. U.S. Preventive Services Task Force, Owens DK, Davidson KW, et al. JAMA 2019; 322(7): 652-65.
- NCCN Guidelines Insights: Genetic/Familial High-Risk Assessment: Colorectal, Version 2.2019. Gupta S, Provenzale D, Llor X, et al. J Natl Compr Canc Netw. 2019 Sep 1;17(9):1032-1041.
- Genetic/familial high-risk assessment: breast and ovarian, version 2.2015. Daly MB, Pilarski R, Axilbund JE, et al. J Natl Compr Canc Netw 2016; 14(12): 153-62.