On This Page:
- Background
- Measure
- Healthy People 2030 Target
- Data Source
- Trends and Most Recent Estimates
- Related Cancers
- Additional Information
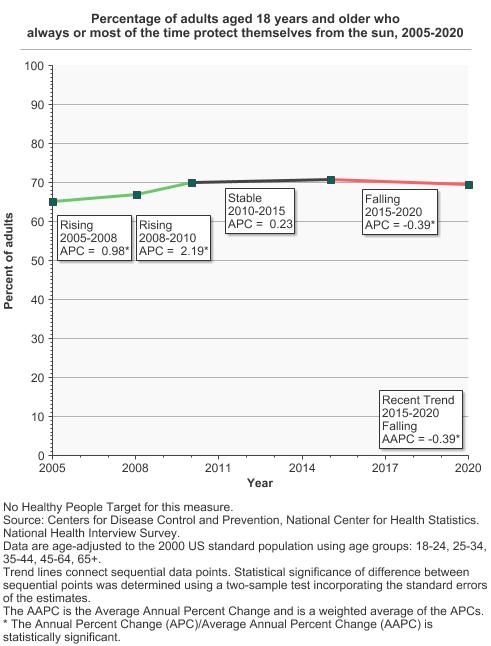
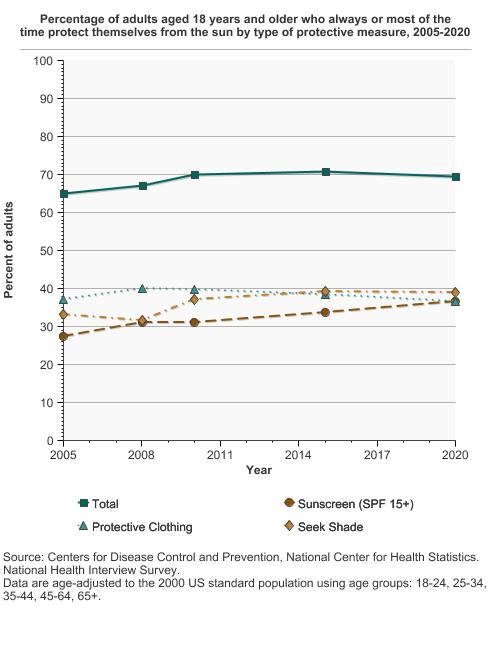
In 2020, 69.4% of adults said they usually or always protect themselves from the sun by practicing at least one of three sun protection behaviors.
Background
Avoiding sunburns and intermittent high-intensity sun exposure (especially in children, teens, and young adults) reduces the chances of getting melanoma skin cancer. Engaging in sun-protective behaviors when outside can reduce one’s exposure to ultraviolet (UV) radiation and sunburn. For example, avoiding intense sun when possible and seeking shade can reduce the risk of sunburn, and one of the goals of the Surgeon General’s Call To Action to Prevent Skin Cancer is to increase the availability of shade in outdoor recreation, education, and workplace environments. Additional behaviors such as wearing sun-protective clothing (e.g., long sleeve shirt, long pants, and wide brim hat) and sunglasses can help prevent excessive exposure to UV. Broad spectrum sunscreen (protects against UVA and UVB) with a sun protection factor of 15 or higher (SPF15 or higher) should be used in combination with other sun-protective behaviors and applied appropriately (e.g., proper amount applied prior to sun exposure and with timely reapplication).
Although sunbathing and tanning are strongly associated with sunburn, recent data indicate that most sunburns occur in contexts unrelated to intentional tanning. Results suggest the need to promote multiple forms of sun protection tailored to specific contexts, especially when being physically active and when spending time near the water.
Protective behaviors are most needed when UV intensity is greatest, which occurs during the summer time and between 10 am and 4 pm. However, UV index can also be high during cloudy days, and for some regions of the U.S., such as the southeast and southwest, UV intensity is high year-round. To help maximize one’s protection, multiple sun-protective behaviors should be practiced, especially for those with sun sensitive skin. People with sun sensitive skin are relatively more likely to incur sunburn and are at greater risk for skin cancer. Sun sensitivity reflects a person’s characteristic skin response (e.g., a burn, a burn and then tan, etc.) after prolonged sun exposure or after a long period or season of being relatively unexposed. Though related to sun sensitivity, skin color and ethnicity are not adequate proxies for sun sensitivity.
The Food and Drug Administration regulates standards for sunscreen content and labeling to provide accurate information and better ensure formulations deliver the advertised benefits.
Measure
The percentage of adults aged 18 years and older who reported that they usually or always practice at least one of three sun-protective behaviors - using sunscreen, wearing protective clothing (a long-sleeve shirt, and/or wide brimmed hat shading the face, ears, and neck, and/or long pants/long skirt), or seeking shade when going outside on a sunny day for more than an hour.
Beginning in 2005, the question on hat use (as part of protective clothing) was modified to more accurately distinguish baseball caps (which do not fully protect the face, neck, and ears) from other types of fully protective hats. Graphic illustrations of different hats were used, and respondents were asked a separate question about baseball cap and sun visor use. Also, long pants/long skirt was an item added in 2005.
The data series for this measure page have differing years of availability with 'protective clothing' available for 2005+, 'sunscreen use (SPF 15+)' available for 2000+ and 'likely to seek shade' available for 1992+. For the graphs that compare the different methods or present a total of all three protection types, trends were calculated for 2005+. For graphs that show the series individually, the full range of available data is shown.
Data Source
Centers for Disease Control and Prevention, National Center for Health Statistics. National Health Interview Survey NCI and CDC co-sponsored Cancer Control Supplement, 1992-2010, 2005–2015.
Refer to the Data Sources page for more information about data collection years 2019+.
Healthy People 2030 Target
- There are no Healthy People 2030 targets regarding protective measures that may reduce the risk of skin cancer.
Healthy People 2030 is a set of goals set forth by the Department of Health and Human Services.
Trends and Most Recent Estimates
- Sun Protection Methods
-
Percentage of adults aged 18 years and older who always or most of the time protect themselves from the sun by type of protective measure, 2005-2020 Overview Graph Detailed Trend Graphs Most Recent Estimates (2020) Percent of adults 95% Confidence Interval 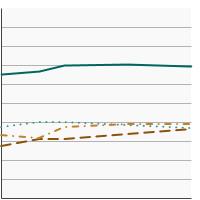

Total 
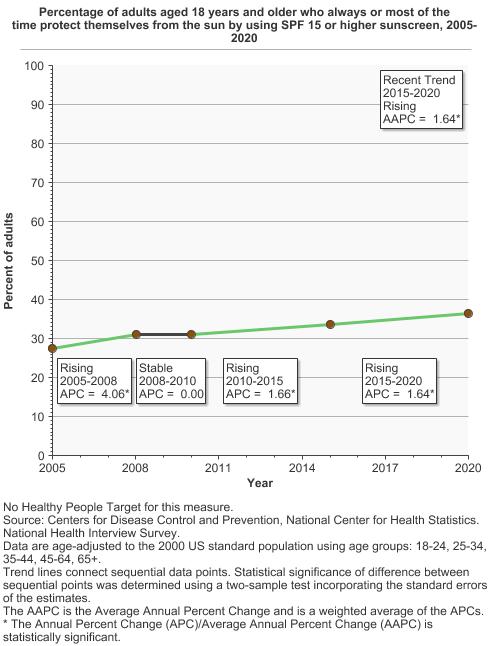
69.4 68.5 - 70.3 Sunscreen (SPF 15+)
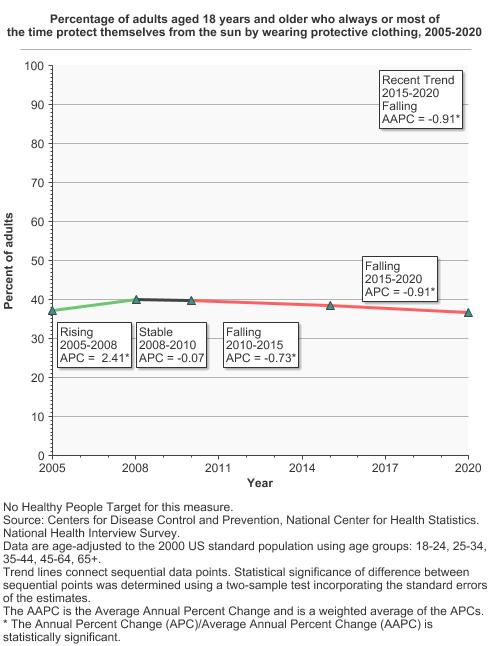
36.5 35.7 - 37.3 Protective Clothing
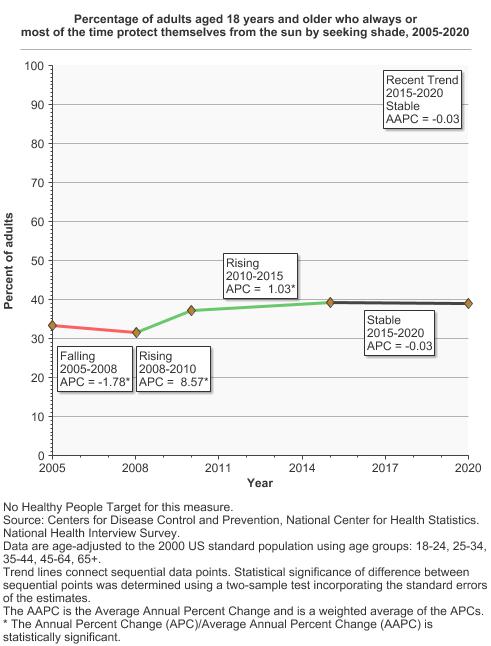
36.7 35.8 - 37.6 Seek Shade
39.1 38.1 - 40.0 - Use Some Type of Protection
-
- By Sex
-
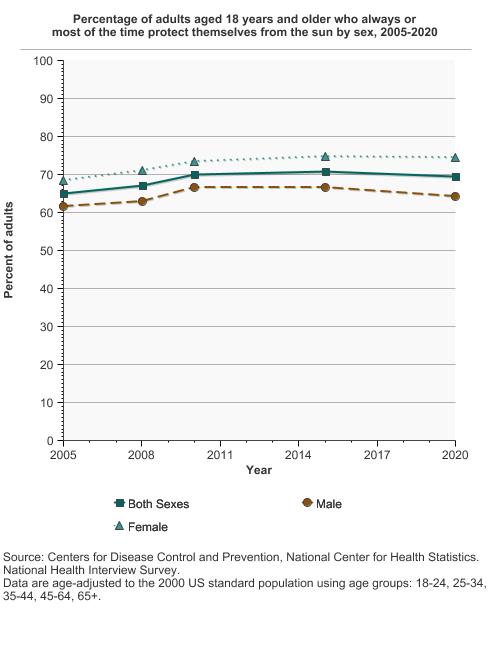
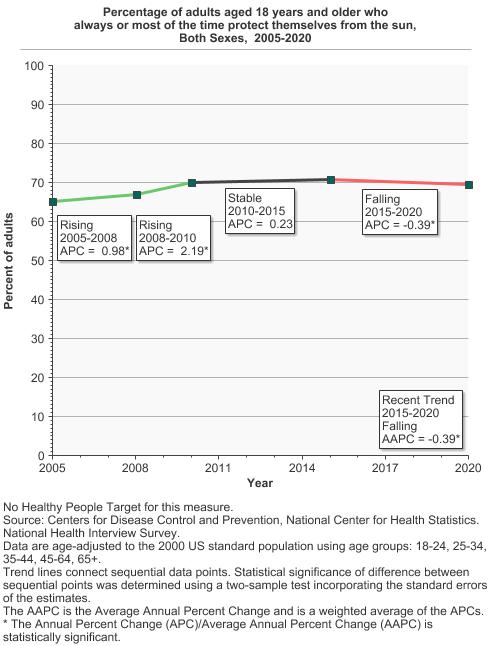
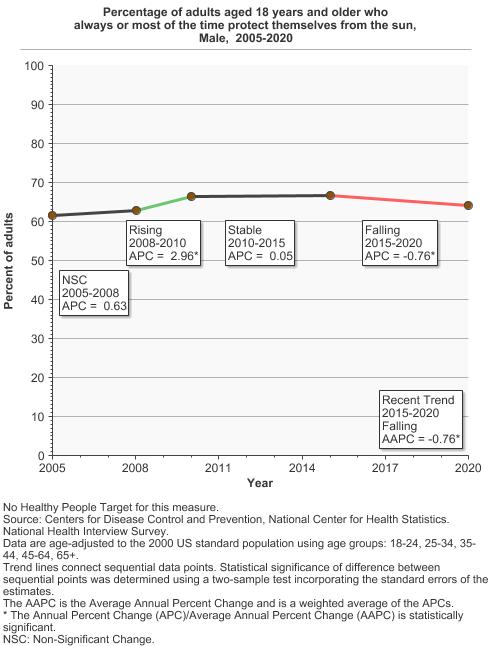
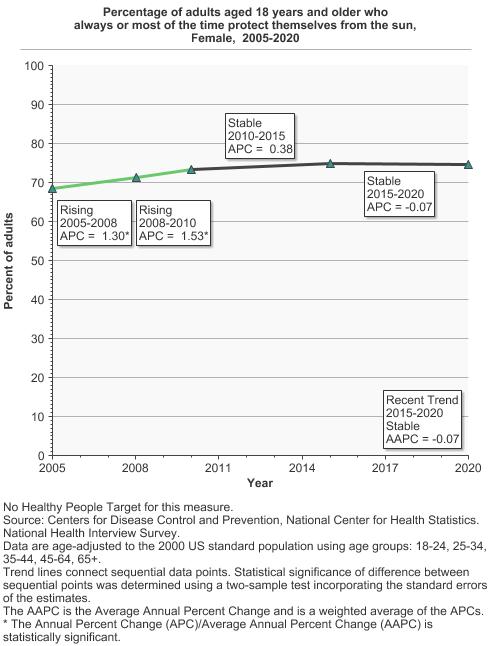
Percentage of adults aged 18 years and older who always or most of the time protect themselves from the sun by sex, 2005-2020 Overview Graph Detailed Trend Graphs Most Recent Estimates (2020) Percent of adults 95% Confidence Interval 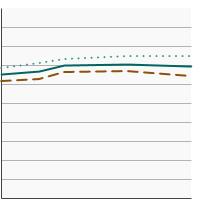
Both Sexes
69.4 68.5 - 70.3 Male
64.2 63.0 - 65.4 Female
74.5 73.4 - 75.5 - By Race/Ethnicity
-
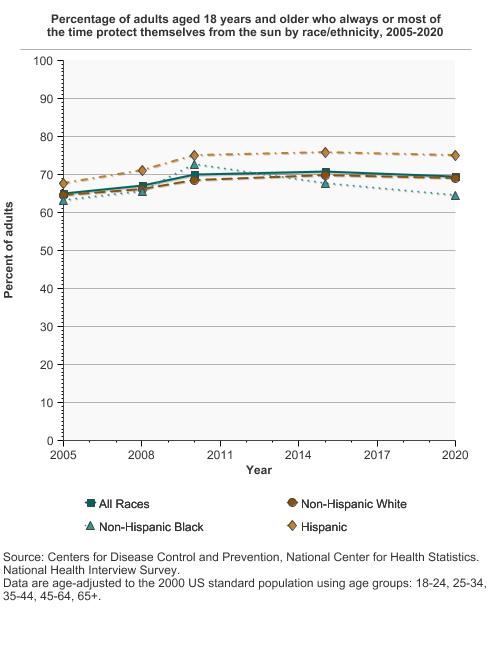
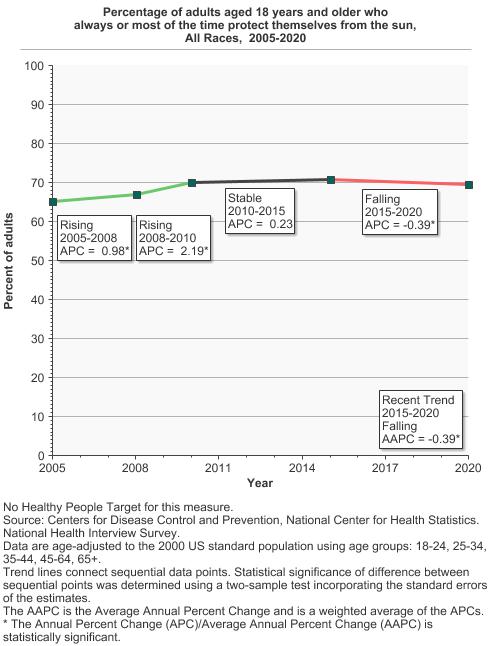
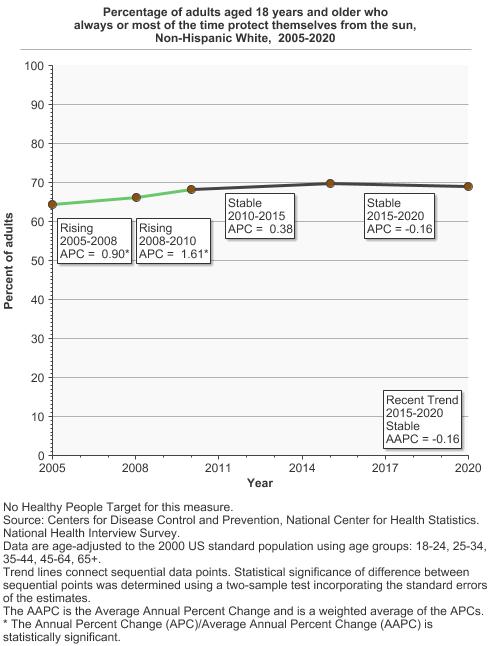
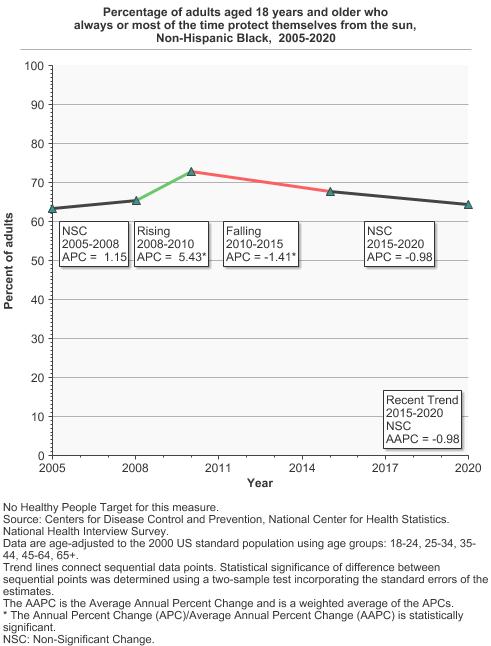
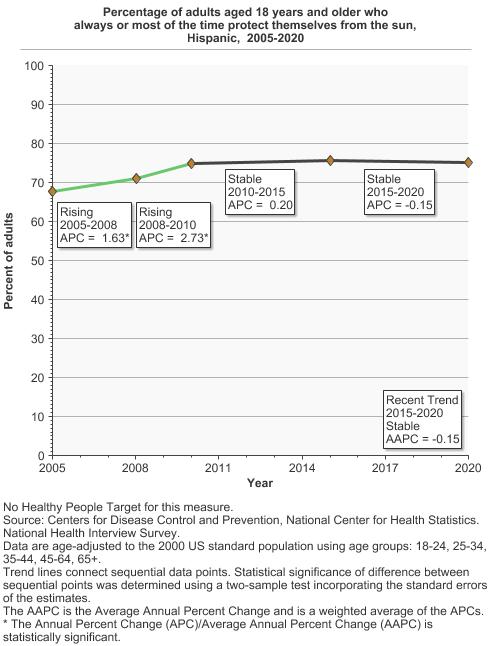
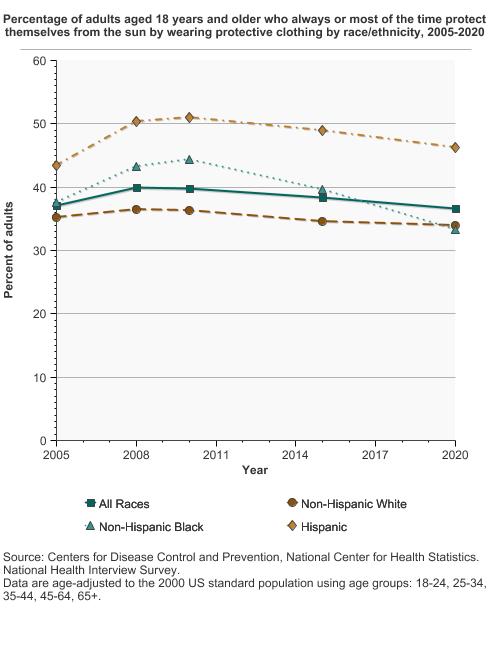
Percentage of adults aged 18 years and older who always or most of the time protect themselves from the sun by race/ethnicity, 2005-2020 Overview Graph Detailed Trend Graphs Most Recent Estimates (2020) Percent of adults 95% Confidence Interval 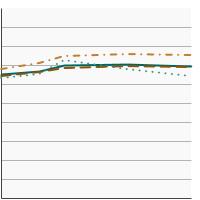
All Races
69.4 68.5 - 70.3 Non-Hispanic White
69.1 68.0 - 70.1 Non-Hispanic Black
64.5 62.0 - 66.9 Hispanic
75.1 73.3 - 76.8 - By Age
-
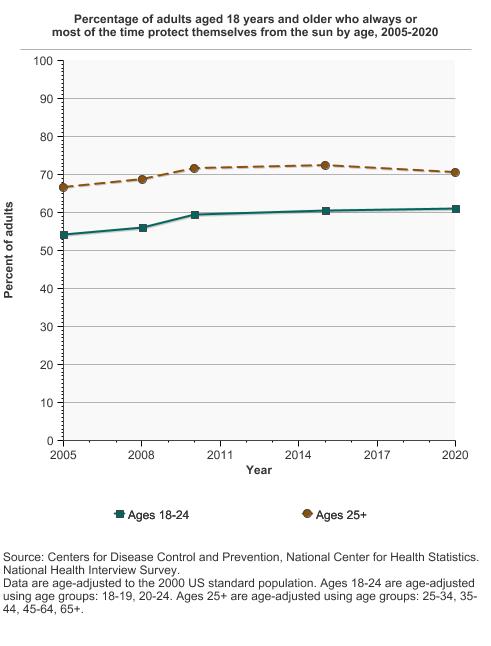
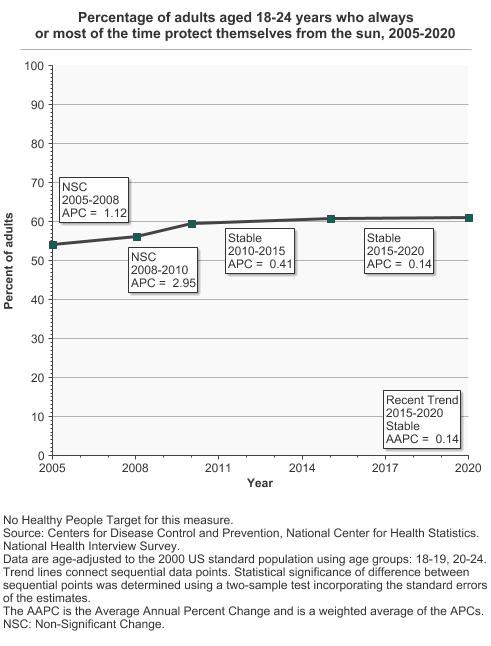
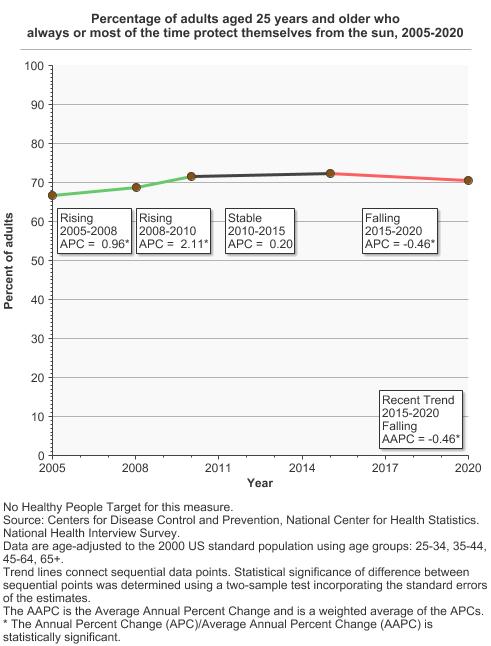
Percentage of adults aged 18 years and older who always or most of the time protect themselves from the sun by age, 2005-2020 Overview Graph Detailed Trend Graphs Most Recent Estimates (2020) Percent of adults 95% Confidence Interval 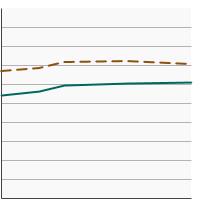
Ages 18-24
61.1 58.2 - 63.9 Ages 25+
70.6 69.7 - 71.5 - By Sex and Age
-
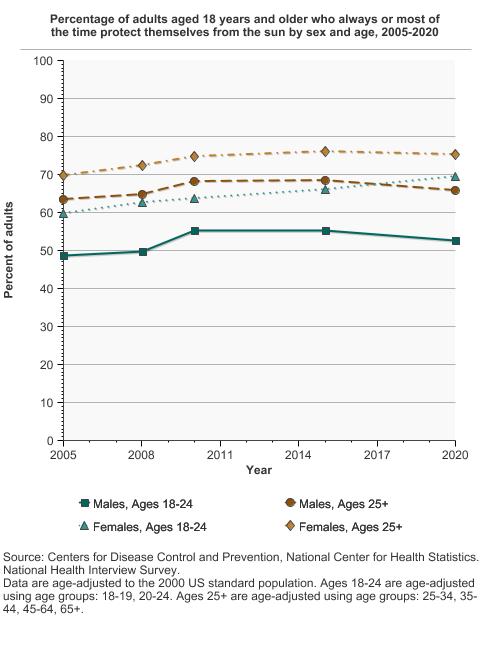
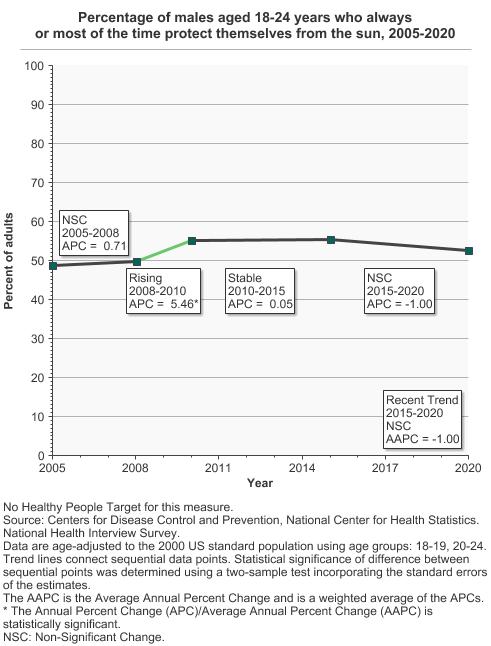
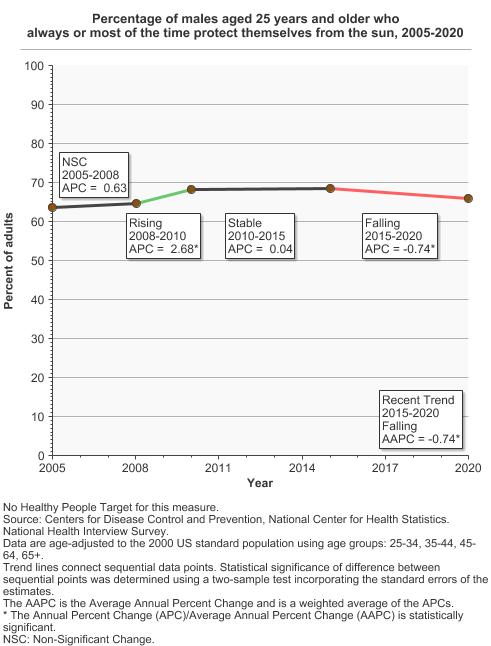
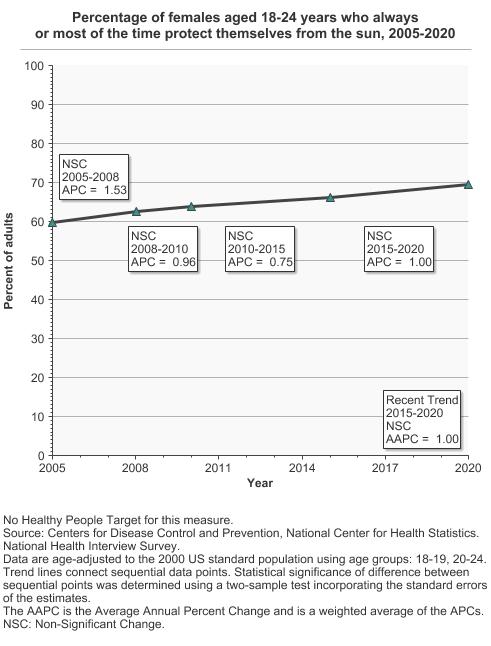
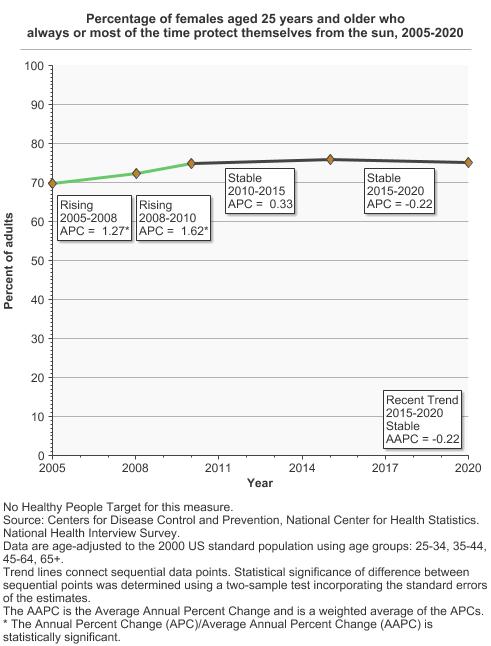
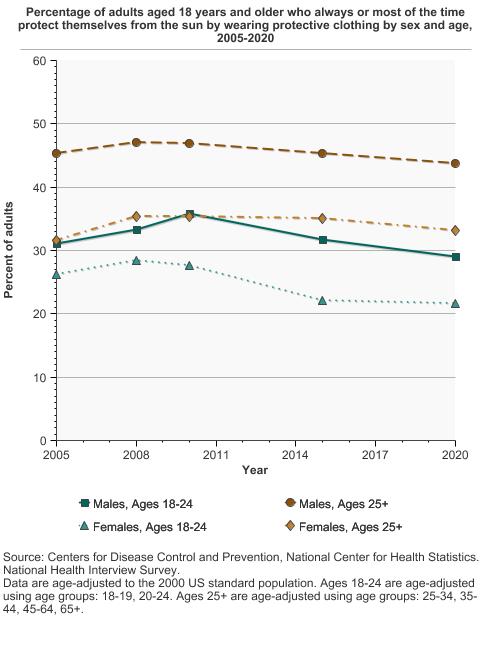
Percentage of adults aged 18 years and older who always or most of the time protect themselves from the sun by sex and age, 2005-2020 Overview Graph Detailed Trend Graphs Most Recent Estimates (2020) Percent of adults 95% Confidence Interval 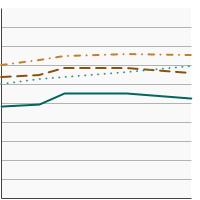
Males, Ages 18-24
52.7 48.4 - 56.9 Males, Ages 25+
65.8 64.6 - 67.0 Females, Ages 18-24
69.5 65.5 - 73.3 Females, Ages 25+
75.2 74.1 - 76.2 - By Poverty Income Level
-
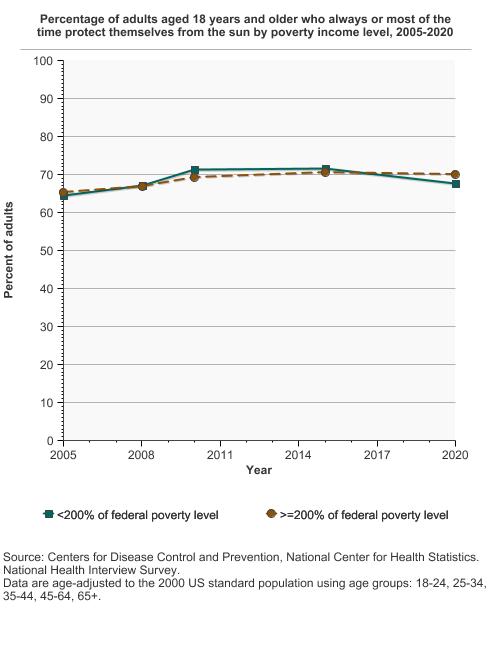
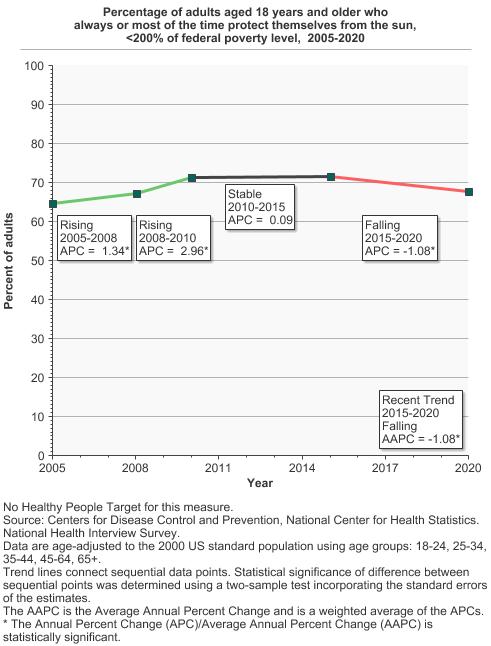
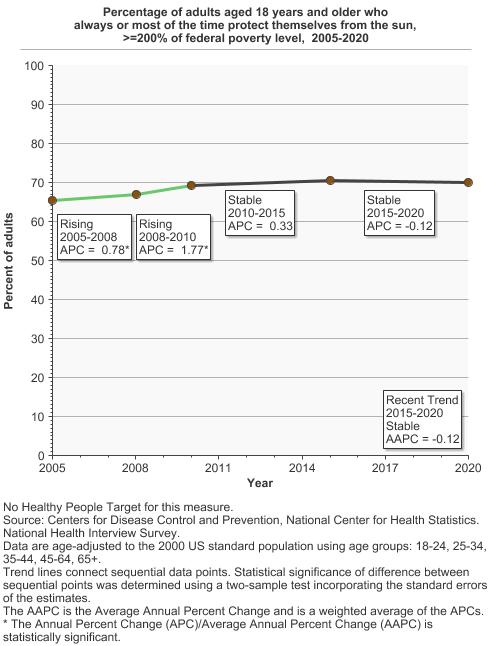
Percentage of adults aged 18 years and older who always or most of the time protect themselves from the sun by poverty income level, 2005-2020 Overview Graph Detailed Trend Graphs Most Recent Estimates (2020) Percent of adults 95% Confidence Interval 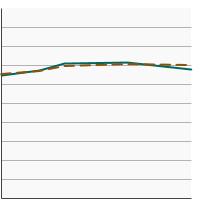
<200% of federal poverty level
67.7 66.2 - 69.3 >=200% of federal poverty level
70.0 69.1 - 71.0 - By Education Level
-
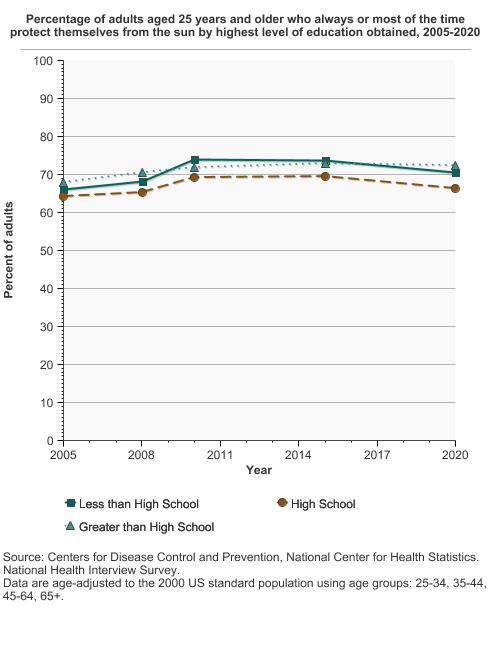
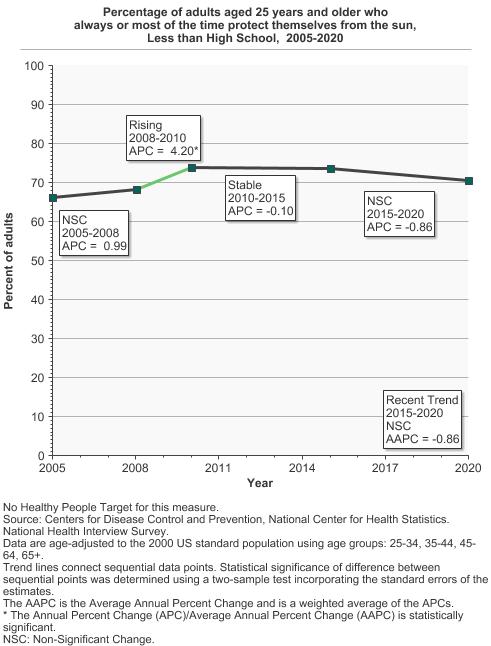
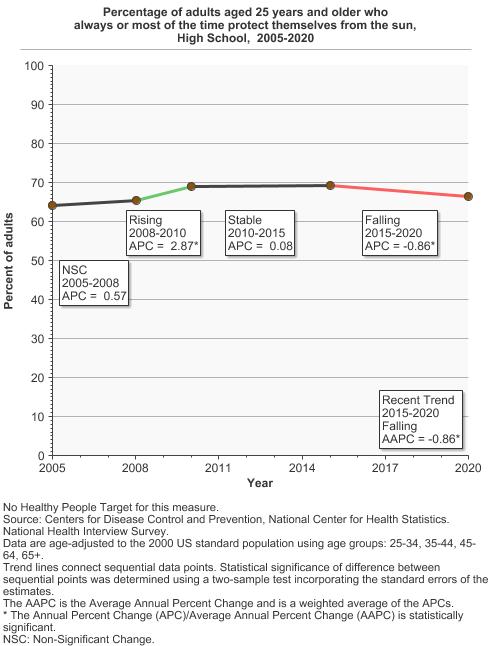
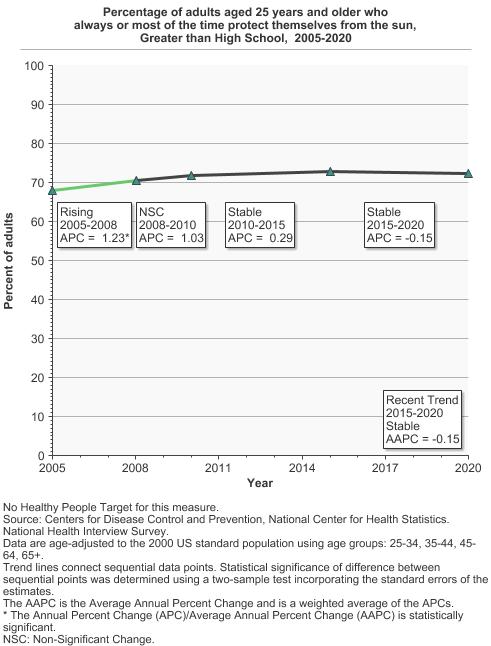
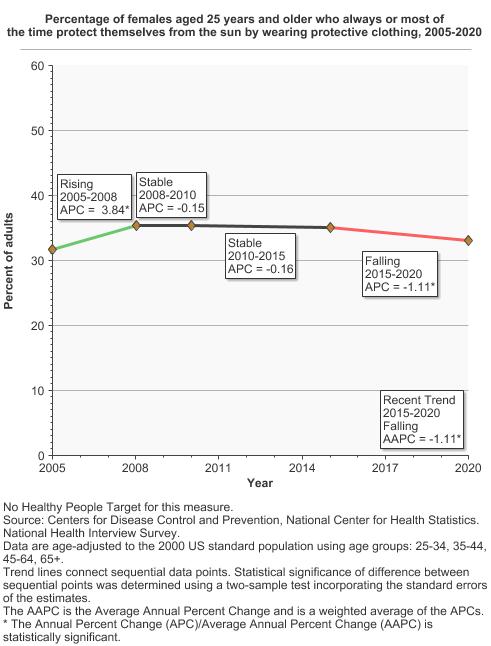
Percentage of adults aged 25 years and older who always or most of the time protect themselves from the sun by highest level of education obtained, 2005-2020 Overview Graph Detailed Trend Graphs Most Recent Estimates (2020) Percent of adults 95% Confidence Interval 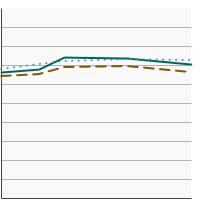
Less than High School
70.5 67.4 - 73.4 High School
66.4 64.7 - 68.0 Greater than High School
72.4 71.5 - 73.3 - By Sun Sensitivity
-
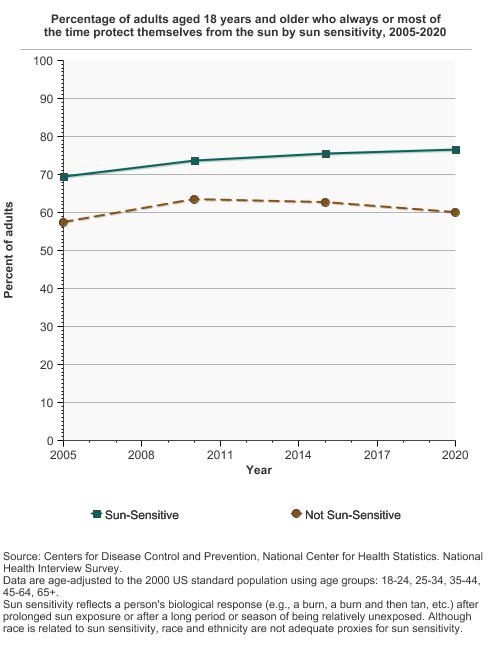
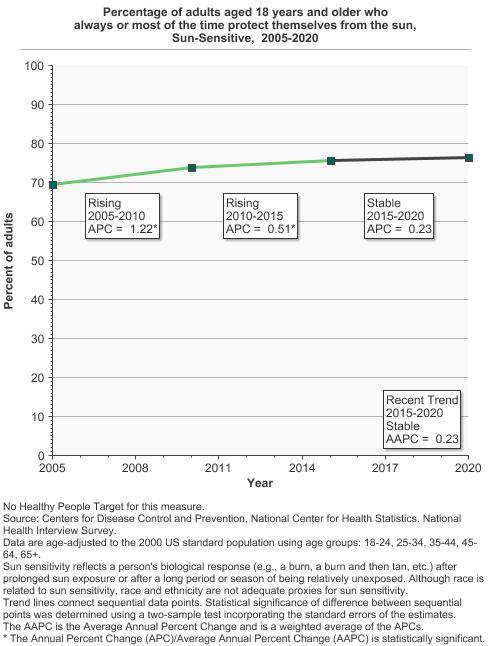
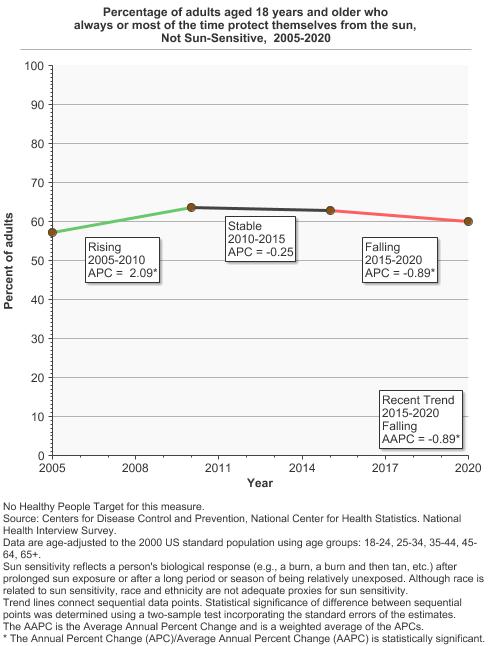
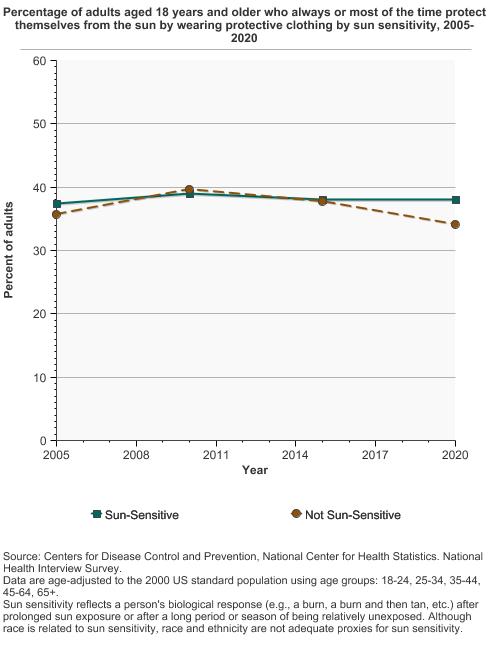
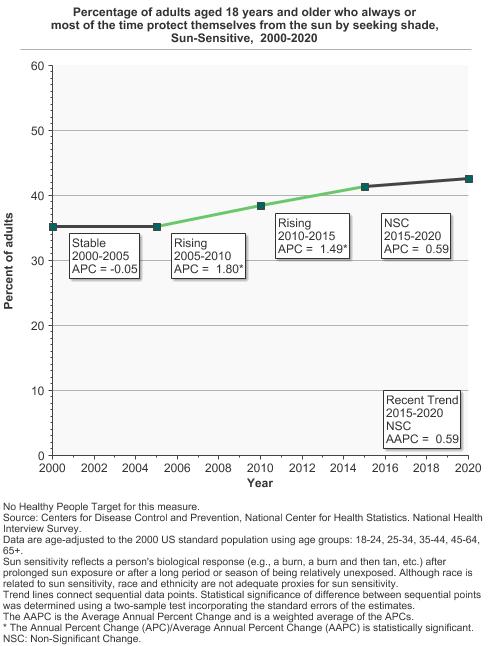
Percentage of adults aged 18 years and older who always or most of the time protect themselves from the sun by sun sensitivity, 2005-2020 Overview Graph Detailed Trend Graphs Most Recent Estimates (2020) Percent of adults 95% Confidence Interval 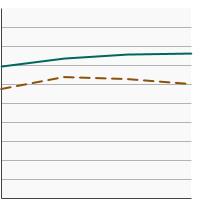
Sun-Sensitive
76.5 75.5 - 77.5 Not Sun-Sensitive
60.0 58.7 - 61.3 Sun sensitivity reflects a person's biological response (e.g., a burn, a burn and then tan, etc.) after prolonged sun exposure or after a long period or season of being relatively unexposed. Although race is related to sun sensitivity, race and ethnicity are not adequate proxies for sun sensitivity.
- Use Sunscreen
-
- By Sex
-
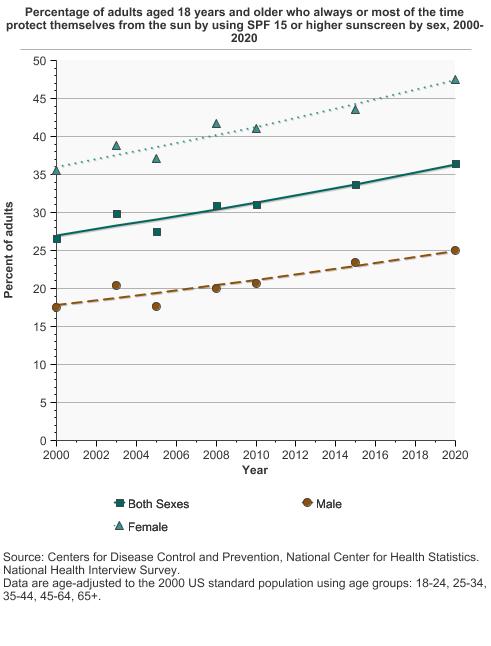
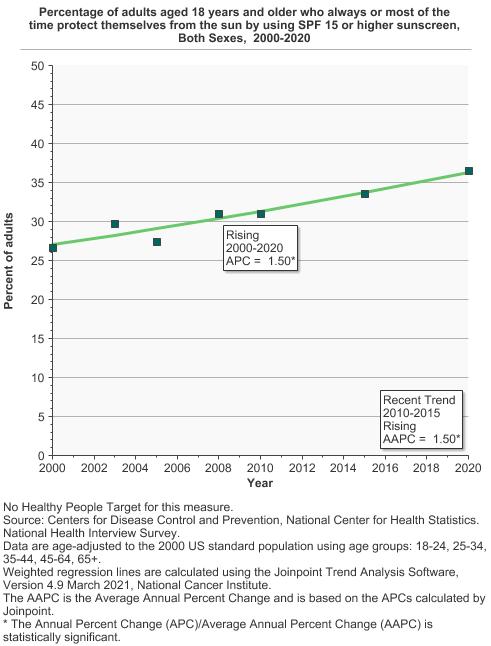
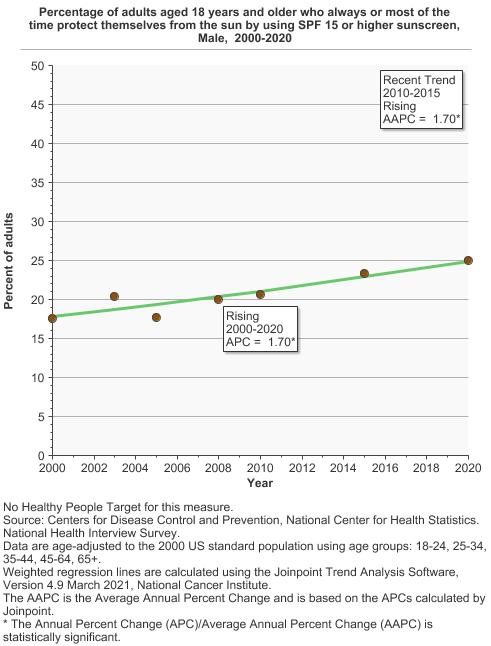
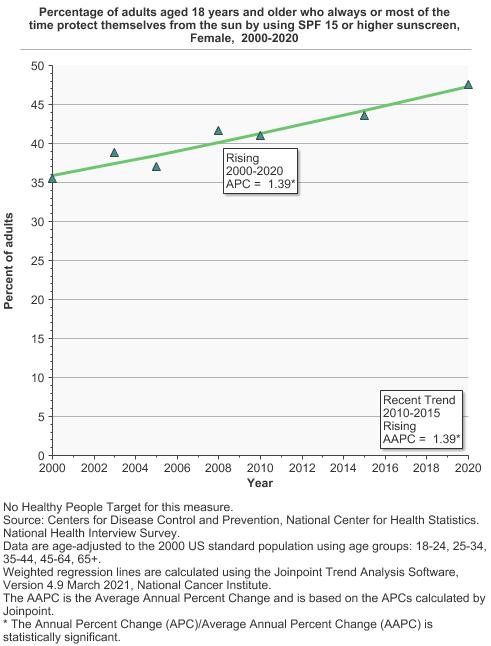
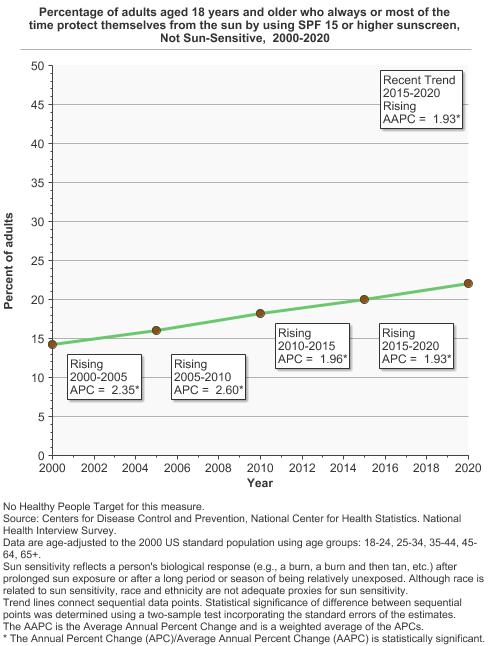
Percentage of adults aged 18 years and older who always or most of the time protect themselves from the sun by using SPF 15 or higher sunscreen by sex, 2000-2020 Overview Graph Detailed Trend Graphs Most Recent Estimates (2020) Percent of adults 95% Confidence Interval 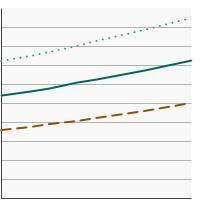
Both Sexes
36.5 35.7 - 37.3 Male
25.0 24.1 - 25.9 Female
47.5 46.4 - 48.7 - By Race/Ethnicity
-
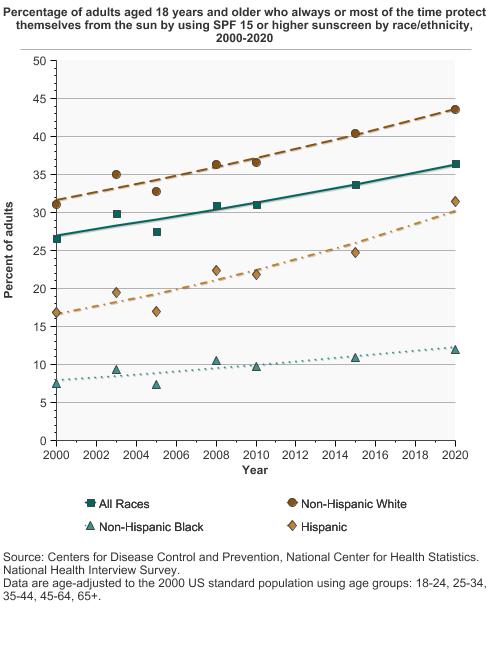
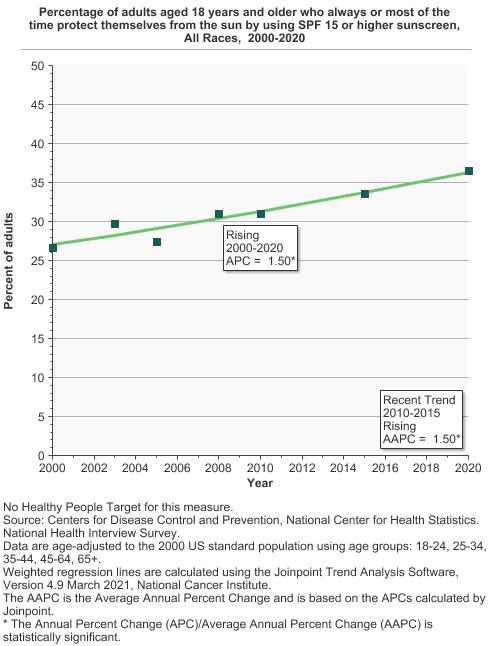
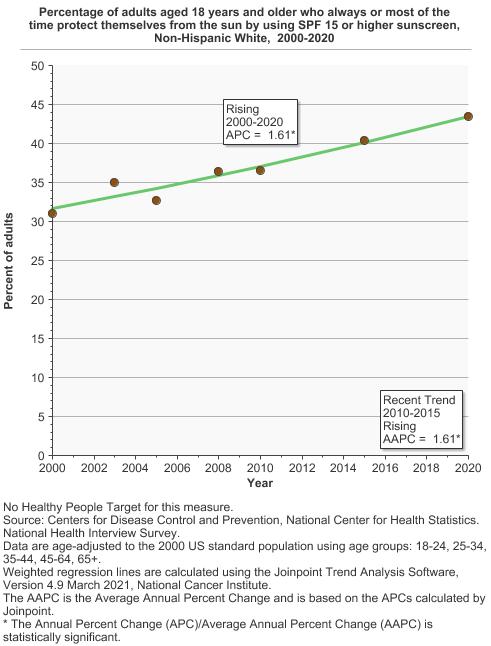
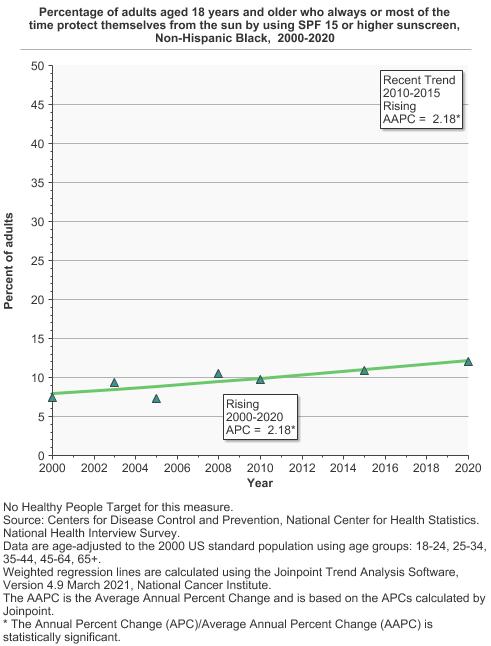
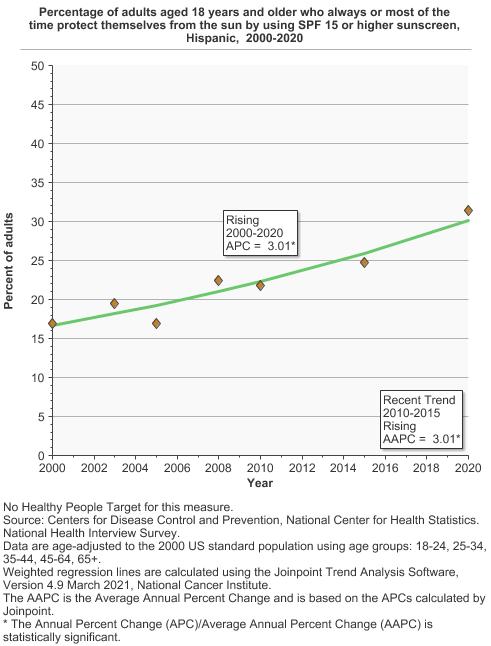
Percentage of adults aged 18 years and older who always or most of the time protect themselves from the sun by using SPF 15 or higher sunscreen by race/ethnicity, 2000-2020 Overview Graph Detailed Trend Graphs Most Recent Estimates (2020) Percent of adults 95% Confidence Interval 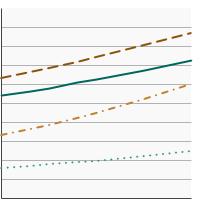
All Races
36.5 35.7 - 37.3 Non-Hispanic White
43.5 42.5 - 44.5 Non-Hispanic Black
12.0 10.5 - 13.8 Hispanic
31.4 29.4 - 33.6 - By Age
-
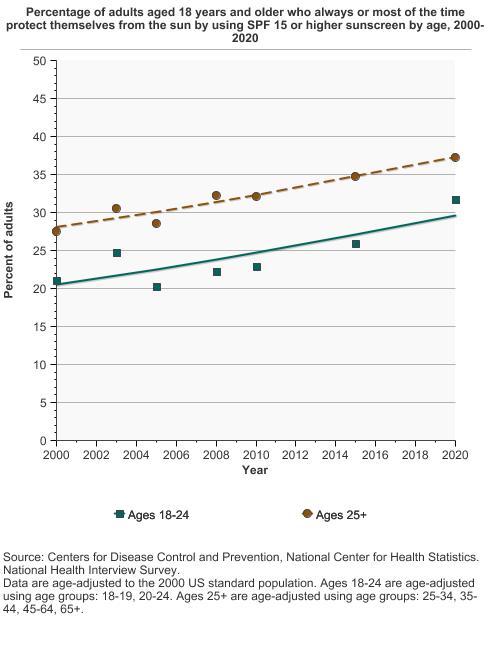
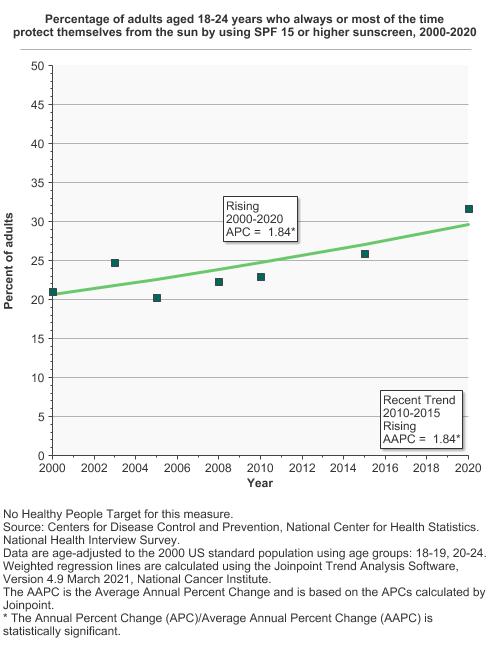
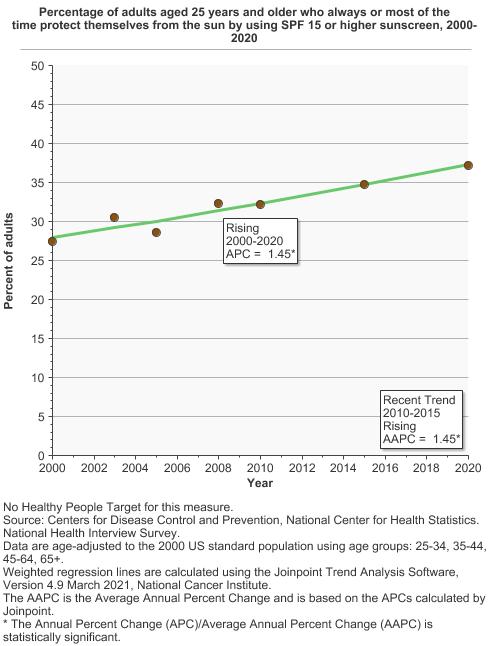
Percentage of adults aged 18 years and older who always or most of the time protect themselves from the sun by using SPF 15 or higher sunscreen by age, 2000-2020 Overview Graph Detailed Trend Graphs Most Recent Estimates (2020) Percent of adults 95% Confidence Interval 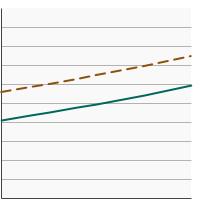
Ages 18-24
31.7 29.2 - 34.4 Ages 25+
37.2 36.3 - 38.0 - By Sex and Age
-
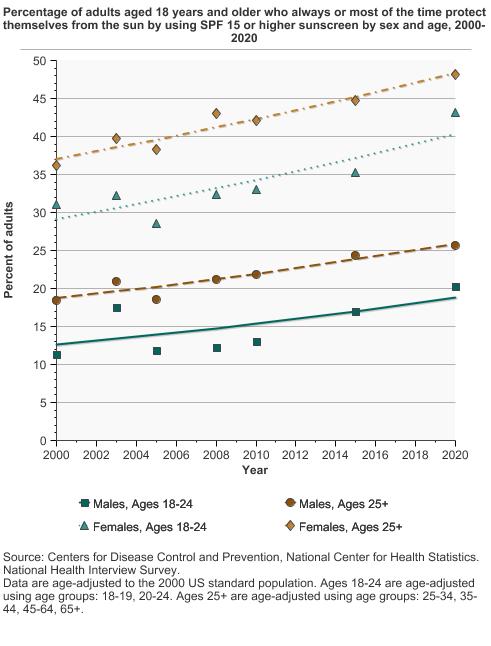
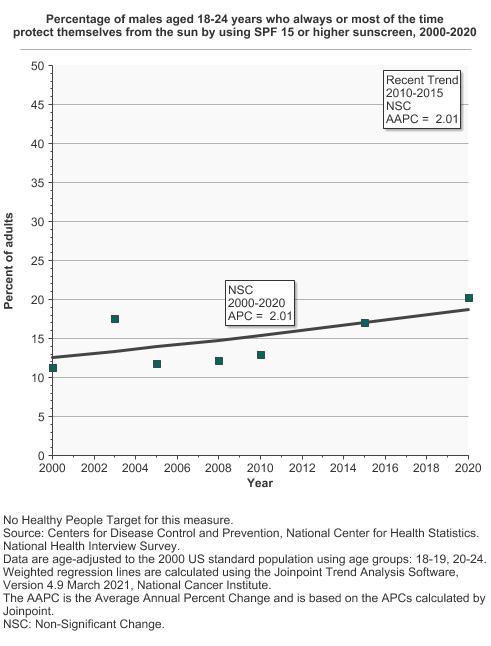
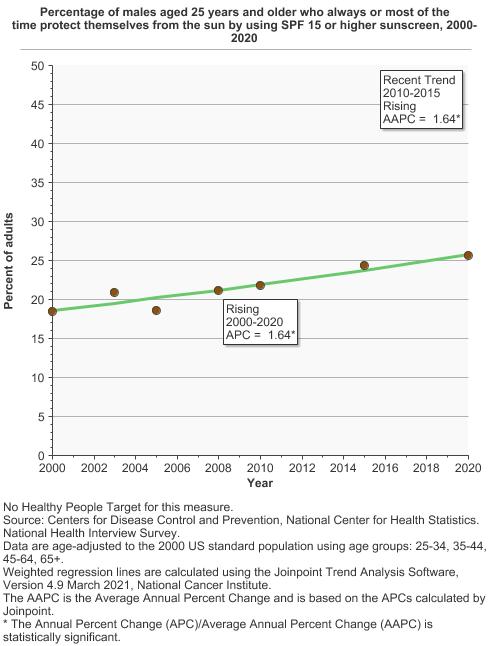
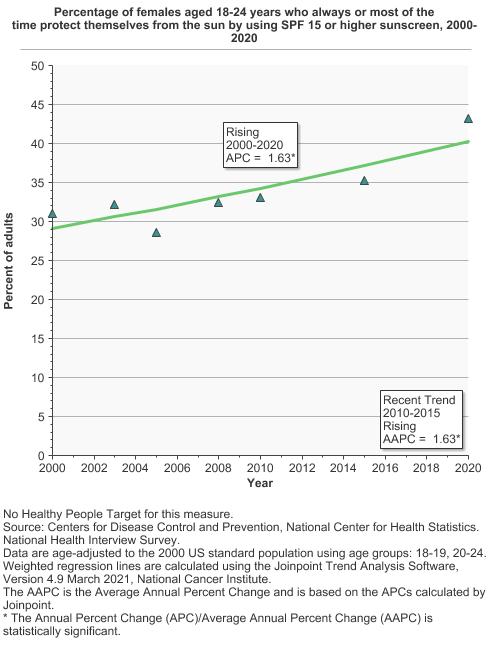
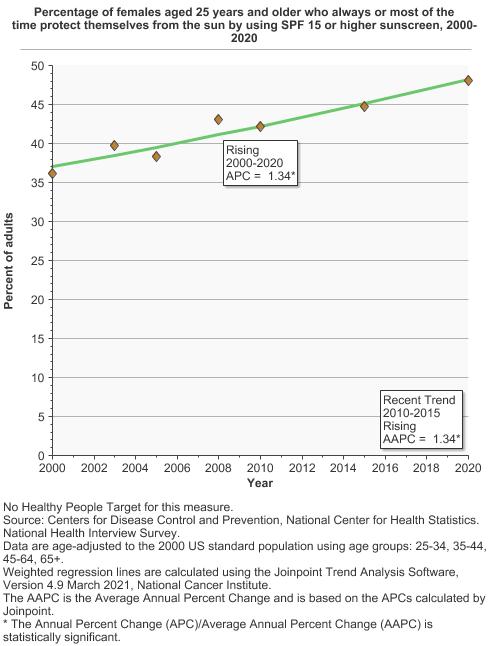
Percentage of adults aged 18 years and older who always or most of the time protect themselves from the sun by using SPF 15 or higher sunscreen by sex and age, 2000-2020 Overview Graph Detailed Trend Graphs Most Recent Estimates (2020) Percent of adults 95% Confidence Interval 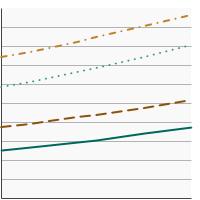
Males, Ages 18-24
20.2 17.4 - 23.4 Males, Ages 25+
25.7 24.8 - 26.7 Females, Ages 18-24
43.2 39.1 - 47.4 Females, Ages 25+
48.1 46.9 - 49.3 - By Poverty Income Level
-
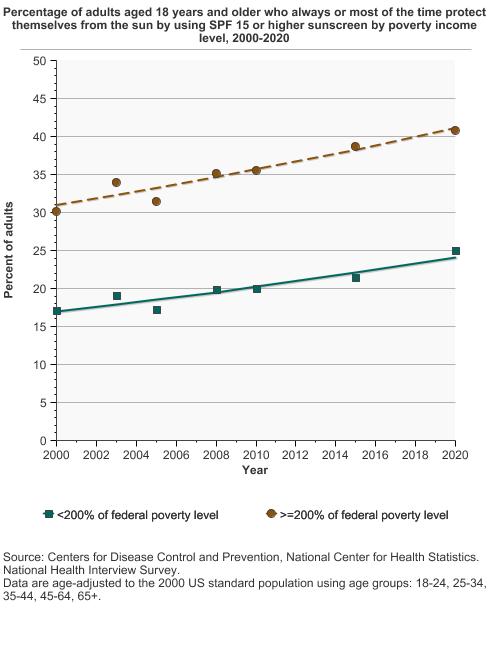
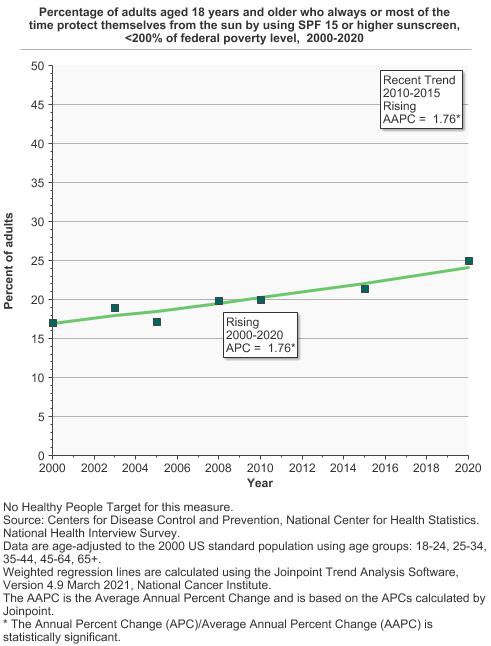
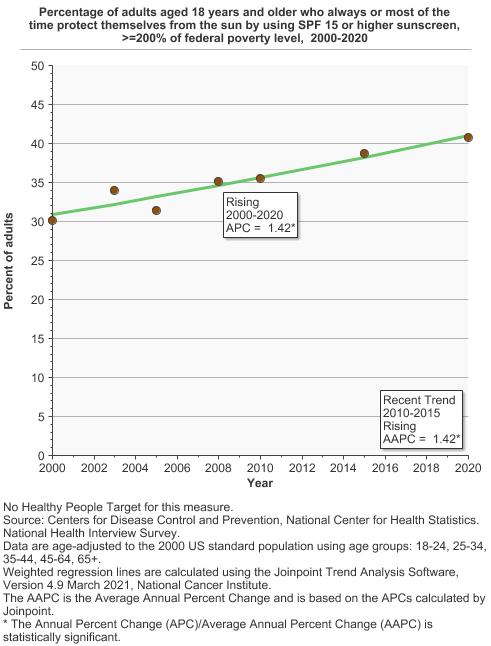
Percentage of adults aged 18 years and older who always or most of the time protect themselves from the sun by using SPF 15 or higher sunscreen by poverty income level, 2000-2020 Overview Graph Detailed Trend Graphs Most Recent Estimates (2020) Percent of adults 95% Confidence Interval 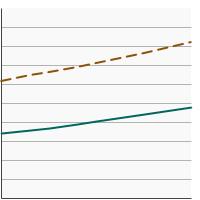
<200% of federal poverty level
25.0 23.5 - 26.5 >=200% of federal poverty level
40.7 39.8 - 41.7 - By Education Level
-
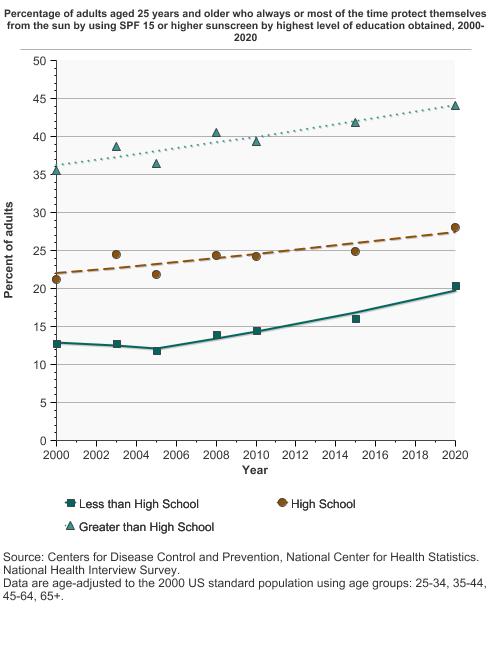
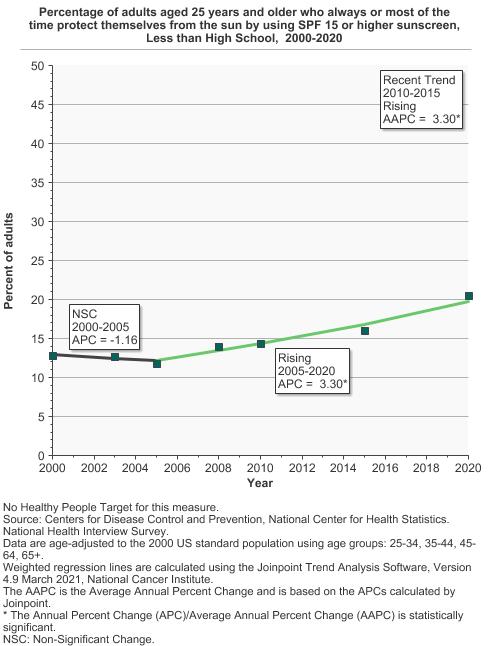
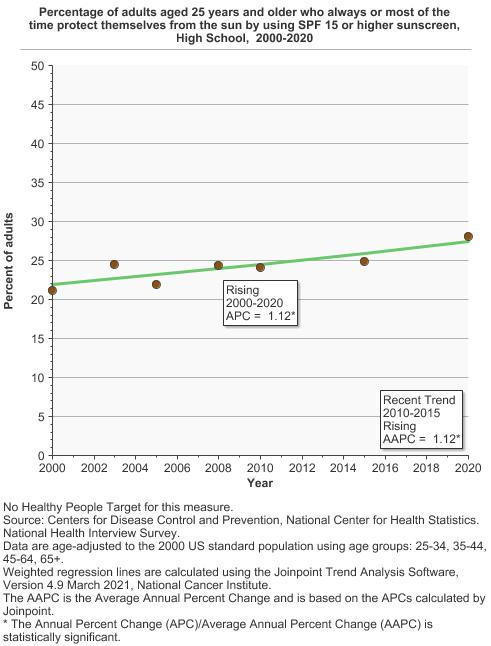
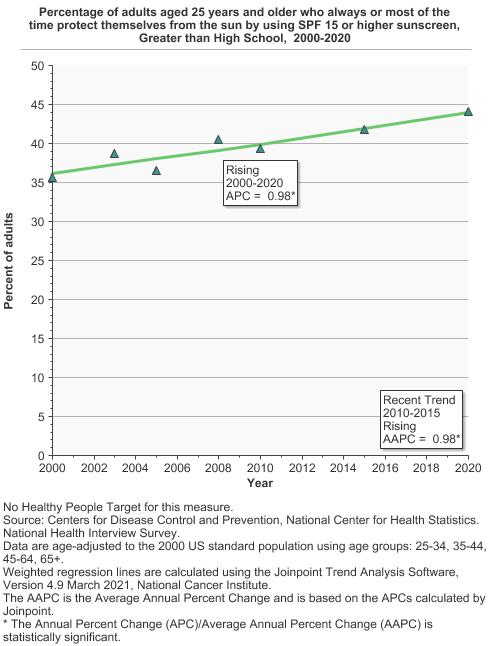
Percentage of adults aged 25 years and older who always or most of the time protect themselves from the sun by using SPF 15 or higher sunscreen by highest level of education obtained, 2000-2020 Overview Graph Detailed Trend Graphs Most Recent Estimates (2020) Percent of adults 95% Confidence Interval 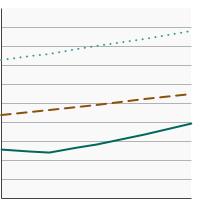
Less than High School
20.5 17.6 - 23.6 High School
28.0 26.6 - 29.5 Greater than High School
44.1 43.1 - 45.0 - By Sun Sensitivity
-
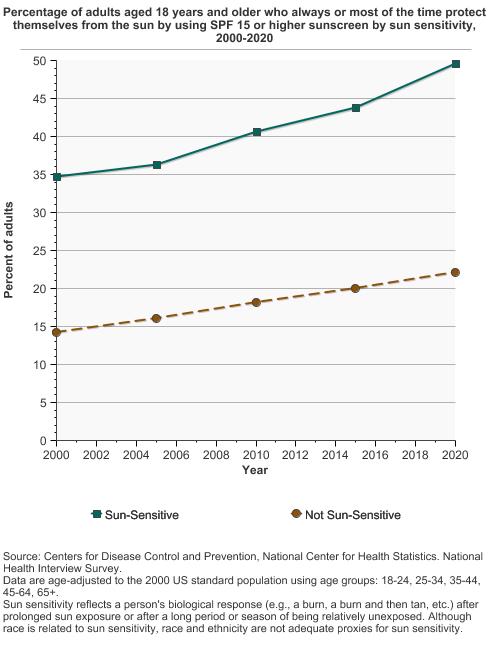
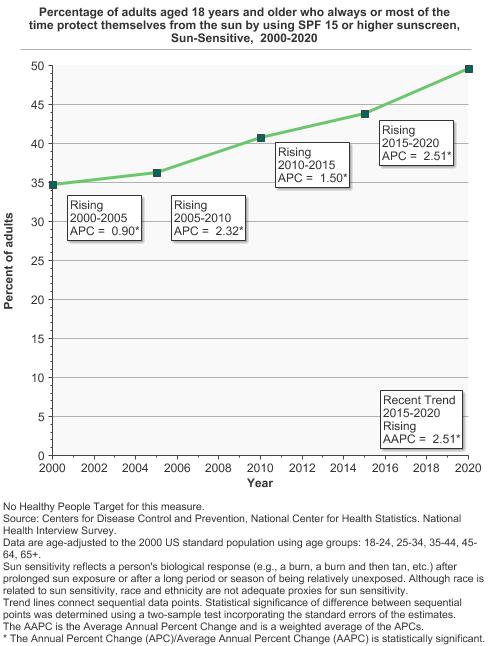
Percentage of adults aged 18 years and older who always or most of the time protect themselves from the sun by using SPF 15 or higher sunscreen by sun sensitivity, 2000-2020 Overview Graph Detailed Trend Graphs Most Recent Estimates (2020) Percent of adults 95% Confidence Interval 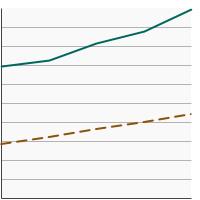
Sun-Sensitive
49.6 48.6 - 50.7 Not Sun-Sensitive
22.1 21.1 - 23.1 Sun sensitivity reflects a person's biological response (e.g., a burn, a burn and then tan, etc.) after prolonged sun exposure or after a long period or season of being relatively unexposed. Although race is related to sun sensitivity, race and ethnicity are not adequate proxies for sun sensitivity.
- Wear Protective Clothing
-
- By Sex
-
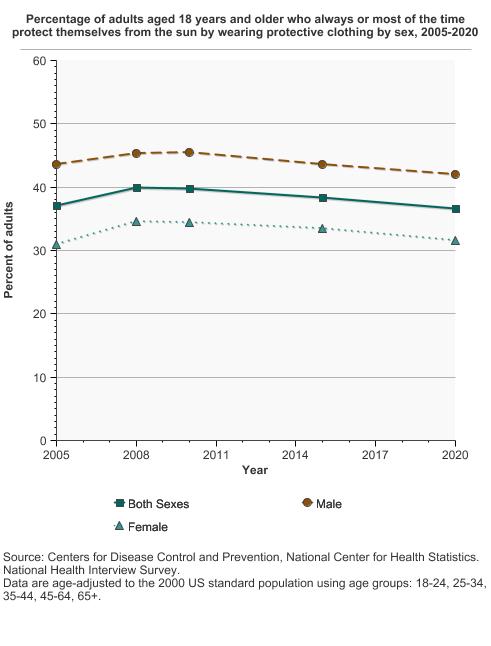
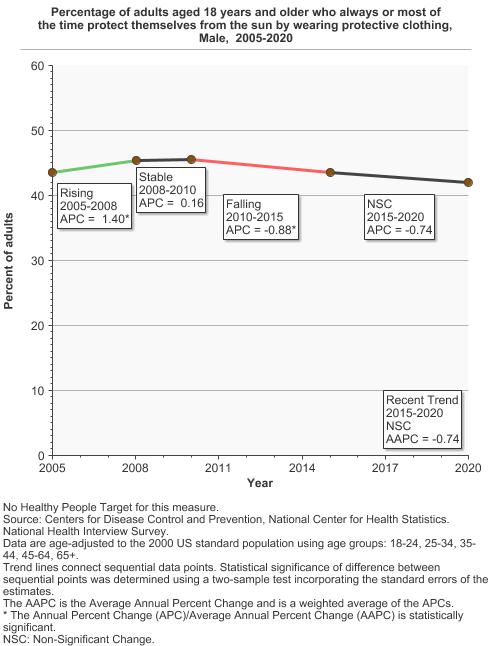
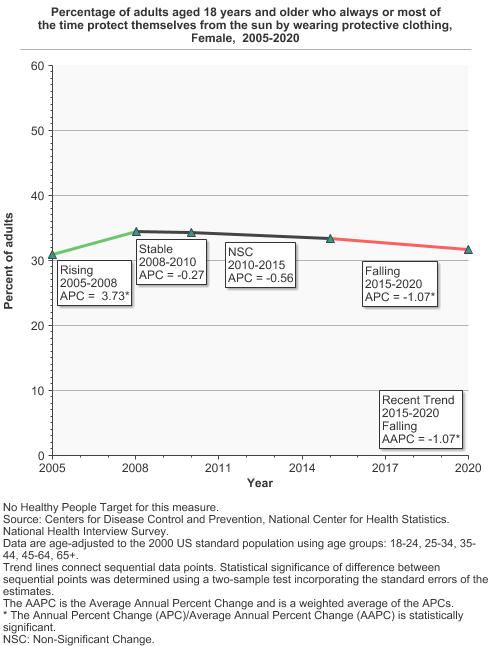
Percentage of adults aged 18 years and older who always or most of the time protect themselves from the sun by wearing protective clothing by sex, 2005-2020 Overview Graph Detailed Trend Graphs Most Recent Estimates (2020) Percent of adults 95% Confidence Interval 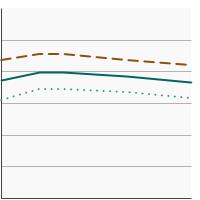
Both Sexes
36.7 35.8 - 37.6 Male
42.0 40.7 - 43.3 Female
31.6 30.6 - 32.7 - By Race/Ethnicity
-
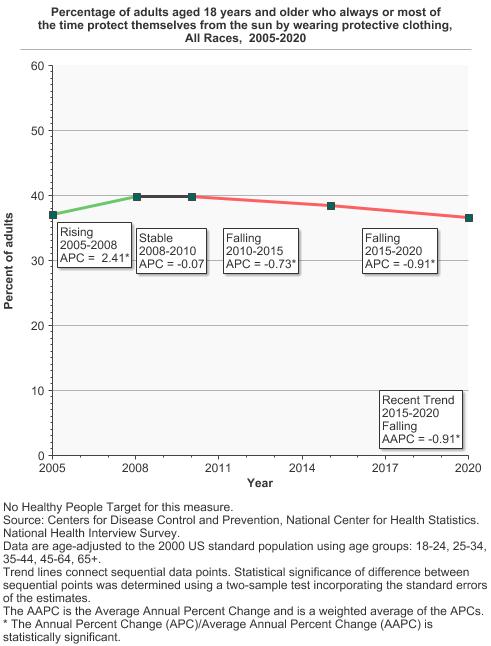
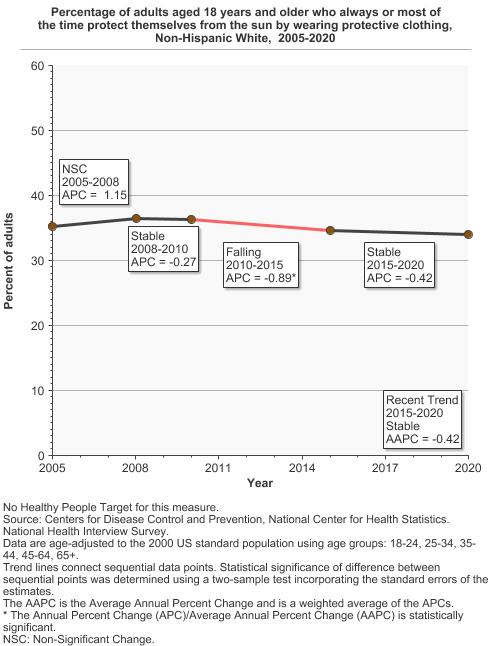
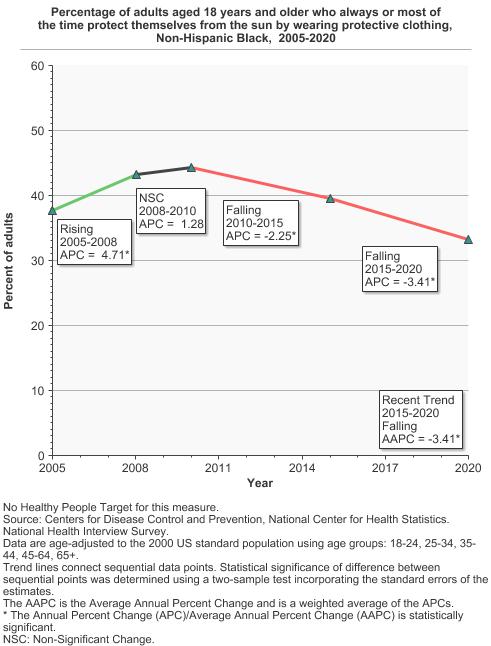
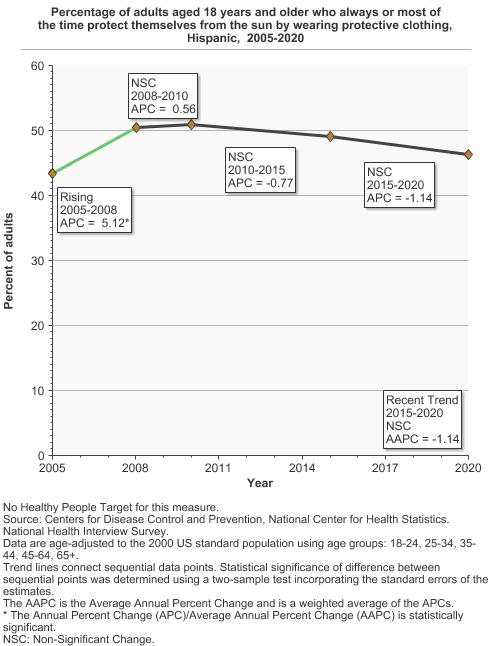
Percentage of adults aged 18 years and older who always or most of the time protect themselves from the sun by wearing protective clothing by race/ethnicity, 2005-2020 Overview Graph Detailed Trend Graphs Most Recent Estimates (2020) Percent of adults 95% Confidence Interval 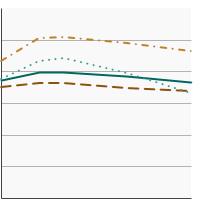
All Races
36.7 35.8 - 37.6 Non-Hispanic White
33.9 32.9 - 35.0 Non-Hispanic Black
33.3 31.1 - 35.5 Hispanic
46.3 44.0 - 48.5 - By Age
-
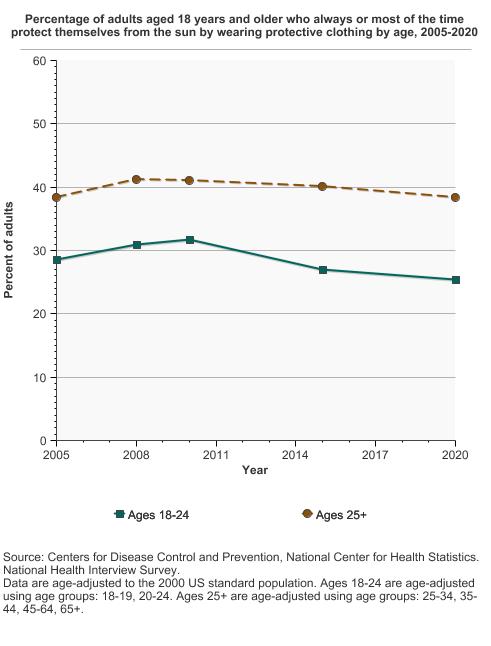
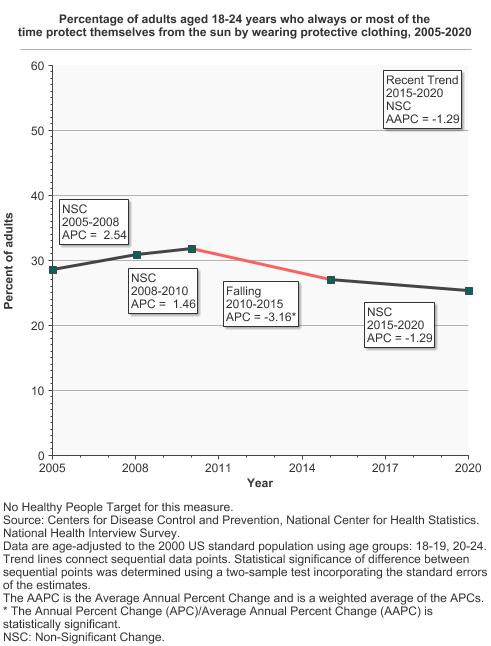
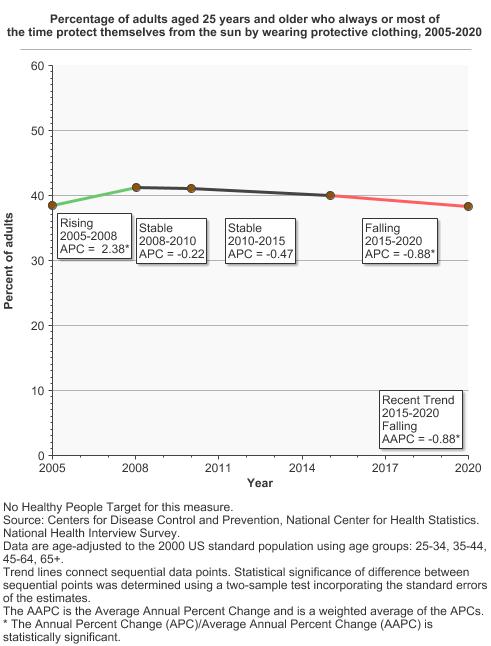
Percentage of adults aged 18 years and older who always or most of the time protect themselves from the sun by wearing protective clothing by age, 2005-2020 Overview Graph Detailed Trend Graphs Most Recent Estimates (2020) Percent of adults 95% Confidence Interval 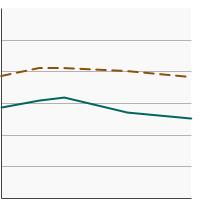
Ages 18-24
25.4 22.8 - 28.2 Ages 25+
38.3 37.4 - 39.3 - By Sex and Age
-
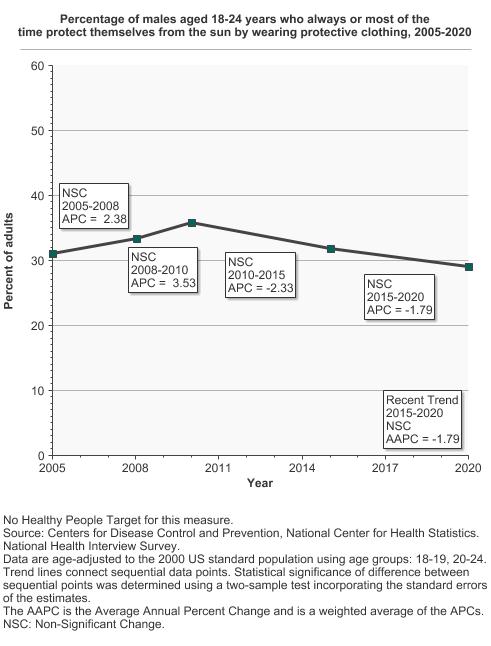
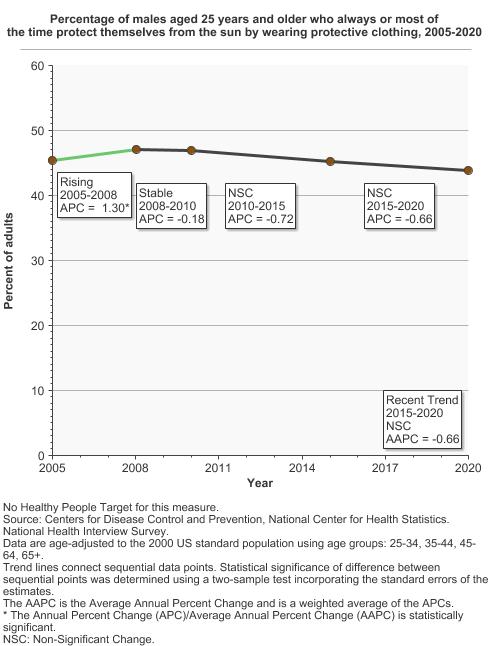
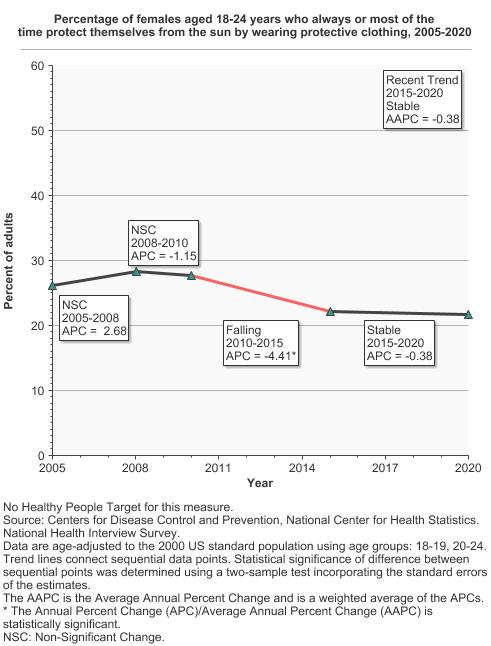
Percentage of adults aged 18 years and older who always or most of the time protect themselves from the sun by wearing protective clothing by sex and age, 2005-2020 Overview Graph Detailed Trend Graphs Most Recent Estimates (2020) Percent of adults 95% Confidence Interval 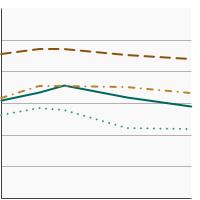
Males, Ages 18-24
29.1 25.3 - 33.1 Males, Ages 25+
43.8 42.5 - 45.1 Females, Ages 18-24
21.7 18.3 - 25.6 Females, Ages 25+
33.1 32.0 - 34.3 - By Poverty Income Level
-
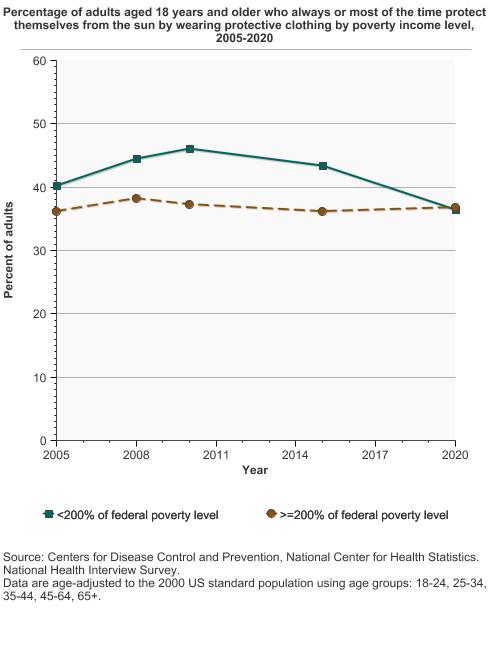
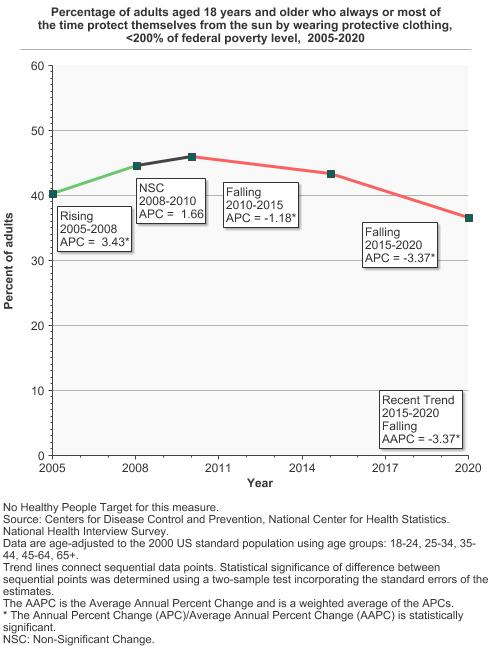
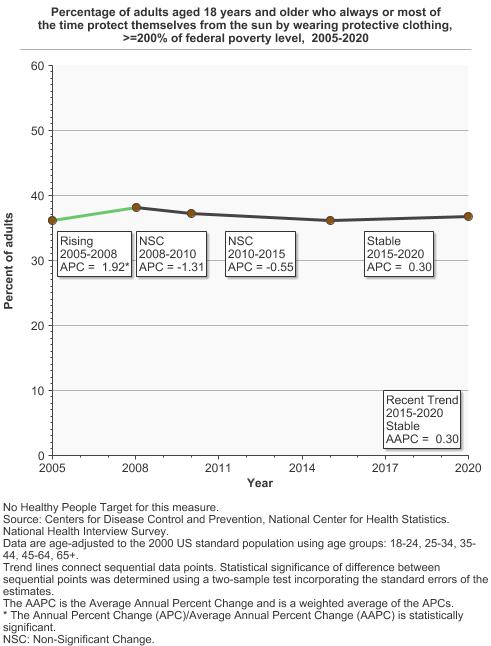
Percentage of adults aged 18 years and older who always or most of the time protect themselves from the sun by wearing protective clothing by poverty income level, 2005-2020 Overview Graph Detailed Trend Graphs Most Recent Estimates (2020) Percent of adults 95% Confidence Interval 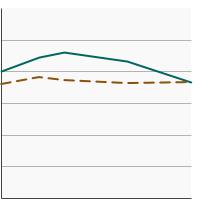
<200% of federal poverty level
36.5 35.1 - 38.1 >=200% of federal poverty level
36.7 35.7 - 37.8 - By Education Level
-
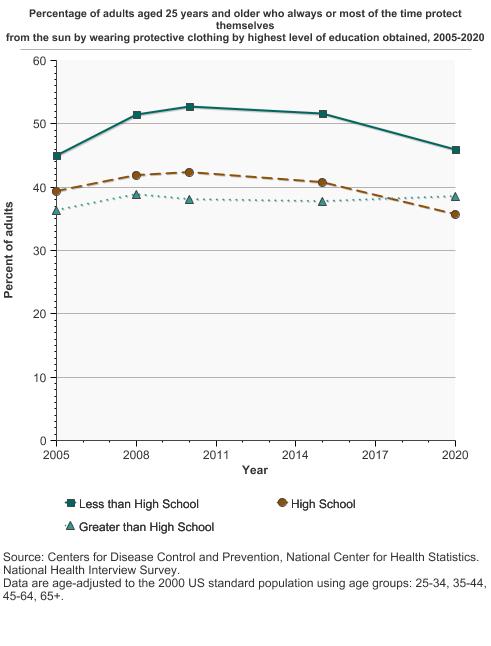
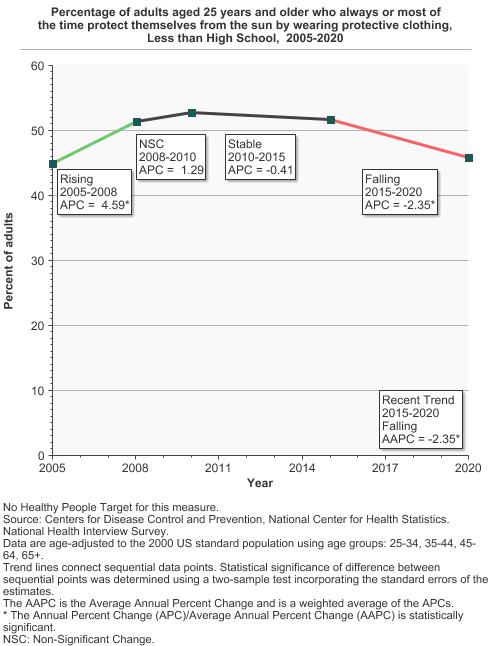
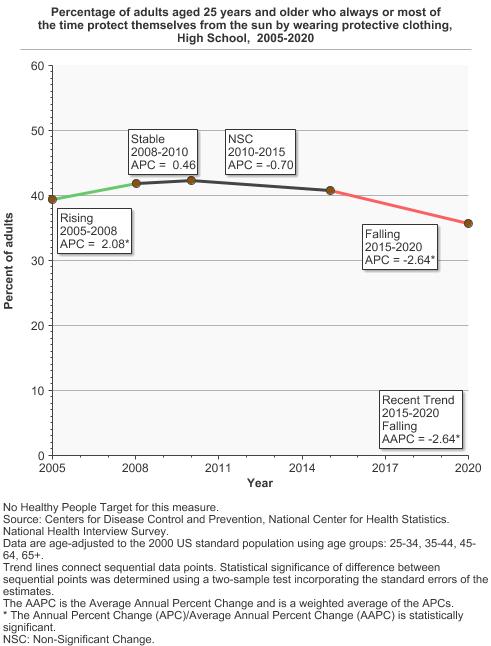
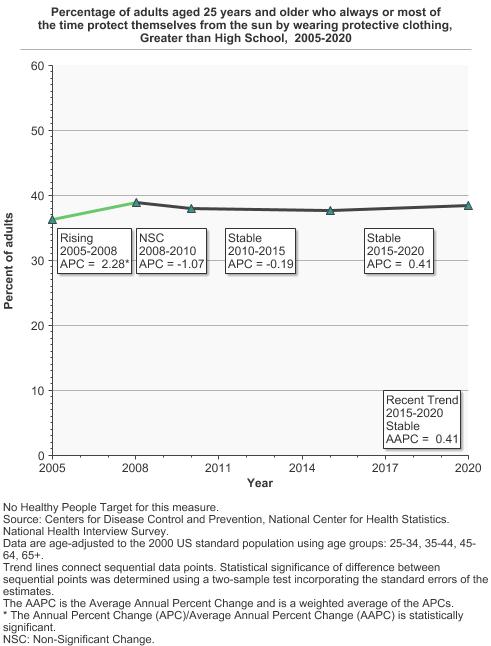
Percentage of adults aged 25 years and older who always or most of the time protect themselves from the sun by wearing protective clothing by highest level of education obtained, 2005-2020 Overview Graph Detailed Trend Graphs Most Recent Estimates (2020) Percent of adults 95% Confidence Interval 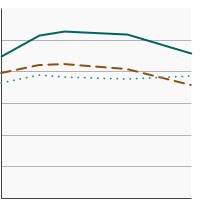
Less than High School
45.9 42.6 - 49.2 High School
35.7 34.0 - 37.4 Greater than High School
38.5 37.5 - 39.5 - By Sun Sensitivity
-
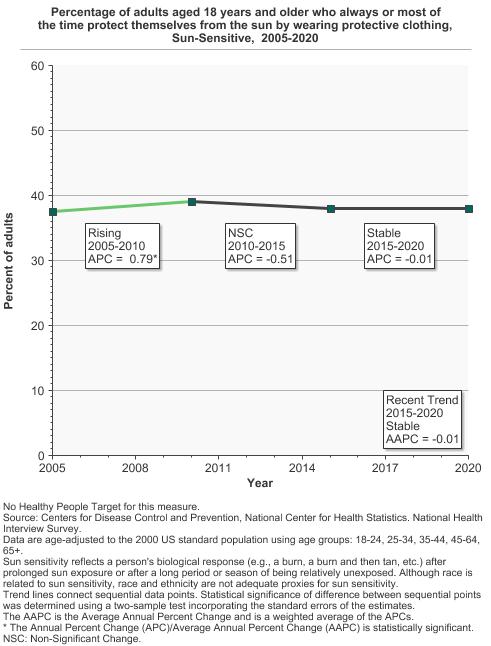
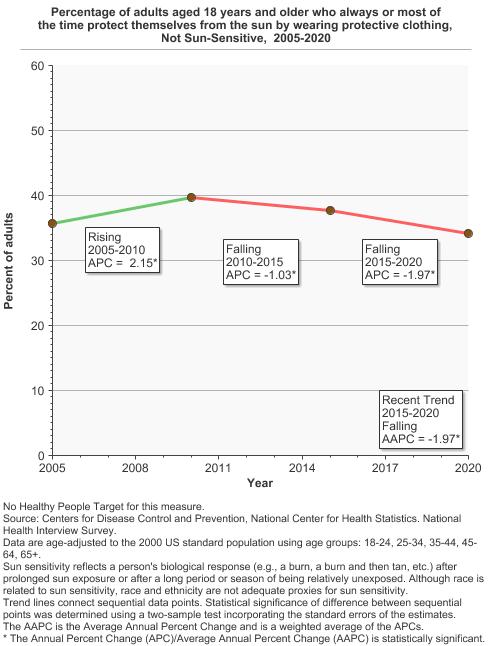
Percentage of adults aged 18 years and older who always or most of the time protect themselves from the sun by wearing protective clothing by sun sensitivity, 2005-2020 Overview Graph Detailed Trend Graphs Most Recent Estimates (2020) Percent of adults 95% Confidence Interval 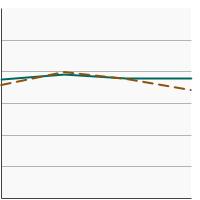
Sun-Sensitive
38.0 36.9 - 39.1 Not Sun-Sensitive
34.1 32.9 - 35.3 Sun sensitivity reflects a person's biological response (e.g., a burn, a burn and then tan, etc.) after prolonged sun exposure or after a long period or season of being relatively unexposed. Although race is related to sun sensitivity, race and ethnicity are not adequate proxies for sun sensitivity.
- Seek Shade
-
- By Sex
-
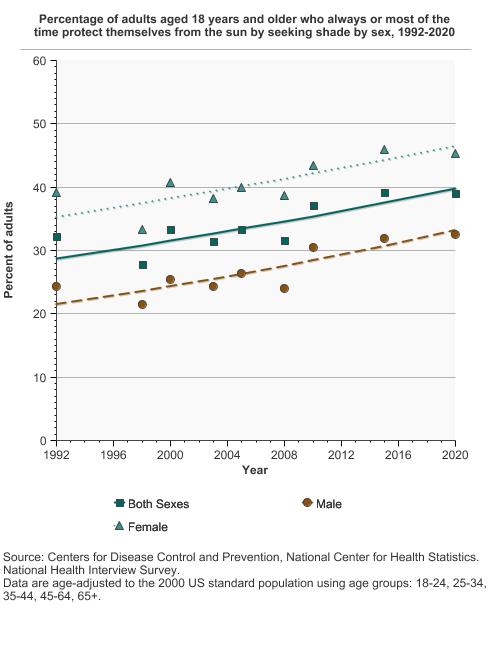
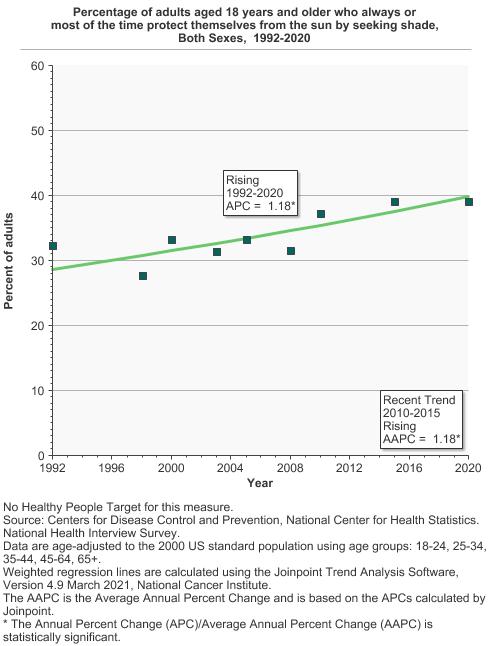
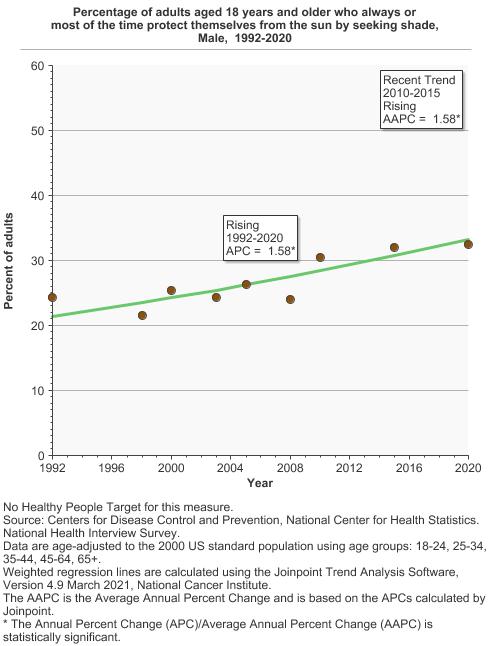
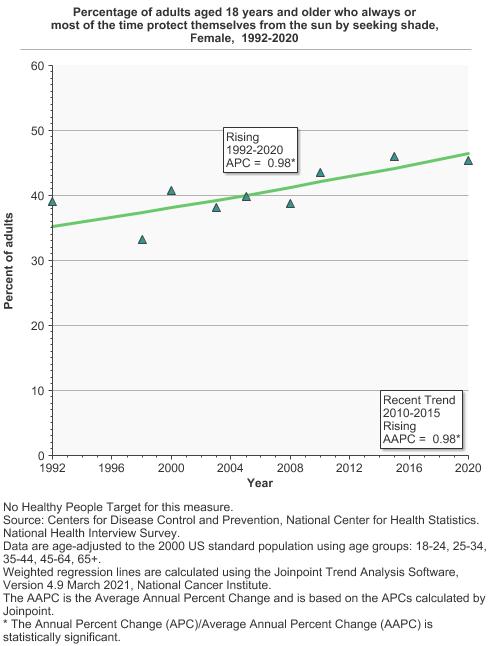
Percentage of adults aged 18 years and older who always or most of the time protect themselves from the sun by seeking shade by sex, 1992-2020 Overview Graph Detailed Trend Graphs Most Recent Estimates (2020) Percent of adults 95% Confidence Interval 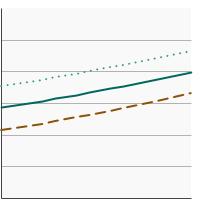
Both Sexes
39.1 38.1 - 40.0 Male
32.5 31.4 - 33.7 Female
45.3 44.1 - 46.6 - By Race/Ethnicity
-
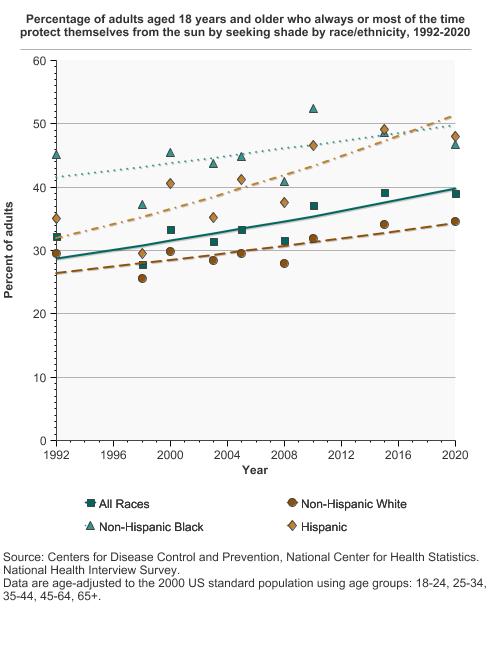
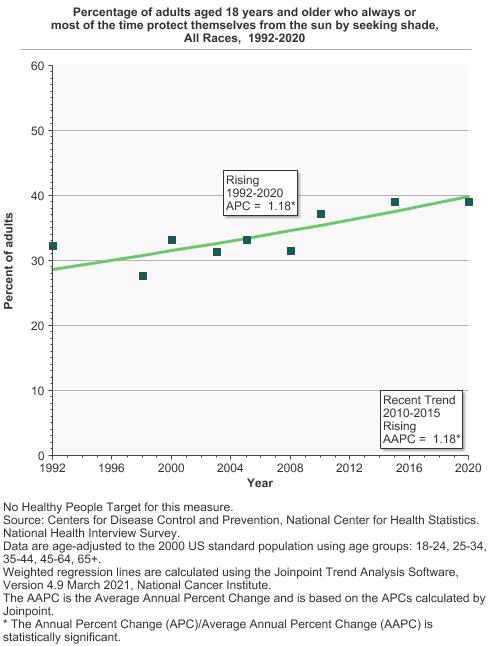
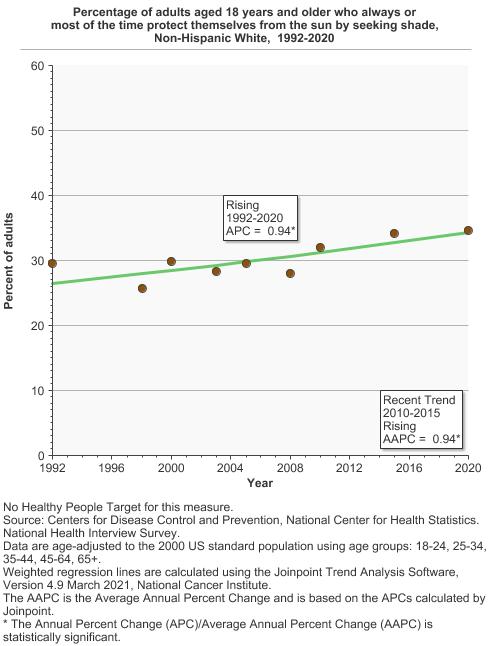
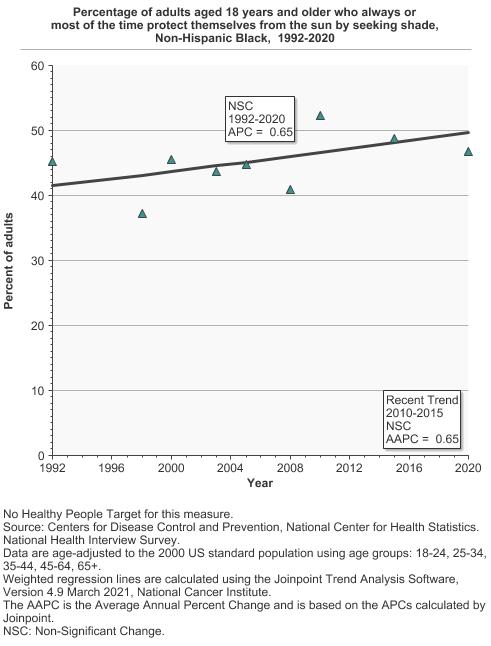
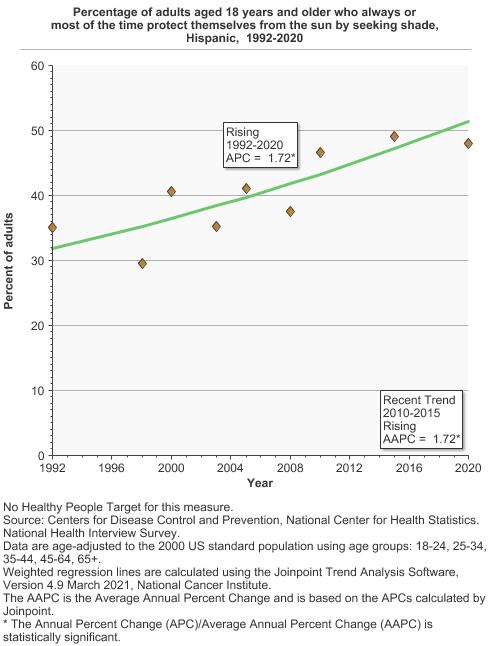
Percentage of adults aged 18 years and older who always or most of the time protect themselves from the sun by seeking shade by race/ethnicity, 1992-2020 Overview Graph Detailed Trend Graphs Most Recent Estimates (2020) Percent of adults 95% Confidence Interval 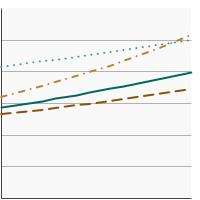
All Races
39.1 38.1 - 40.0 Non-Hispanic White
34.6 33.5 - 35.7 Non-Hispanic Black
46.7 44.0 - 49.4 Hispanic
47.9 45.9 - 50.0 - By Age
-
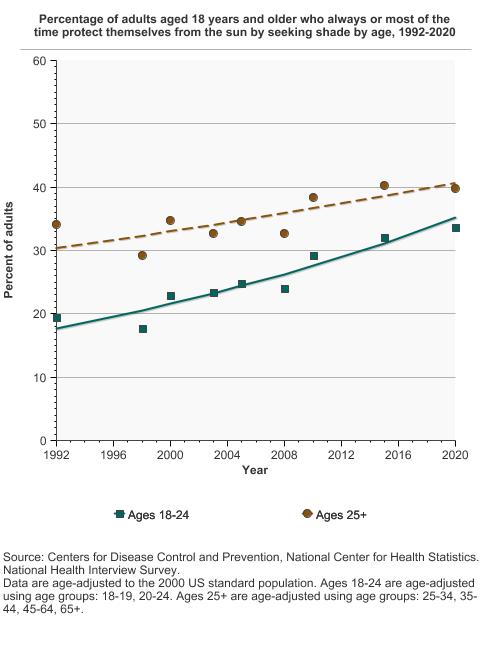
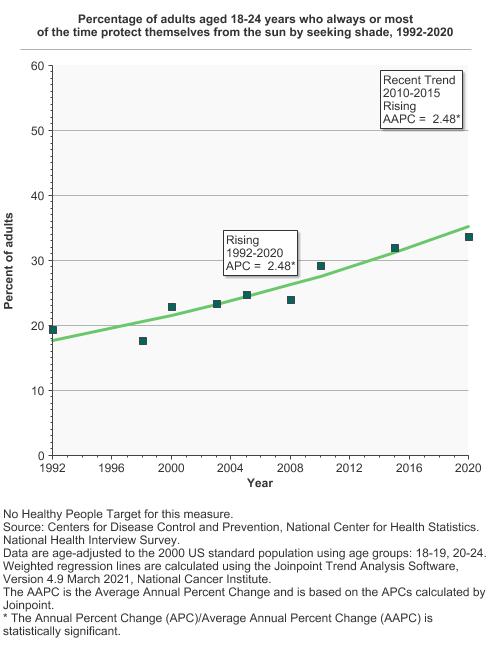
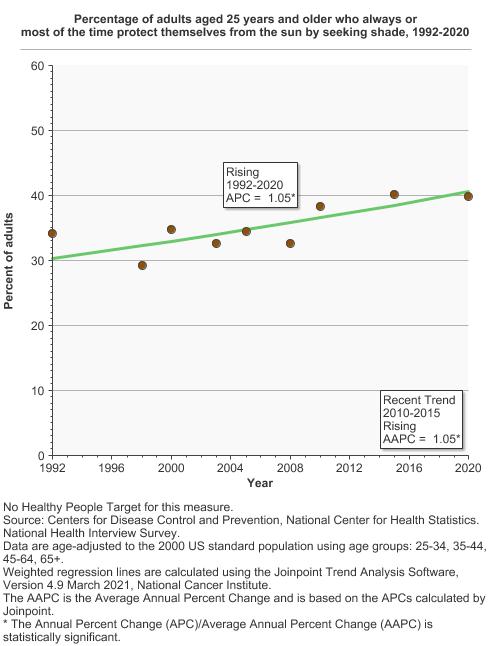
Percentage of adults aged 18 years and older who always or most of the time protect themselves from the sun by seeking shade by age, 1992-2020 Overview Graph Detailed Trend Graphs Most Recent Estimates (2020) Percent of adults 95% Confidence Interval 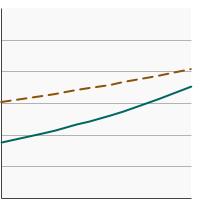
Ages 18-24
33.7 30.8 - 36.8 Ages 25+
39.8 38.9 - 40.8 - By Sex and Age
-
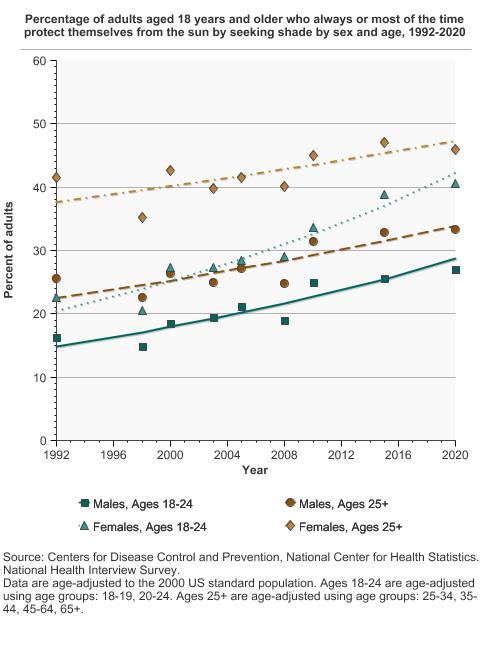
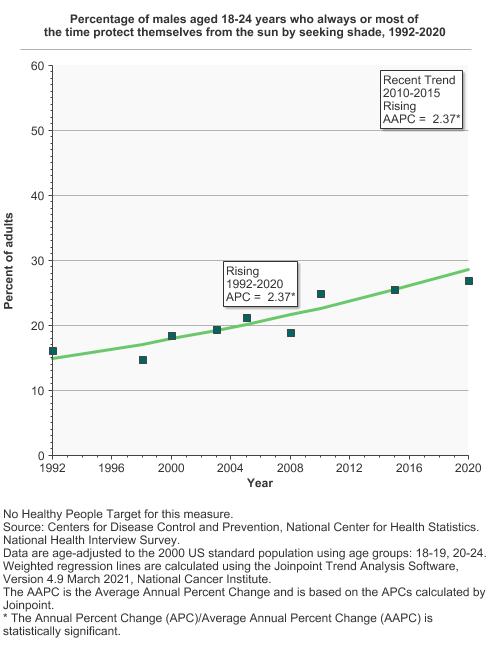
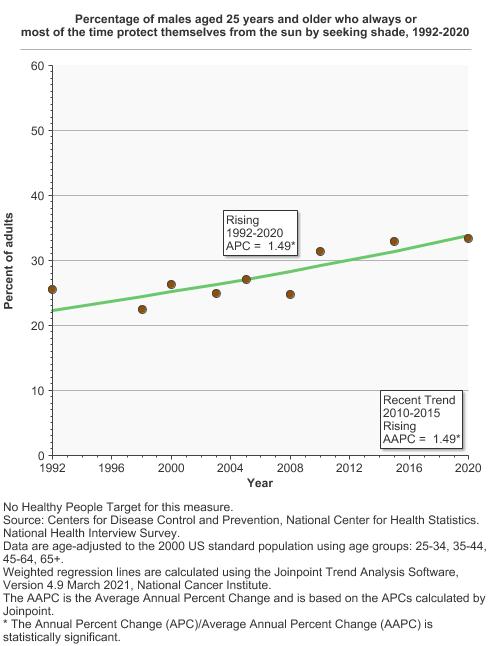
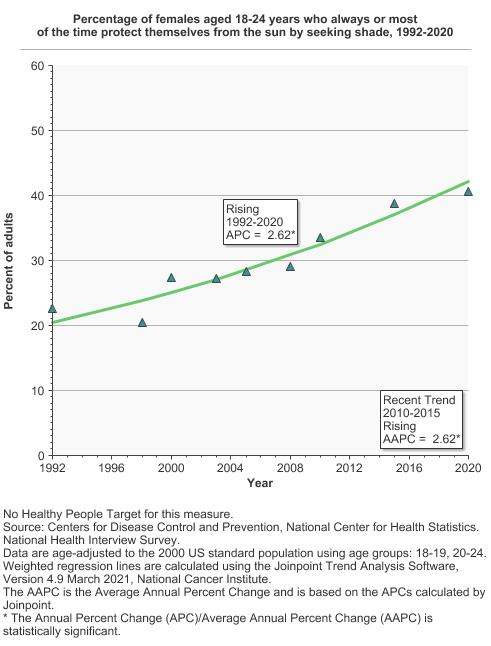
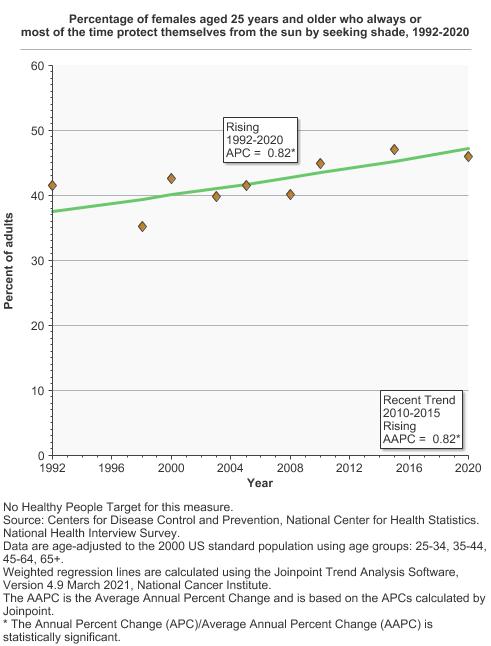
Percentage of adults aged 18 years and older who always or most of the time protect themselves from the sun by seeking shade by sex and age, 1992-2020 Overview Graph Detailed Trend Graphs Most Recent Estimates (2020) Percent of adults 95% Confidence Interval 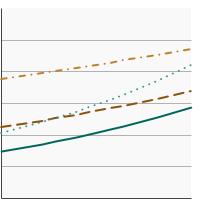
Males, Ages 18-24
27.0 23.1 - 31.3 Males, Ages 25+
33.3 32.1 - 34.5 Females, Ages 18-24
40.6 36.5 - 44.8 Females, Ages 25+
46.0 44.7 - 47.2 - By Poverty Income Level
-
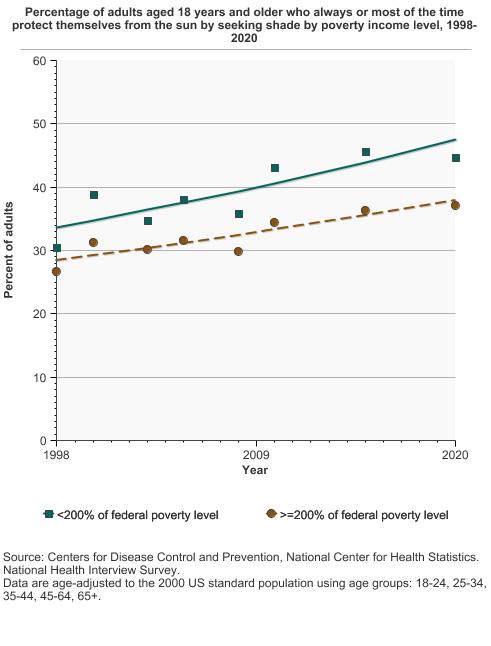
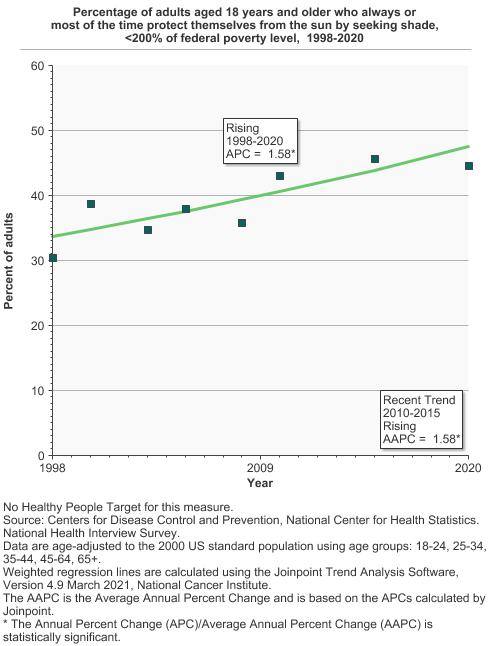
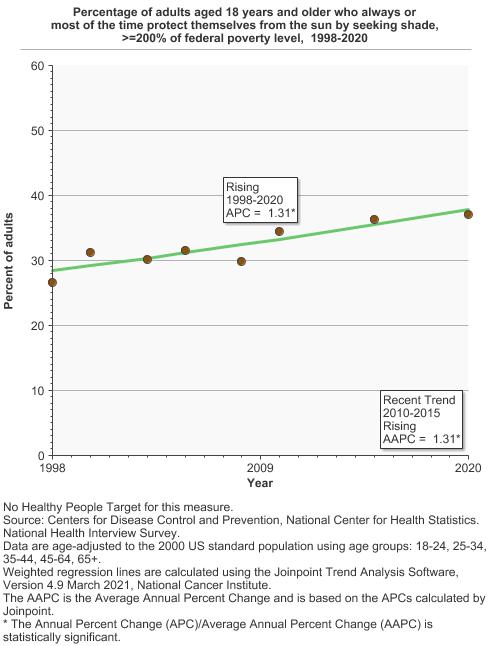
Percentage of adults aged 18 years and older who always or most of the time protect themselves from the sun by seeking shade by poverty income level, 1998-2020 Overview Graph Detailed Trend Graphs Most Recent Estimates (2020) Percent of adults 95% Confidence Interval 
<200% of federal poverty level
44.6 42.9 - 46.4 >=200% of federal poverty level
37.1 36.0 - 38.1 - By Education Level
-
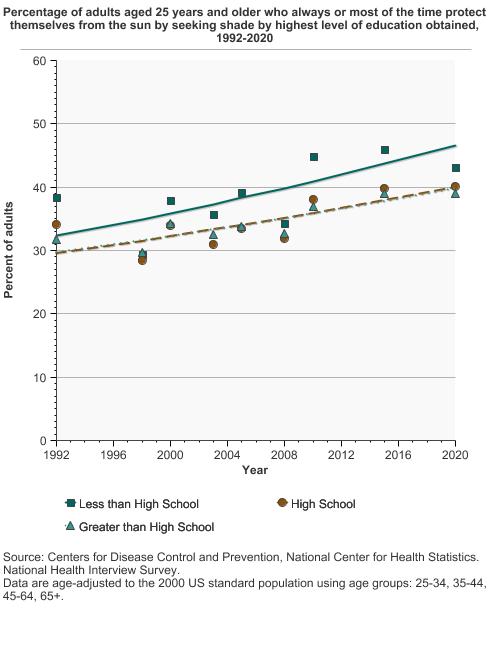
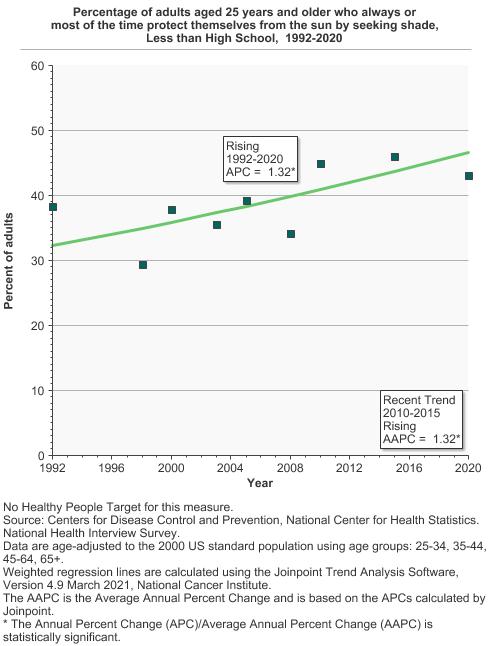
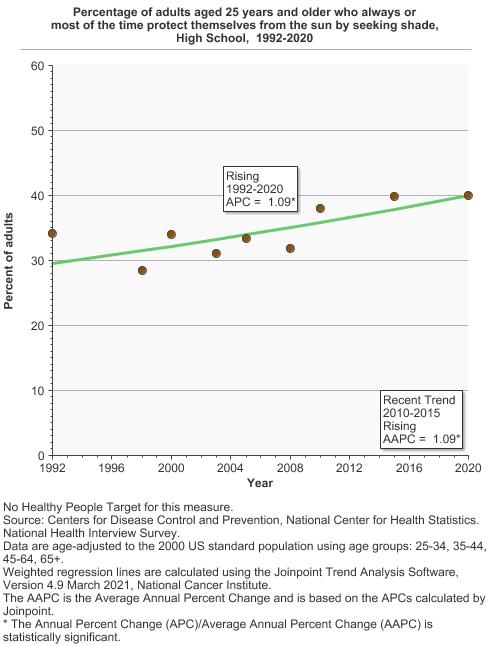
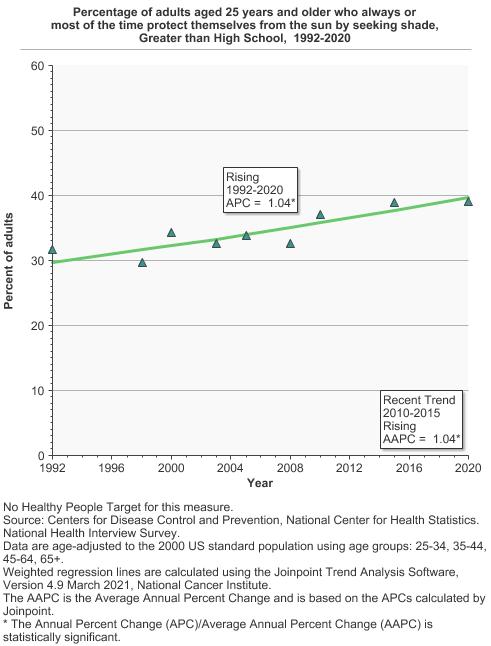
Percentage of adults aged 25 years and older who always or most of the time protect themselves from the sun by seeking shade by highest level of education obtained, 1992-2020 Overview Graph Detailed Trend Graphs Most Recent Estimates (2020) Percent of adults 95% Confidence Interval 
Less than High School
43.1 40.0 - 46.4 High School
40.0 38.4 - 41.7 Greater than High School
39.0 38.0 - 40.0 - By Sun Sensitivity
-
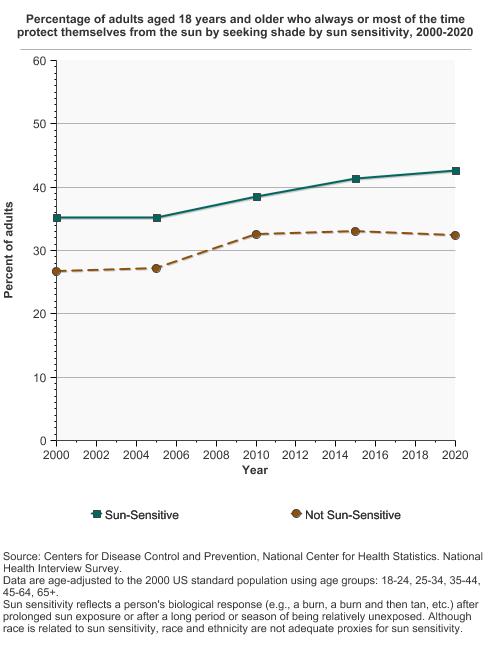
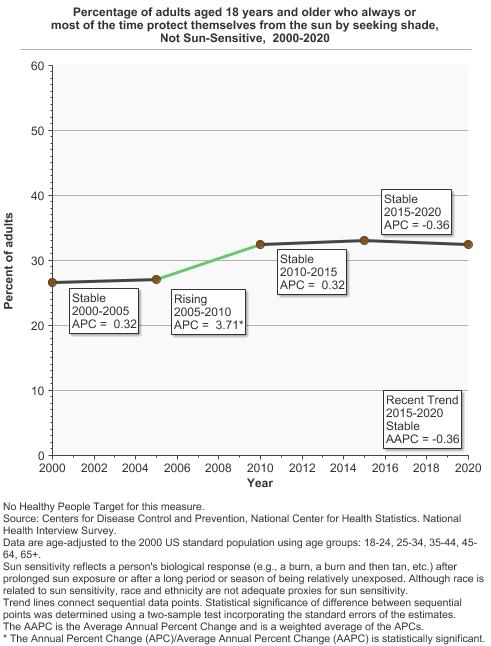
Percentage of adults aged 18 years and older who always or most of the time protect themselves from the sun by seeking shade by sun sensitivity, 2000-2020 Overview Graph Detailed Trend Graphs Most Recent Estimates (2020) Percent of adults 95% Confidence Interval 
Sun-Sensitive
42.6 41.4 - 43.9 Not Sun-Sensitive
32.4 31.2 - 33.7 Sun sensitivity reflects a person's biological response (e.g., a burn, a burn and then tan, etc.) after prolonged sun exposure or after a long period or season of being relatively unexposed. Although race is related to sun sensitivity, race and ethnicity are not adequate proxies for sun sensitivity.

Additional Information
- Skin Cancer. National Cancer Institute.
- Skin Cancer. American Cancer Society.
- Skin Cancer. Centers for Disease Control and Prevention.
- Skin Cancer. National Council on Skin Cancer Prevention.
- FDA Proposes Sunscreen Regulation Changes. U.S. Food and Drug Administration.
- Sun protection factor (SPF). U.S. Food and Drug Administration.
- Sunscreen: How to Help Protect Your Skin from the Sun. U.S. Food and Drug Administration.
- Sun Safety. U.S. Environmental Protection Agency.
- Melanoma Treatment (PDQ®) - Health Professional Version. National Cancer Institute.
- Skin Cancer Treatment (PDQ®) - Health Professional Version. National Cancer Institute.
- Sun Safety Evidence-Based Programs Listing. National Cancer Institute.
- Vitamin D and Calcium: A Systematic Review of Health Outcomes (Update). AHRQ Publication No. 14-E004-EF September 2014. Evidence Report/Technology Assessment Number 217.
- Surgeon General's Call to Action to Prevent Skin Cancer. Centers for Disease Control and Prevention.
- Skin cancer: multicomponent community-wide interventions. Community Preventive Services Task Force.
- Stratosphere: UV index. National Weather Service: Climate Prediction Center.
- Code of Federal Regulations Title 21, Volume 76, Number 117, Part 352: Sunscreen Drug Products for Over-the-Counter Human Use (April 2019). U.S. Food and Drug Administration.
- Code of Federal Regulations Title 21, Volume 76, Number 117, Part 201: Labeling (July 2018). U.S. Food and Drug Administration.
- FDA proposed rule: sunscreen drug products for over-the-counter-human use; proposal to amend and lift stay on monograph. U.S. Food and Drug Administration.
- Skin Cancer Prevention: Behavioral counseling. U.S. Preventive Services Task Force.
- Association of occupational sun safety policy and actions in state transportation sector in the United States. Buller DB, Walkosz BJ, Olivas S, et al. Am J Ind Med. 2021 Apr;64(4):274-282.
- Interdisciplinary perspectives on sun safety. Geller AC, Jablonski NG, Pagoto SL, et al. JAMA Dermatol. 2018;154(1):88-92.
- Reduced melanoma after regular sunscreen use: randomized trial follow-up. Green A, Williams GM, Logan V, and Strutton GM. J Clin Oncol. 2011;29(3):257–263.
- Estimated cost of sunburn-associated visits to US hospital emergency departments. Guy GP, Berkowitz Z, and Watson M. JAMA Dermatol. 2017;153(1):90-92.
- Trends in indoor tanning and its association with sunburn among US adults. Guy GP, Watson M, Seidenberg AB et al. J Am Acad Dermatol. 2017;76(6):1191-1193.
- The potential impact of reducing indoor tanning on melanoma prevention and treatment costs in the United States: an economic analysis. Guy GP, Zhang Y, Ekwueme DU, et al. J Am Acad Dermatol. 2017;76(2):226-233.
- Prevalence of sun protection use and sunburn and association of demographic and behavioral characteristics with sunburn among US adults. Holman DM, Ding H, Guy GP et al. JAMA Dermatol. 2018; 154(5):561-568.
- Health Beliefs About UV and Skin Cancer Risk Behaviors. Cancer Control. Julian A, Thorburn S, Geldhof GJ. 2020 Jan-Dec;27(4):1073274819894008.
- Benefit–Cost Analysis of the Danish Sun Safety Campaign 2007–2015: Cost Savings from Sunburn and Sunbed Use Reduction and Derived Skin Cancer Reductions 2007–2040 in the Danish Population. Køster B, Meyer MKH, Søgaard J, Dalum P. Pharmacoecon Open. 2020 Sep;4(3):419-425.
- Prevalence and predictors of total-body skin examination among US adults: 2005 National Health Interview Survey. Lakhani NA, Shaw KM, Thompson T, et al. J Am Acad Dermatol. 2011: 65(3): 645-648.
- Prevalence and correlates of skin self-examination practices among cutaneous malignant melanoma survivors. Manne SL, Heckman CJ, Kashy D, et al. Prev Med Rep. 2020 May 1;19:101110.
- Effect of Sunscreen Application Under Maximal Use Conditions on Plasma Concentration of Sunscreen Active Ingredients: A Randomized Clinical Trial. Matta MK, Zusterzeel R, Pilli NR, et al. JAMA. 2019;321(21):2082-2091.
- Decision tree model v traditional measures to identify patterns of sun-protective behaviors and sun sensitivity associated with sunburn. Morris KL and Perna FM. JAMA Dermatol. 2018;154(8):897-902.
- Environmental effects of stratospheric ozone depletion, UV radiation, and interactions with climate change: UNEP Environmental Effects Assessment Panel, Update 2020. Neale RE, Barnes PW, Robson TM, et al. Photochem Photobiol Sci. 2021 Jan;20(1):1-67.
- The effect of sunscreen on vitamin D: a review. Neale RE, Khan SR, Lucas RM, et al. Br J Dermatol. 2019 Nov;181(5):907-915.
- Remote skin self-examination training of melanoma survivors and their skin check partners: A randomized trial and comparison with in-person training. Robinson JK, Reavy R, Mallett KA, Turrisi R. Cancer Med. 2020 Oct;9(19):7301-7309.
- Melanoma Skin Self-Examination Education During Mammography: Health Burden of Women Impairs Implementation. Robinson JK, Brown Z, Spring B. J Cancer Educ. 2020 Feb 24:10.1007/s13187-020-01714-4.
- Community-wide interventions to prevent skin cancer: two community guide systematic reviews. Sandhu PK, Elder R, Patel M, et al. Am J Prev Med. 2016;51(4):531-9.
- Implementation of the SunSmart program and population sun protection behaviour in Melbourne, Australia: Results from cross-sectional summer surveys from 1987 to 2017. Tabbakh T, Volkov A, Wakefield M, Dobbinson S. PLoS Med. 2019;16(10):e1002932.
- Walking and Sun Protective Behaviors: Cross-Sectional Associations of Beneficial Health Factors. Tribby CP, Perna FM, Berrigan D. Int J Environ Res Public Health. 2019 Jul 3;16(13):2361.
- SEER Cancer Statistics Review, National Cancer Institute.
- National Health Interview Survey. Centers for Disease Control and Prevention, National Center for Health Statistics.