On This Page:

Background
The national cancer-attributed medical care costs in the United States are substantial and projected to increase due to population changes alone, according to the Medical Care Costs Associated with Cancer Survivorship in the United States article, published in the journal Cancer Epidemiology, Biomarkers & Prevention (1). National costs for cancer care were estimated to be $190.2 billion in 2015. Assuming constant future costs, we project costs to be $208.9 billion in 2020 (2020 U.S. dollars), an increase of 10 percent that is only due to the aging and growth of the U.S. population. These cost estimates include cancer-attributable costs for medical services and oral prescription drugs. National medical services costs were largest for those diagnosed with female breast, colorectal, lung, and prostate cancers and non-Hodgkin lymphomas. National oral prescription drug costs were highest for those diagnosed with female breast, leukemia, lung, and prostate cancers. The differences in national costs reflect prevalence of the disease, treatment patterns, and costs for different types of care for the different cancer sites.
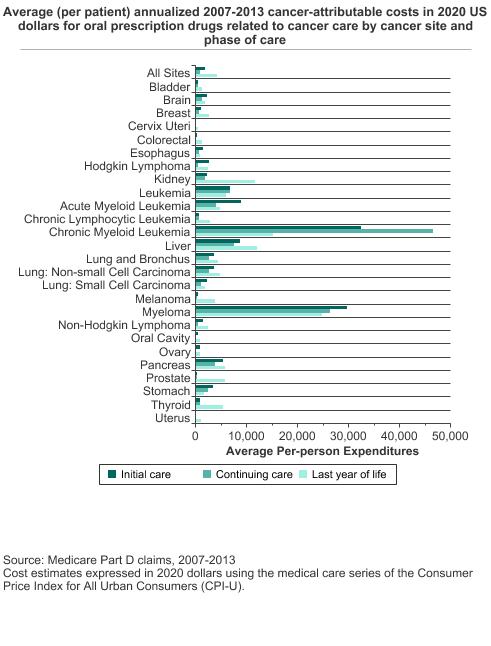
If cancer diagnosis and treatment is divided into phases of care: initial (first year after diagnosis), end-of-life (year before cancer death) and continuing (the time in between), per-patient annualized average costs were highest in the last year of life, followed by the initial and continuing phases (medical services: $109,727, $43,516, and $5,518, and oral prescription drugs: $4,372, $1,874, $1,041, respectively). There was considerable variation in costs by cancer site. Annualized average oral drug costs were highest for chronic myeloid leukemia (CML) and myeloma in all phases of care. Annualized average costs also varied by stage in all phases of care [data is not shown here but is available in Mariotto, et al. (1)].
Measure
- The estimates in this report come from Mariotto, et al. (1) and are an extension and update of previous estimates (2). All cost estimates have been adjusted and are reported in 2020 U.S. dollars.
- Per-patient annualized average cancer-attributable costs were estimated, respectively, from 2007-2013 Medicare claims by subtracting costs between patients with cancer and their matched controls without cancer. Annualized average medical costs were estimated by phases of care: initial (first year after diagnosis), end-of-life (year before cancer death) and continuing (the time in between).
- Medical services care costs were estimated from Medicare Parts A and B claims and include both Medicare payments and patient responsibilities for all billed medical services, including hospitalizations, outpatient hospital services, physician/supplier services, infusion or injectable drugs, durable medical equipment, hospice care, and home health care.
- Oral prescription drug costs were estimated from Medicare Part D claims.
- National expenditures or national cancer-attributed costs were estimated by combining U.S. cancer prevalence estimates and projections from the Anticipating the “Silver Tsunami”: Prevalence Trajectories and Comorbidity Burden among Older Cancer Survivors in the United States article, published in the journal Cancer Epidemiology, Biomarkers & Prevention (3) with the annualized average cost estimates, using previously described methods (1).
Data Source
- Mariotto AB, Enewold L, Zhao JX, Zeruto CA, Yabroff KR. Medical Care Costs Associated with Cancer Survivorship in the United States. Cancer Epidemiol Biomarkers Prev. 2020;29(7):1304-12.
- Mariotto AB, Yabroff KR, Shao Y, Feuer EJ, Brown ML. Projections of the cost of cancer care in the United States: 2010-2020. J Natl Cancer Inst. 2011;103(2):117-28.
- Bluethmann SM, Mariotto AB, Rowland JH. Anticipating the "Silver Tsunami": Prevalence Trajectories and Comorbidity Burden among Older Cancer Survivors in the United States. Cancer Epidemiol Biomarkers Prev. 2016;25(7):1029-36.
Healthy People 2030 Target
- There is no Healthy People 2030 target for the financial burden of cancer care.
Healthy People 2030 is a set of goals set forth by the Department of Health and Human Services.
Trends and Most Recent Estimates
- National Expenditures
- Total Cost
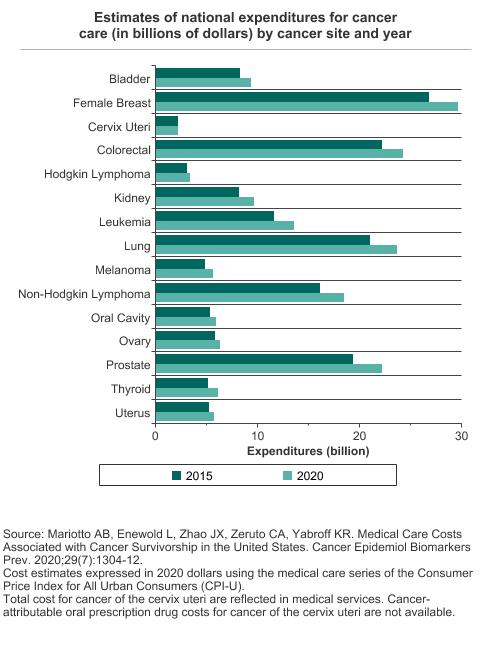
Estimates of national expenditures for cancer care (in billions of dollars) by cancer site and year Overview graph Cancer Site 2015 2020 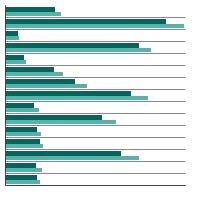

All sites $190.2 $208.9 Bladder $8.3 $9.4 Female Breast $26.8 $29.8 Cervix Uteri $2.2 $2.3 Colorectal $22.3 $24.3 Hodgkin Lymphoma $3.2 $3.5 Kidney $8.2 $9.7 Leukemia $11.7 $13.6 Lung $21.1 $23.8 Melanoma $4.9 $5.7 Non-Hodgkin Lymphoma $16.2 $18.6 Oral Cavity $5.4 $6.0 Ovary $5.9 $6.4 Prostate $19.4 $22.3 Thyroid $5.2 $6.1 Uterus $5.3 $5.8 - Medical Services
Estimates of national expenditures for medical services related to cancer care (in billions of dollars) by cancer site and year Overview graph Cancer Site 2015 2020 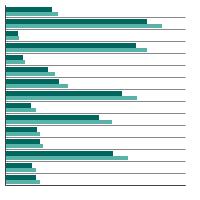
All sites $171.6 $188.1 Bladder $7.9 $8.9 Female Breast $23.7 $26.2 Cervix Uteri $2.2 $2.3 Colorectal $21.8 $23.7 Hodgkin Lymphoma $3.0 $3.3 Kidney $7.1 $8.4 Leukemia $9.1 $10.5 Lung $19.4 $21.9 Melanoma $4.4 $5.1 Non-Hodgkin Lymphoma $15.6 $17.9 Oral Cavity $5.3 $5.9 Ovary $5.8 $6.3 Prostate $17.9 $20.6 Thyroid $4.5 $5.3 Uterus $5.3 $5.8 - Prescription Drugs
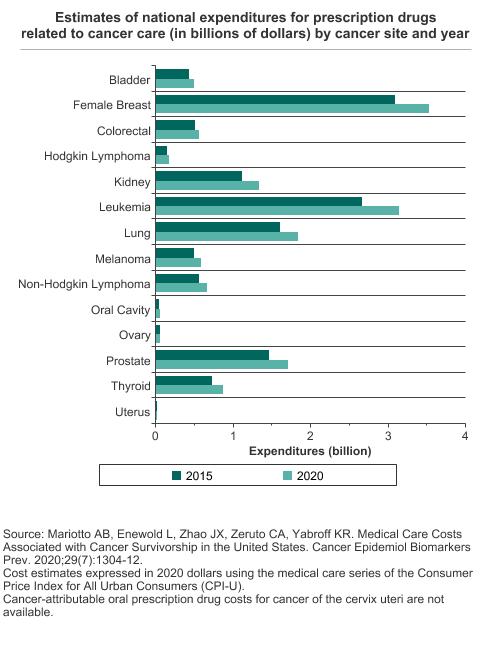
Estimates of national expenditures for prescription drugs related to cancer care (in billions of dollars) by cancer site and year Overview graph Cancer Site 2015 2020 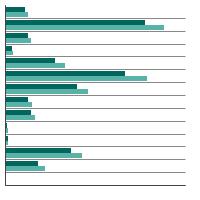
All sites $18.6 $20.9 Bladder $0.4 $0.5 Female Breast $3.1 $3.5 Cervix Uteri - - Colorectal $0.5 $0.6 Hodgkin Lymphoma $0.2 $0.2 Kidney $1.1 $1.3 Leukemia $2.7 $3.2 Lung $1.6 $1.8 Melanoma $0.5 $0.6 Non-Hodgkin Lymphoma $0.6 $0.7 Oral Cavity $0.1 $0.1 Ovary $0.1 $0.1 Prostate $1.5 $1.7 Thyroid $0.7 $0.9 Uterus $0.0 $0.0 - Cancer-attributable oral prescription drug costs for cancer of the cervix uteri are not available.
- Per Patient Cost
- Medical Services
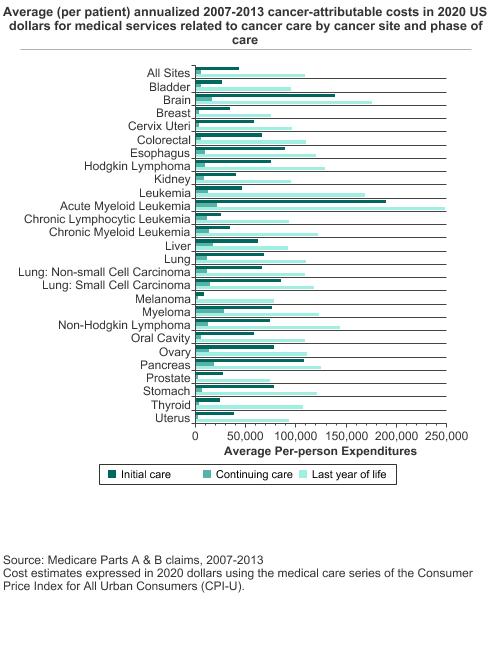
Average (per patient) annualized 2007-2013 cancer-attributable costs in 2020 US dollars for medical services related to cancer care by cancer site and phase of care Overview graph Cancer Site Initial care Continuing care Last year of life 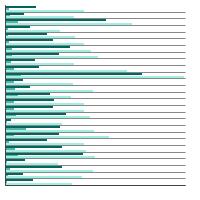
All Sites $43,516.1 $5,517.6 $109,727.3 Bladder $26,442.8 $6,350.4 $95,985.4 Brain $139,813.8 $17,385.6 $176,354.9 Breast $34,979.5 $3,539.6 $76,101.2 Cervix Uteri $58,715.6 $3,956.0 $97,026.4 Colorectal $66,523.5 $6,246.3 $110,143.7 Esophagus $89,947.2 $9,785.9 $120,033.8 Hodgkin Lymphoma $75,372.5 $9,785.9 $128,986.8 Kidney $41,121.7 $8,536.7 $95,985.4 Leukemia $47,263.9 $12,700.9 $169,588.0 Acute Myeloid Leukemia $190,305.0 $21,758.1 $249,124.7 Chronic Lymphocytic Leukemia $25,505.9 $12,076.3 $94,111.5 Chronic Myeloid Leukemia $34,875.4 $13,950.2 $122,428.2 Liver $62,775.7 $18,218.5 $92,133.5 Lung $68,293.3 $12,388.6 $110,247.8 Lung: Non-small Cell Carcinoma $67,148.1 $12,284.5 $109,102.7 Lung: Small Cell Carcinoma $85,366.6 $14,783.0 $118,055.8 Melanoma $8,536.7 $2,706.8 $78,912.0 Myeloma $77,038.1 $28,524.9 $123,365.1 Non-Hodgkin Lymphoma $75,164.2 $12,805.0 $144,706.8 Oral Cavity $58,715.6 $5,934.0 $110,039.6 Ovary $79,120.3 $14,158.4 $112,017.6 Pancreas $108,165.7 $18,426.7 $125,030.8 Prostate $28,108.5 $2,602.6 $74,227.3 Stomach $79,120.3 $7,079.2 $122,011.8 Thyroid $24,881.2 $4,060.1 $107,437.0 Uterus $39,039.6 $3,019.1 $93,590.9 - Oral Prescription Drugs
Average (per patient) annualized 2007-2013 cancer-attributable costs in 2020 US dollars for oral prescription drugs related to cancer care by cancer site and phase of care Overview graph Cancer Site Initial care Continuing care Last year of life 
All Sites $1,873.9 $1,041.1 $4,372.4 Bladder $624.6 $520.5 $1,353.4 Brain $2,394.4 $1,353.4 $1,873.9 Breast $1,145.2 $832.8 $2,706.8 Cervix Uteri $0.0 $0.0 $520.5 Colorectal $416.4 $208.2 $1,353.4 Esophagus $1,561.6 $832.8 $937.0 Hodgkin Lymphoma $2,810.9 $520.5 $2,602.6 Kidney $2,290.3 $1,873.9 $11,763.9 Leukemia $6,871.0 $6,871.0 $6,038.1 Acute Myeloid Leukemia $9,057.2 $4,164.2 $4,893.0 Chronic Lymphocytic Leukemia $728.7 $728.7 $2,915.0 Chronic Myeloid Leukemia $32,481.0 $46,743.4 $15,303.5 Liver $8,849.0 $7,599.7 $12,180.4 Lung and Bronchus $3,643.7 $2,706.8 $4,580.7 Lung: Non-small Cell Carcinoma $3,747.8 $2,810.9 $4,997.1 Lung: Small Cell Carcinoma $2,290.3 $1,145.2 $1,873.9 Melanoma $624.6 $312.3 $3,956.0 Myeloma $29,878.3 $26,442.8 $24,985.3 Non-Hodgkin Lymphoma $1,561.6 $624.6 $2,602.6 Oral Cavity $520.5 $0.0 $937.0 Ovary $1,041.1 $104.1 $937.0 Pancreas $5,517.6 $3,851.9 $5,829.9 Prostate $312.3 $312.3 $5,829.9 Stomach $3,435.5 $2,498.5 $1,769.8 Thyroid $937.0 $937.0 $5,517.6 Uterus $104.1 $0.0 $1,145.2

Additional Information
- Financial Toxicity (Financial Distress) and Cancer Treatment (PDQ®). National Cancer Institute.
- Productivity costs of cancer mortality in the United States: 2000-2020. Bradley CJ, Yabroff KR, Dahman B, Feuer EJ, Mariotto A, Brown ML. J Natl Cancer Inst 2008; 100: 1763-70.
- Projections of the cost of cancer care in the United States: 2010–2020. Mariotto AB, Yabroff KR, Shao Y, Feuer EJ, Brown ML. J Natl Cancer Inst 2011;103(2): 117–28.
- Evaluation of trends in the cost of initial cancer treatment. Warren, JL, Yabroff KR, Meekins A, Topor M, Lamont E, Brown ML. J Natl Cancer Inst 2008; 100: 888-897.