On This Page:
- Background
- Measure
- Healthy People 2030 Target
- Data Source
- Trends and Most Recent Estimates
- Additional Information
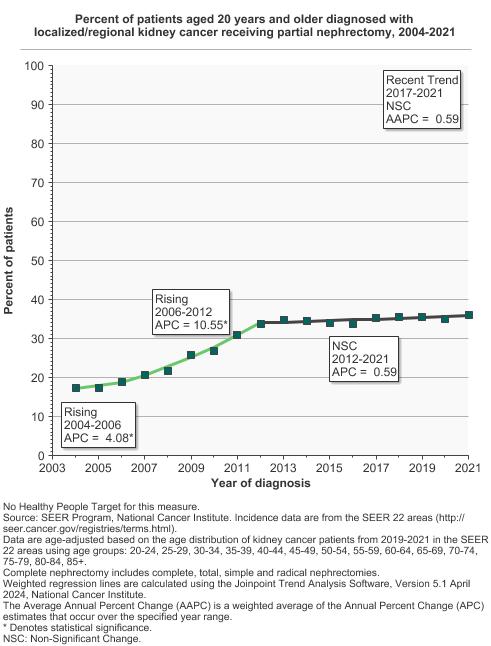
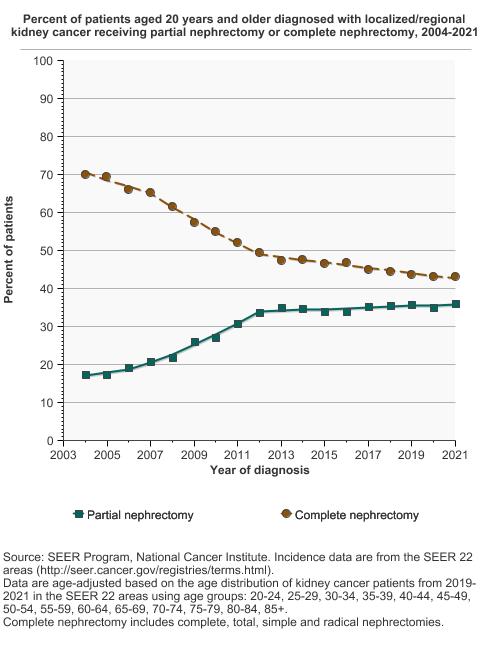
In 2021, 36.0% of patients diagnosed with localized/regional kidney cancer received a partial nephrectomy.
Background
Kidney cancer, also called renal cell cancer, is one of the ten most common cancers in both men and women. Treatment options may include surgery (open or laparoscopic), local therapies such as ablation and embolization, active surveillance, radiation therapy, targeted therapy, immunotherapy, and chemotherapy. These treatments might be used alone or in combination, depending on various factors.
Surgery is the main treatment for most types of kidney cancer. Since 2000, the use of complete nephrectomy (removal of the whole kidney) in patients with localized kidney cancer or cancer in the immediate surrounding tissue (regional kidney cancer) has decreased, while the rate of partial nephrectomy (removal of only the affected part of the kidney) has increased. Although there are patients for whom it is not possible, partial nephrectomy is now the preferred treatment for patients with early stage kidney cancer,. Studies have shown long-term outcomes after partial nephrectomy and complete nephrectomy are about the same. Also, partial nephrectomy may prevent serious side effects like chronic kidney disease.
Systemic therapy (chemotherapy, targeted therapy, or immunotherapy) also may be used as a treatment for some individuals diagnosed with kidney cancer. Adjuvant systemic therapies such as pembrolizumab and sunitinib are sometimes used in the treatment of stage II and III kidney cancer, and a broader range of systemic options are used in metastatic disease.
Measure
Partial nephrectomy or complete nephrectomy in patients with localized/regional kidney cancer.
Receipt of systemic therapy among patients with kidney cancer.
Data Source
Nephrectomy estimates: SEER 22 Registries, National Cancer Institute, 2004–2021.
Systemic therapy estimates: SEER Patterns of Care/Quality of Care Studies, National Cancer Institute, 2004-2019.
Healthy People 2030 Target
- There are no Healthy People 2030 targets for cancer treatment, including kidney cancer treatment.
Healthy People 2030 is a set of goals set forth by the Department of Health and Human Services.
Trends and Most Recent Estimates
- Nephrectomy
- All Races/Ethnicities, Ages 20+
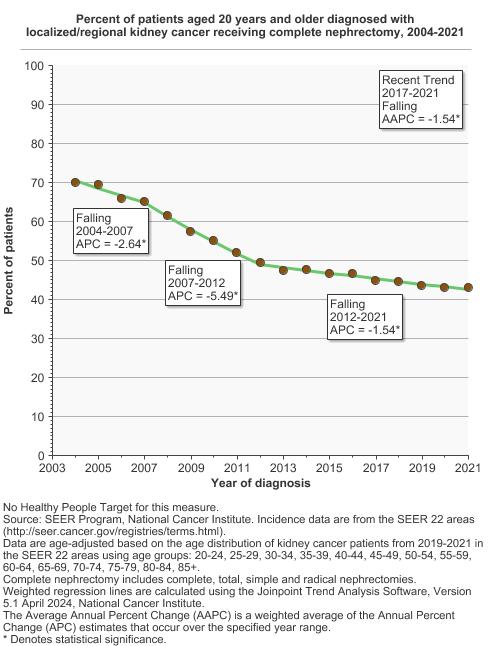
Percent of patients aged 20 years and older diagnosed with localized/regional kidney cancer receiving partial nephrectomy or complete nephrectomy, 2004-2021 Overview Graph Detailed Trend Graphs Most Recent Estimates (2021) Percent of patients 95% Confidence Interval 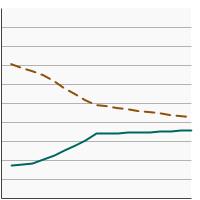

Partial nephrectomy 
36.0 35.6 - 36.5 Complete nephrectomy 43.1 42.6 - 43.5 - All Races/Ethnicities, Ages 20-64
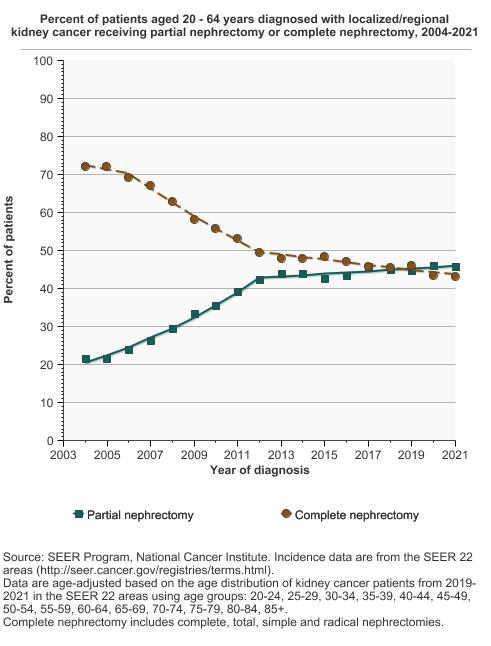
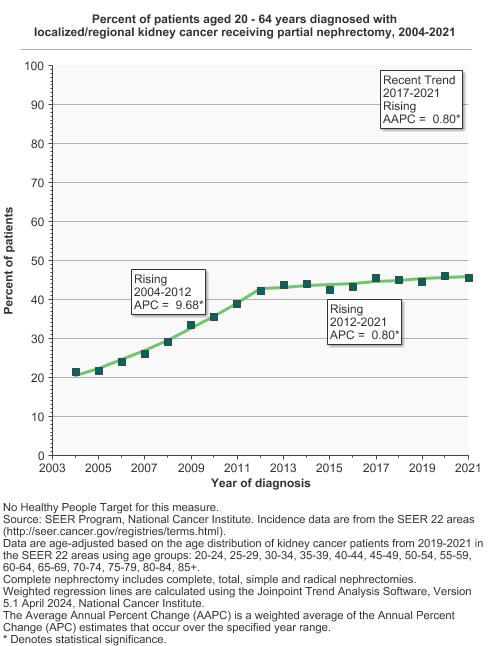
Percent of patients aged 20 - 64 years diagnosed with localized/regional kidney cancer receiving partial nephrectomy or complete nephrectomy, 2004-2021 Overview Graph Detailed Trend Graphs Most Recent Estimates (2021) Percent of patients 95% Confidence Interval 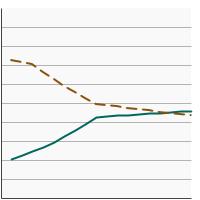
Partial nephrectomy 45.7 45.0 - 46.4 Complete nephrectomy 43.2 42.6 - 43.9 - All Races/Ethnicities, Ages 65 and Older
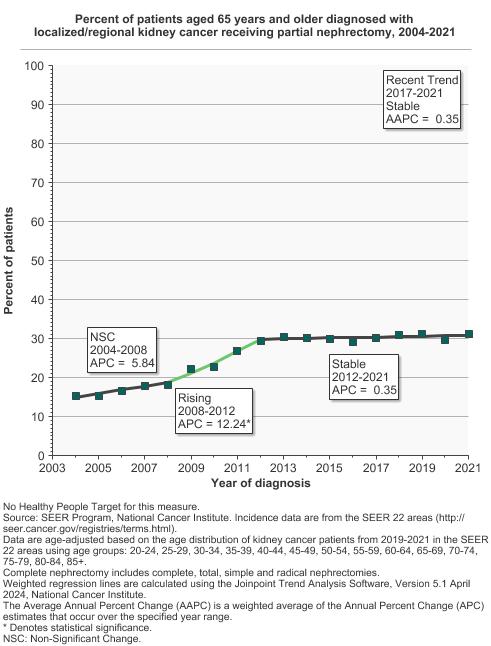
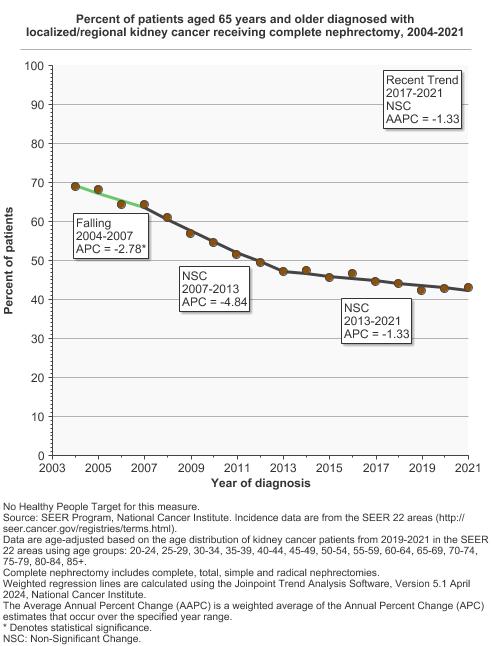
Percent of patients aged 65 years and older diagnosed with localized/regional kidney cancer receiving partial nephrectomy or complete nephrectomy, 2004-2021 Overview Graph Detailed Trend Graphs Most Recent Estimates (2021) Percent of patients 95% Confidence Interval 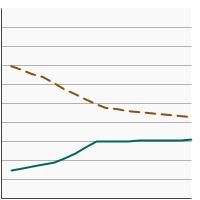
Partial nephrectomy 31.3 31.0 - 31.6 Complete nephrectomy 43.0 42.6 - 43.3 - Non-Hispanic White, Ages 20+
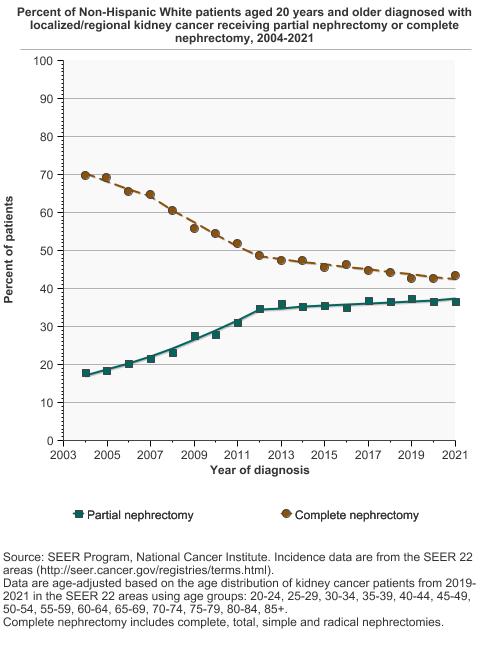
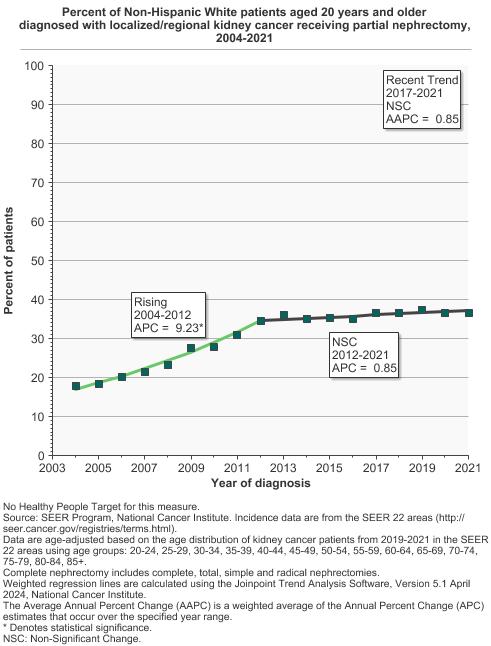
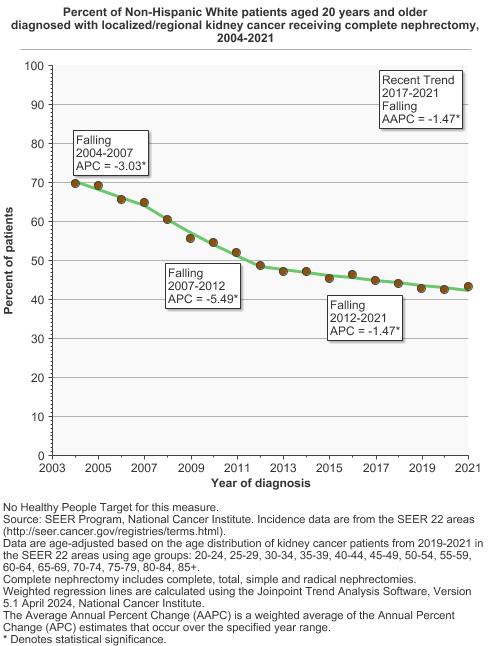
Percent of Non-Hispanic White patients aged 20 years and older diagnosed with localized/regional kidney cancer receiving partial nephrectomy or complete nephrectomy, 2004-2021 Overview Graph Detailed Trend Graphs Most Recent Estimates (2021) Percent of patients 95% Confidence Interval 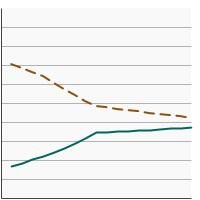
Partial nephrectomy 36.7 36.3 - 37.0 Complete nephrectomy 43.4 43.0 - 43.7 - Non-Hispanic Black, Ages 20+
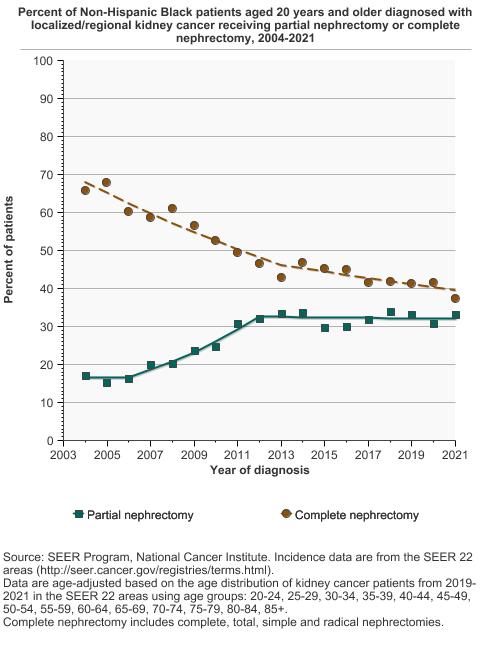
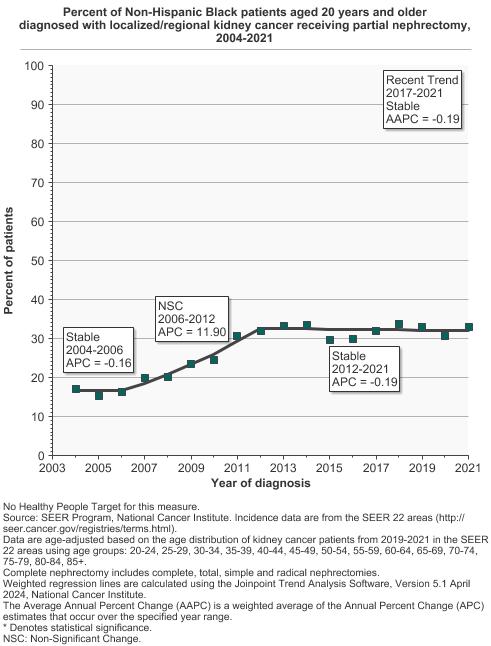
Percent of Non-Hispanic Black patients aged 20 years and older diagnosed with localized/regional kidney cancer receiving partial nephrectomy or complete nephrectomy, 2004-2021 Overview Graph Detailed Trend Graphs Most Recent Estimates (2021) Percent of patients 95% Confidence Interval 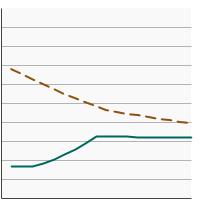
Partial nephrectomy 33.2 33.0 - 33.3 Complete nephrectomy 37.2 37.1 - 37.4 - Hispanic, Ages 20+
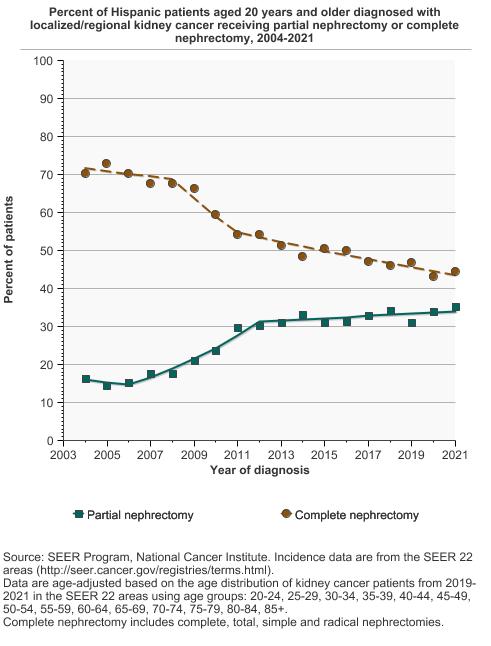
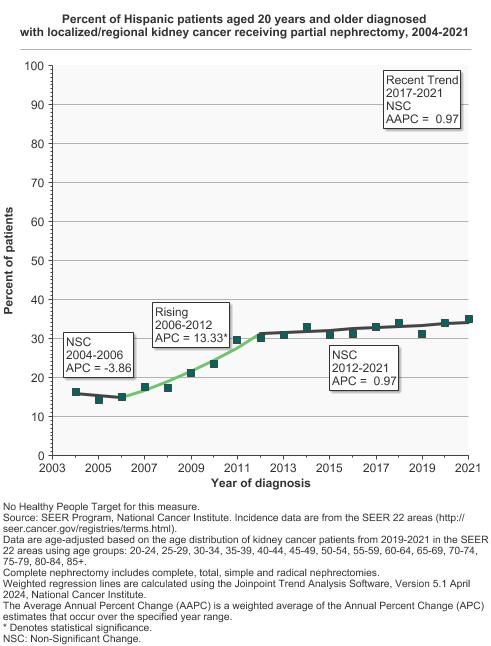
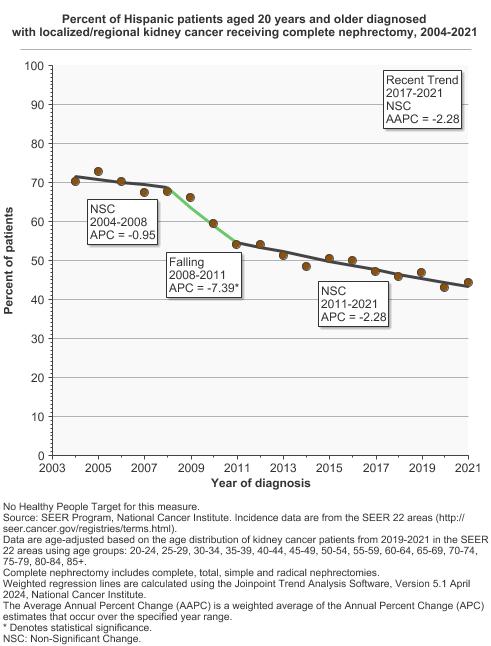
Percent of Hispanic patients aged 20 years and older diagnosed with localized/regional kidney cancer receiving partial nephrectomy or complete nephrectomy, 2004-2021 Overview Graph Detailed Trend Graphs Most Recent Estimates (2021) Percent of patients 95% Confidence Interval 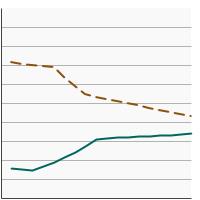
Partial nephrectomy 35.2 35.0 - 35.4 Complete nephrectomy 44.5 44.3 - 44.7 - Non-Hispanic Asian/Pacific Islander, Ages 20+
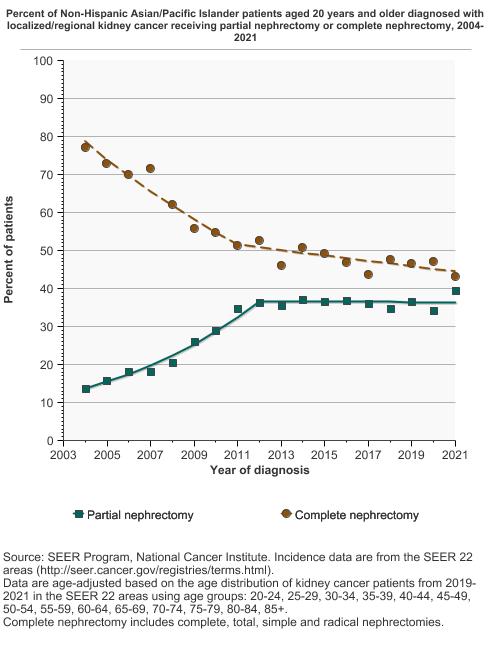
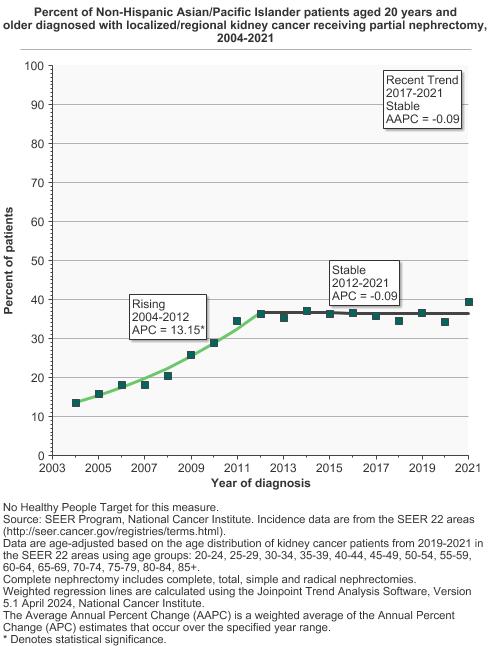
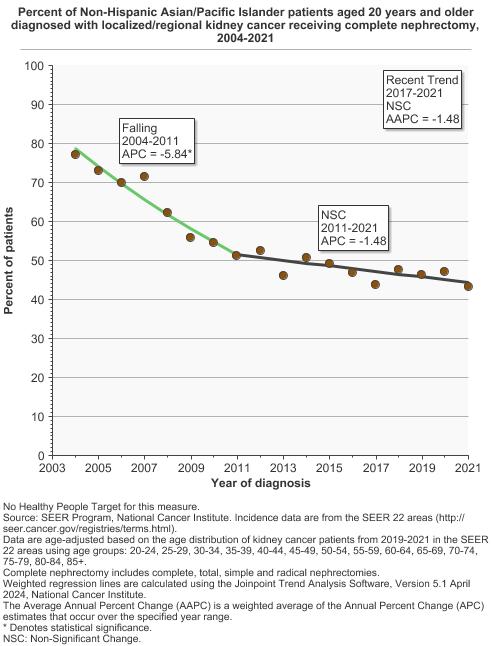
Percent of Non-Hispanic Asian/Pacific Islander patients aged 20 years and older diagnosed with localized/regional kidney cancer receiving partial nephrectomy or complete nephrectomy, 2004-2021 Overview Graph Detailed Trend Graphs Most Recent Estimates (2021) Percent of patients 95% Confidence Interval 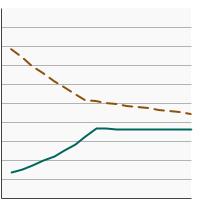
Partial nephrectomy 39.5 39.4 - 39.6 Complete nephrectomy 43.3 43.1 - 43.4
- Systemic Therapy
- By Age at Diagnosis
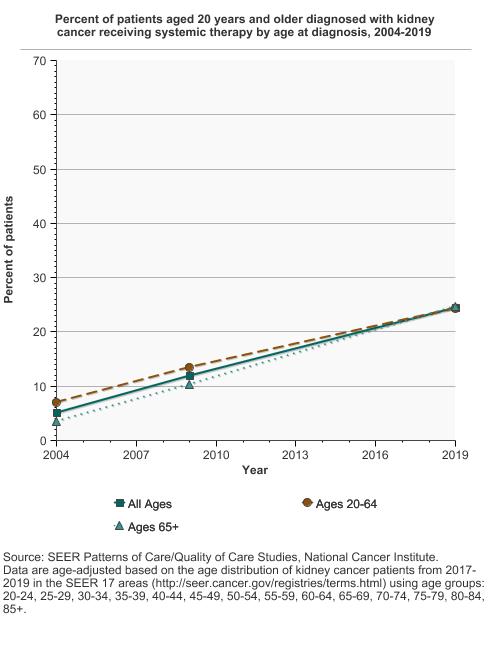
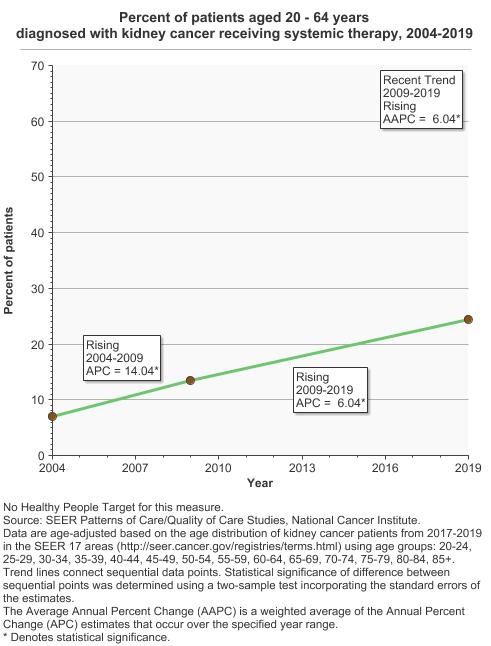
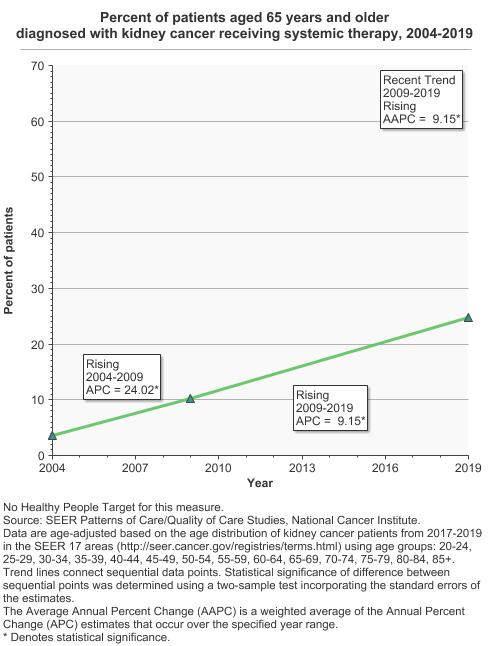
Percent of patients aged 20 years and older diagnosed with kidney cancer receiving systemic therapy by age at diagnosis, 2004-2019 Overview Graph Detailed Trend Graphs Most Recent Estimates (2019) Percent of patients 95% Confidence Interval 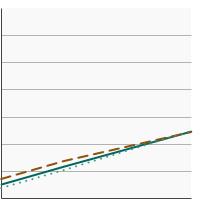
All Ages 24.5 22.2 - 27.0 Ages 20-64 24.3 21.4 - 27.5 Ages 65+ 24.7 21.1 - 28.7 - By Race/Ethnicity
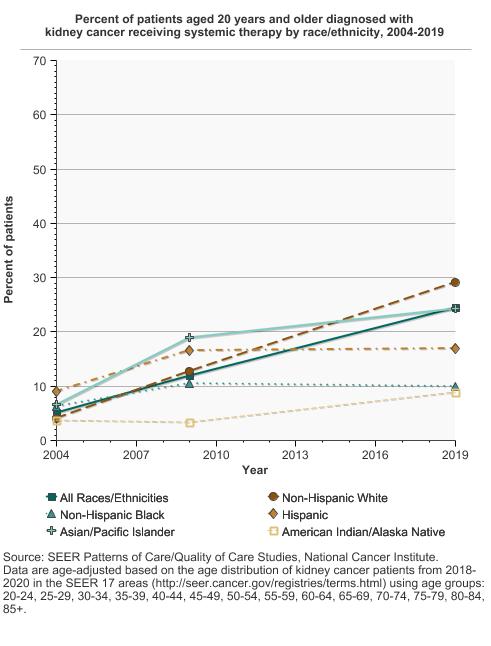
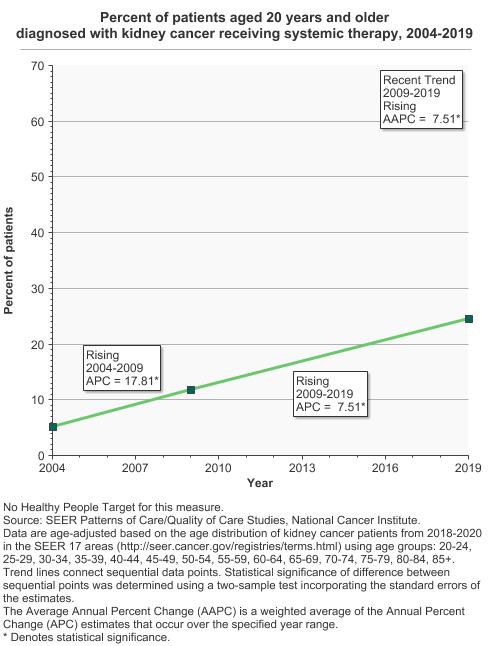
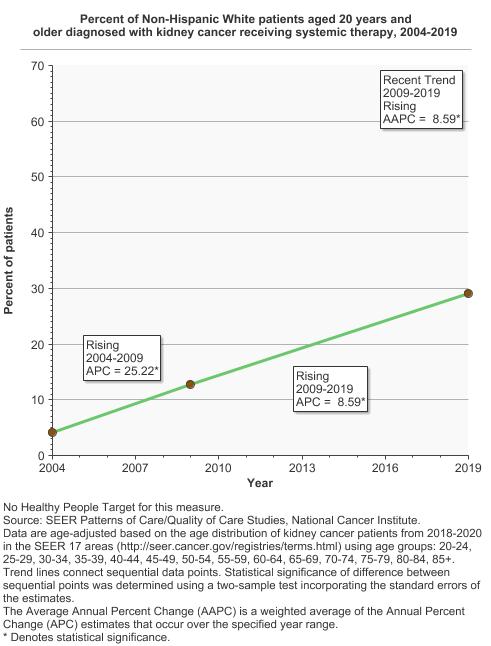
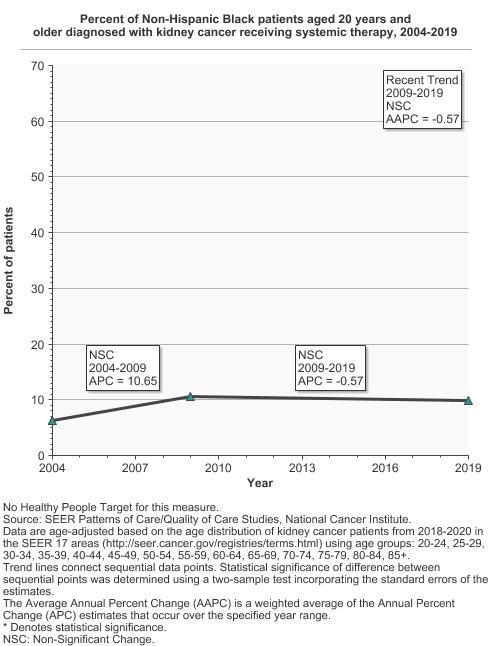
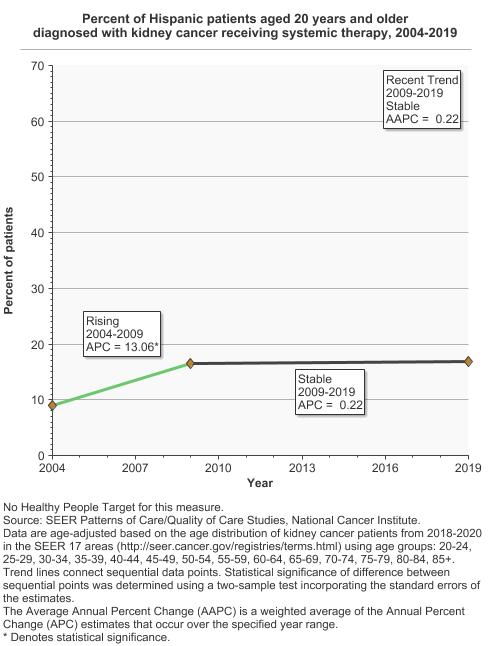
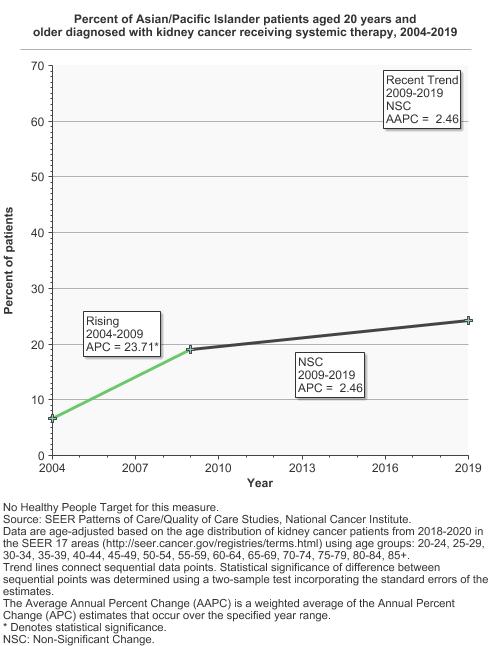
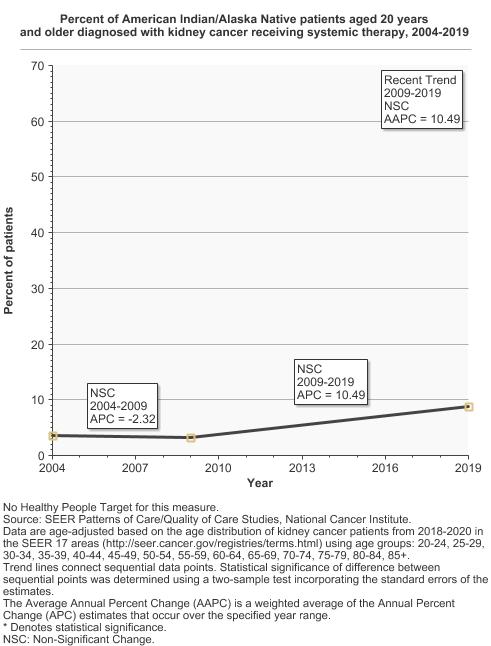
Percent of patients aged 20 years and older diagnosed with kidney cancer receiving systemic therapy by race/ethnicity, 2004-2019 Overview Graph Detailed Trend Graphs Most Recent Estimates (2019) Percent of patients 95% Confidence Interval 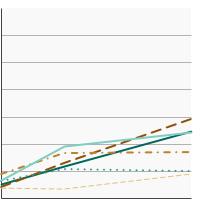
All Races/Ethnicities 24.5 22.2 - 27.0 Non-Hispanic White 29.1 25.8 - 32.6 Non-Hispanic Black 9.9 6.8 - 14.3 Hispanic 16.9 13.7 - 20.7 Asian/Pacific Islander 24.3 18.5 - 31.2 American Indian/Alaska Native 8.8 4.3 - 17.0 - By Stage at Diagnosis
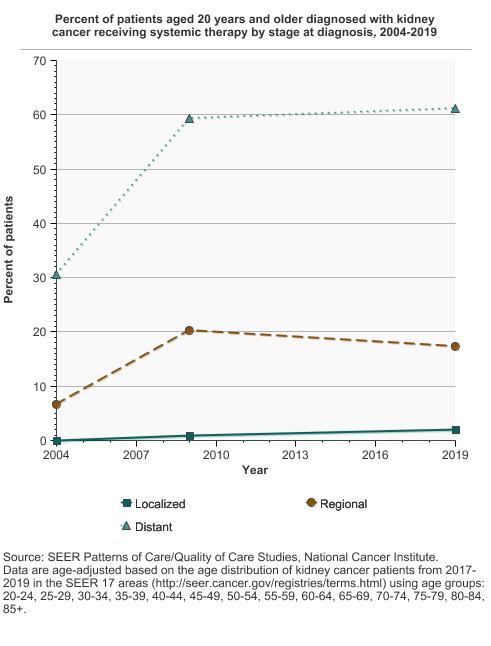
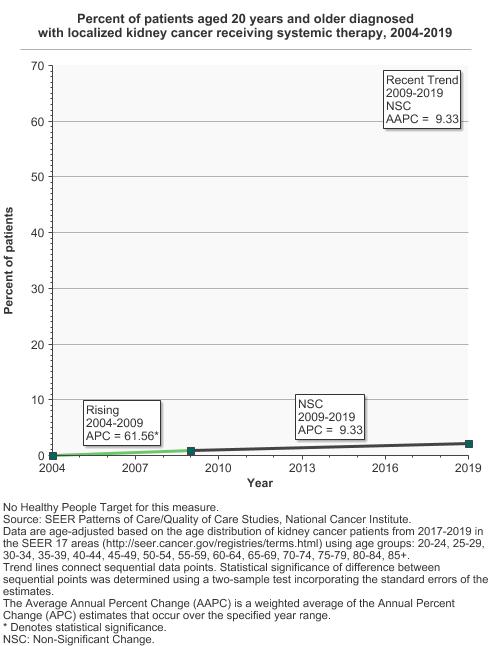
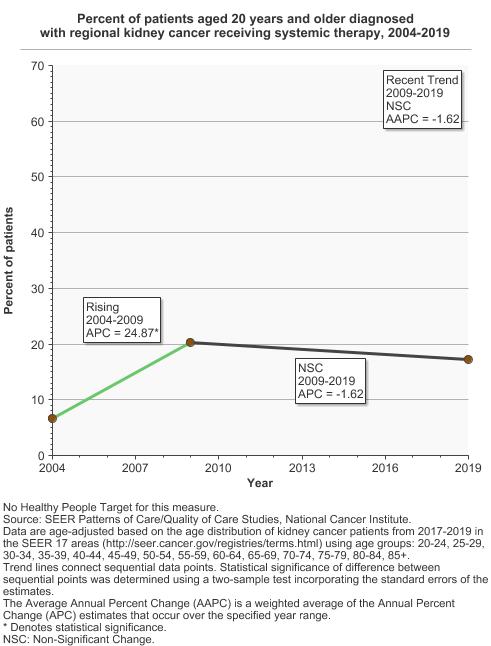
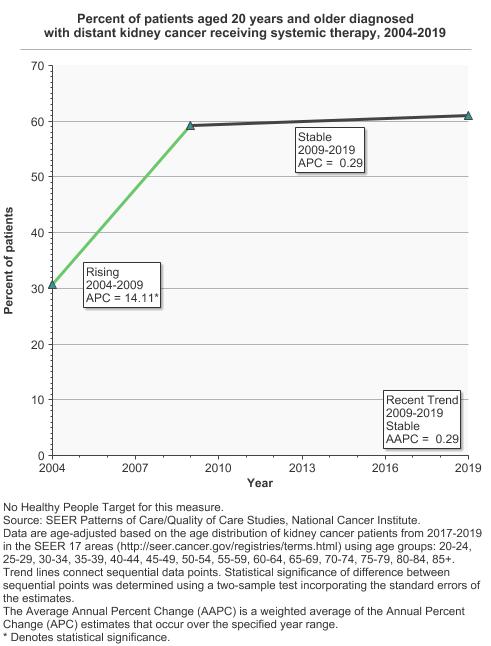
Percent of patients aged 20 years and older diagnosed with kidney cancer receiving systemic therapy by stage at diagnosis, 2004-2019 Overview Graph Detailed Trend Graphs Most Recent Estimates (2019) Percent of patients 95% Confidence Interval 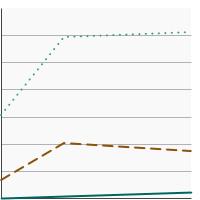
Localized 2.1 1.1 - 3.8 Regional 17.3 12.7 - 23.0 Distant 61.1 56.6 - 65.3


Additional Information
- Kidney (Renal Cell) Cancer. National Cancer Institute.
- Renal Cell Cancer Treatment (PDQ®)-Patient Version. National Cancer Institute.
- Kidney Cancer Treatment. American Cancer Society.
- Kidney Cancer (NCCN Guidelines for Patients®). National Comprehensive Cancer Network.
- Advances in Kidney Cancer Research. National Cancer Institute.
- Renal Cell Cancer Treatment (PDQ®)-Health Professional Version. National Cancer Institute.
- SEER Cancer Stat Facts: Kidney and Renal Pelvis Cancer. National Cancer Institute.
- SEER-Medicare Linked Database. National Cancer Institute.
- SEER Patterns of Care/Quality of Care Studies. National Cancer Institute.