On This Page:
- Background
- Measure
- Healthy People 2030 Target
- Data Source
- Trends and Most Recent Estimates
- Additional Information
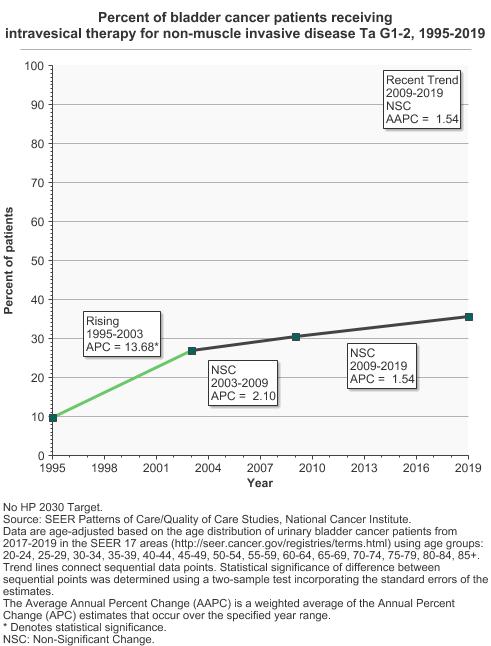
In 2019, 35.5% of patients with non-muscle invasive disease received intravesical therapy.
Background
Bladder cancer is a disease in which malignant (cancer) cells form in the tissues of the bladder. The first targeted therapy for bladder cancer was approved by the FDA in 2019. Treatment options depend on the stage of bladder cancer. Four types of standard treatment are used: surgery, radiation therapy, chemotherapy, and immunotherapy. Intravesical (within the bladder) therapy, one type of immunotherapy, involves the instillation of an agent or biologic into the bladder. The use of intravesical therapy has been associated with improved survival for individuals with non-muscle invasive bladder cancer. There have been no significant increases in the use of intravesical therapy for patients diagnosed with non-muscle invasive in the most recent time period, while use of intravesical therapy has increased significantly in the most recent time period for those diagnosed with muscle-invasive and metastatic disease. There have been no significant increases in the use of systemic therapy for patients diagnosed with non-muscle invasive in the most recent time period, while use of systemic therapy has increased significantly in the most recent time period for those diagnosed with muscle-invasive and metastatic disease. For the bladder cancer treatment figures presented here, please note that Ta G1-2 means non-invasive papillary carcinoma (Ta) that is Grade 1 (well differentiated) or Grade 2 (moderately differentiated). This is a subgroup of non-muscle invasive bladder cancer.
Measure
Percentage of individuals receiving intravesical therapy.
Percentage of individuals receiving systemic therapy.
Data Source
SEER Patterns of Care/Quality of Care Studies, National Cancer Institute, 1995-2019.
Healthy People 2030 Target
- There are no Healthy People 2030 targets for cancer treatment, including bladder cancer treatment.
Healthy People 2030 is a set of goals set forth by the Department of Health and Human Services.
Trends and Most Recent Estimates
- Intravesical Therapy
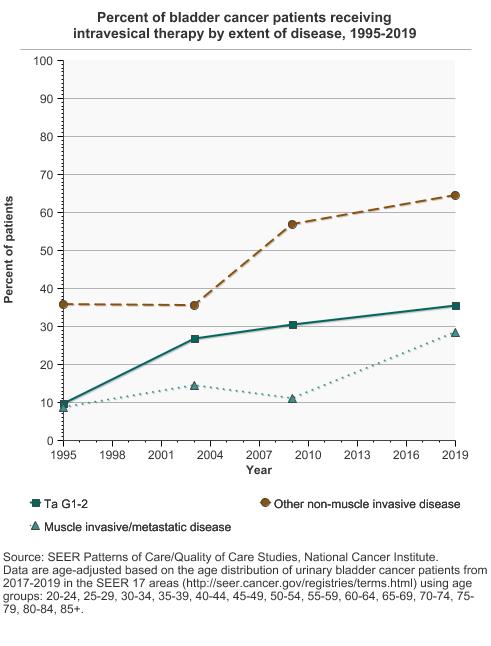
Percent of bladder cancer patients receiving intravesical therapy by extent of disease, 1995-2019 Overview Graph Detailed Trend Graphs Most Recent Estimates (2019) Percent of patients 95% Confidence Interval 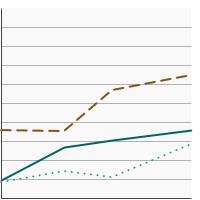

Ta G1-2 
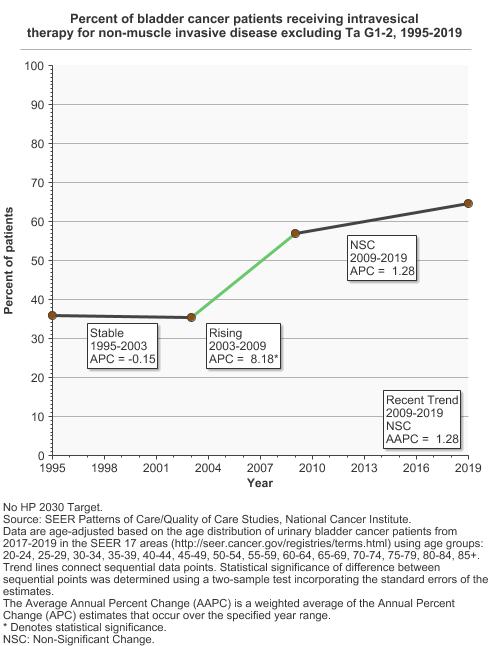
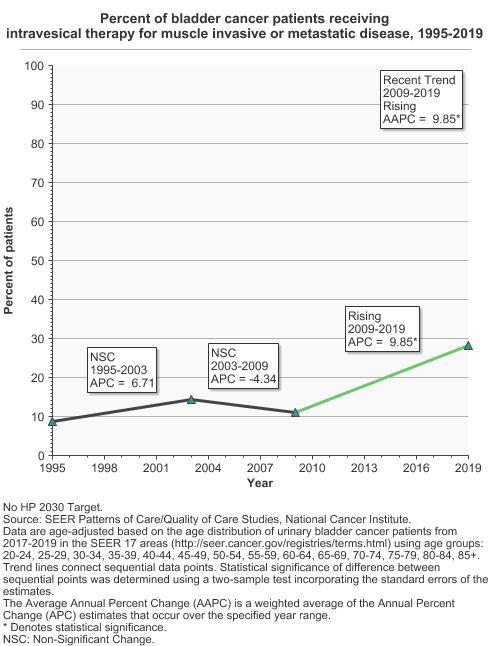
35.5 30.7 - 40.7 Other non-muscle invasive disease 64.6 60.3 - 68.6 Muscle invasive/metastatic disease 28.3 22.5 - 35.0 - Systemic Therapy
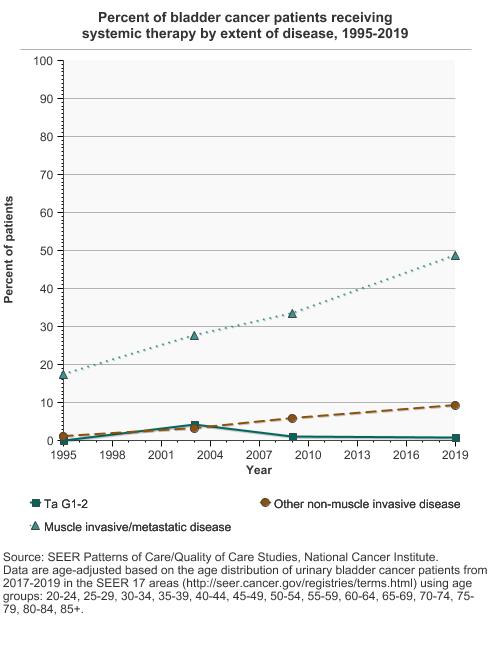
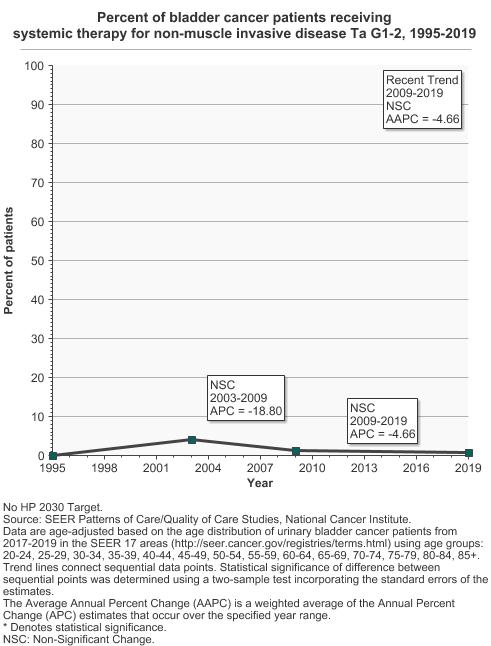
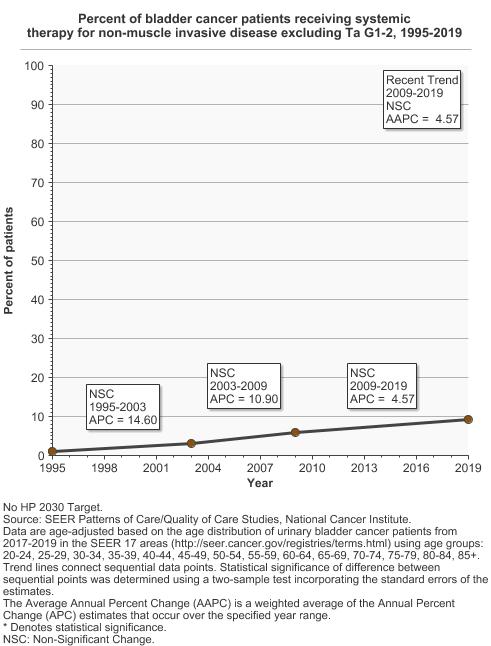
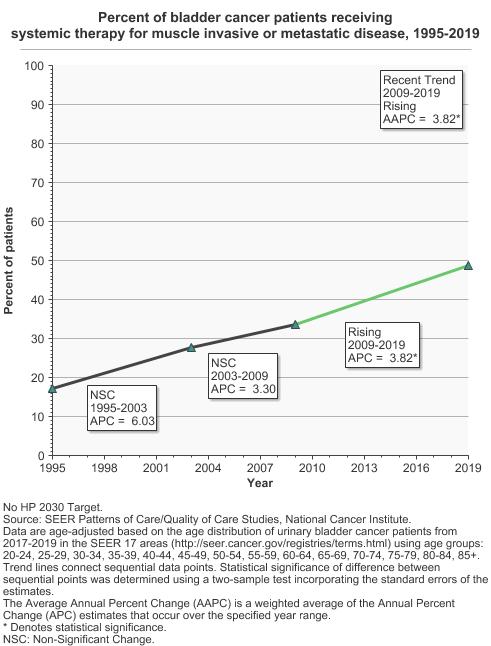
Percent of bladder cancer patients receiving systemic therapy by extent of disease, 1995-2019 Overview Graph Detailed Trend Graphs Most Recent Estimates (2019) Percent of patients 95% Confidence Interval 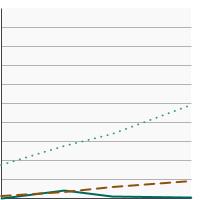
Ta G1-2 0.7 0.3 - 1.7 Other non-muscle invasive disease 9.2 7.1 - 11.9 Muscle invasive/metastatic disease 48.7 42.1 - 55.3
Additional Information
- Bladder Cancer. National Cancer Institute.
- Bladder Cancer Treatment (PDQ®)-Patient Version.National Cancer Institute.
- Treating Bladder Cancer. American Cancer Society.
- Advances in Bladder Cancer Research. National Cancer Institute.
- Bladder Cancer Treatment (PDQ®)-Health Professional Version. National Cancer Institute.
- SEER Cancer Stat Facts: Bladder Cancer. National Cancer Institute.
- SEER-Medicare Linked Database. National Cancer Institute.
- SEER Patterns of Care/Quality of Care Studies. National Cancer Institute.