On This Page:
- Background
- Measure
- Healthy People 2030 Target
- Data Source
- Trends and Most Recent Estimates
- Additional Information

Background
As illustrated in the present section, many cancer survivors continue to smoke after their cancer diagnosis. This increases their risk for chronic health conditions, second primary cancers related to smoking, and premature death. To enhance the length and health-related quality of their lives, efforts are needed to identify these individuals and provide them with evidence-based interventions to help them quit smoking and remain tobacco free.
As the population of cancer survivors increases and their expected time of survival lengthens, the health behaviors of these individuals are becoming an important focus of attention. Behavioral risk factors, such as smoking, affect the length and quality of life after diagnosis. Tracking these behaviors permits evaluation of how well cancer control efforts are working to reduce preventable disability and death among those with a history of cancer.
Measure
Rates of smoking among cancer survivors are based on the self-reporting of individuals with a cancer history who are interviewed as part of the annual population-based National Health Interview Survey (NHIS). Participants who had smoked at least 100 cigarettes in their lifetime and who, at the time of the interview, reported smoking every day or some days were considered to be currently smoking.
Data Source
Centers for Disease Control and Prevention, National Center for Health Statistics. National Health Interview Survey, 1992–2023.
Refer to the Data Sources page for more information about data collection years 2019+.
Healthy People 2030 Target
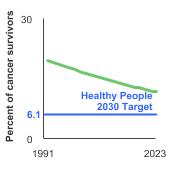
- There is no Healthy People 2030 target for smoking rates among cancer survivors, though Healthy People does include a national objective to increase the mental and physical health-related quality of life of cancer survivors; however, the goal for the general population is to decrease to 5 percent the proportion of people who currently smoke cigarettes.
- Healthy People 2030 Targets are developed and based on the general population and do not account for differences in the age distribution of cancer survivors compared to the general population. Cancer survivors are typically older than those in the general population who have not had cancer.
Healthy People 2030 is a set of goals set forth by the Department of Health and Human Services.
Note: Goals are indicated as blue line on Detailed Trend Graphs.
Trends and Most Recent Estimates
- By Sex
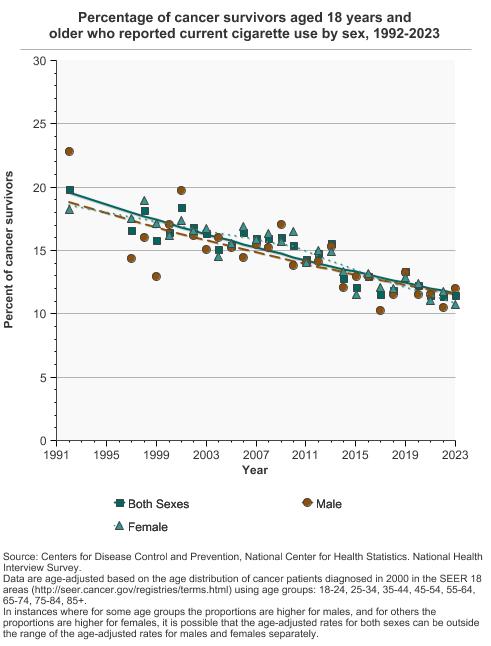
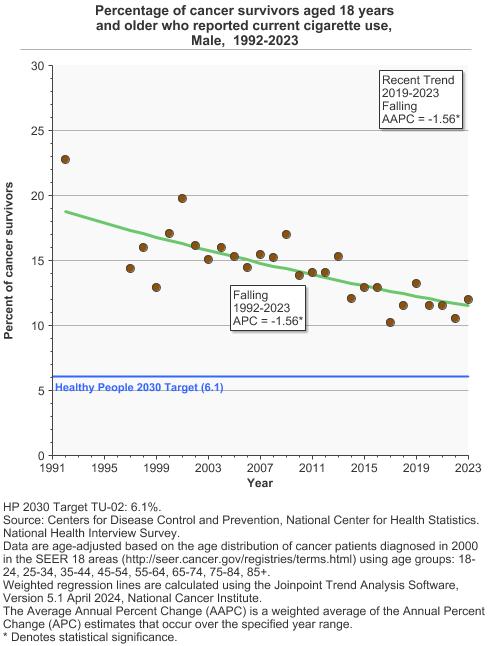
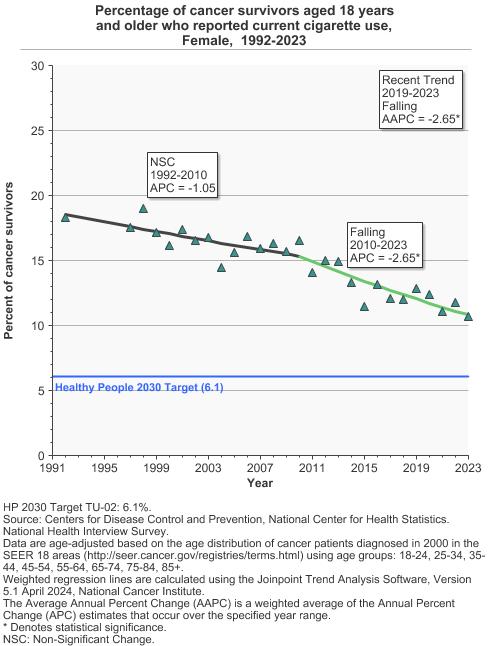
Percentage of cancer survivors aged 18 years and older who reported current cigarette use by sex, 1992-2023 Overview Graph Detailed Trend Graphs Most Recent Estimates (2023) Percent of cancer survivors 95% Confidence Interval 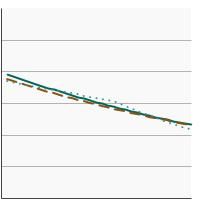

Both Sexes 
11.4 10.1 - 12.9 Male 12.0 9.9 - 14.5 Female 10.7 9.2 - 12.4 - By Age
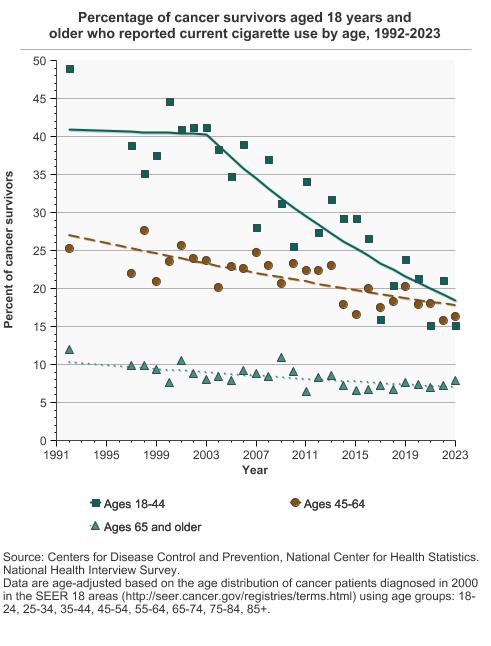
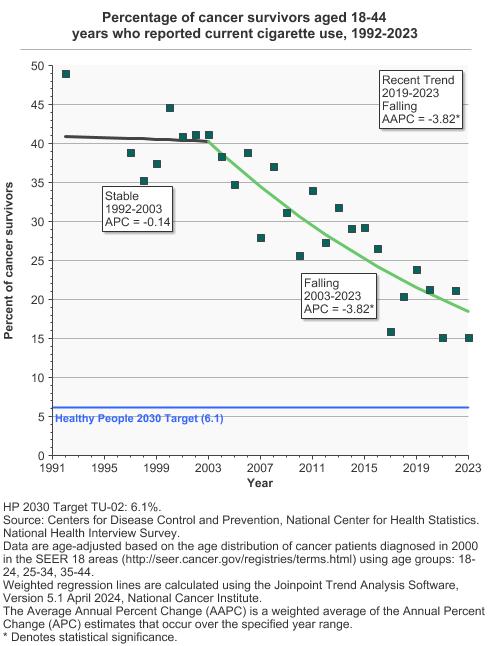
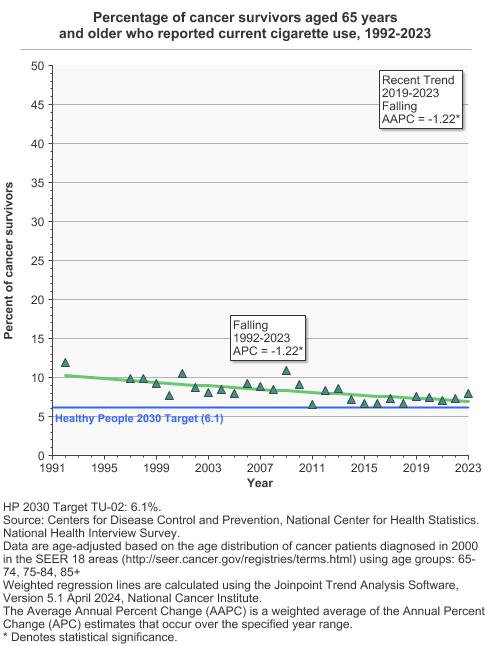
Percentage of cancer survivors aged 18 years and older who reported current cigarette use by age, 1992-2023 Overview Graph Detailed Trend Graphs Most Recent Estimates (2023) Percent of cancer survivors 95% Confidence Interval 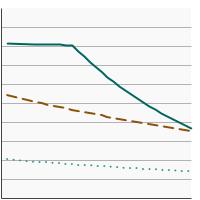
Ages 18-44 15.2 10.4 - 21.5 Ages 45-64 16.3 13.4 - 19.7 Ages 65 and older 7.9 6.7 - 9.3 - By Time Since Cancer Diagnosis
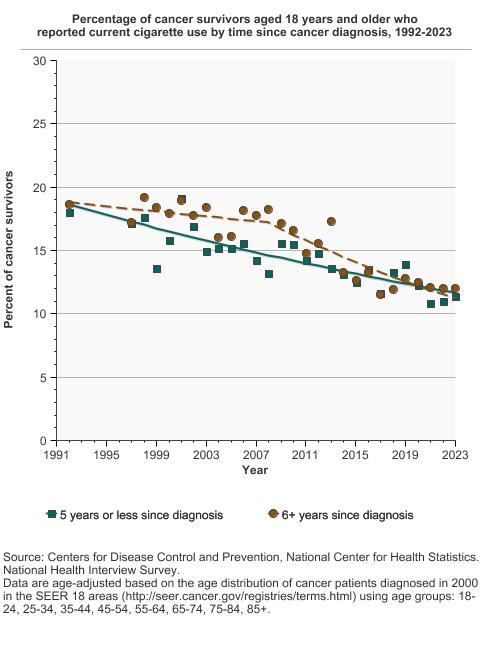
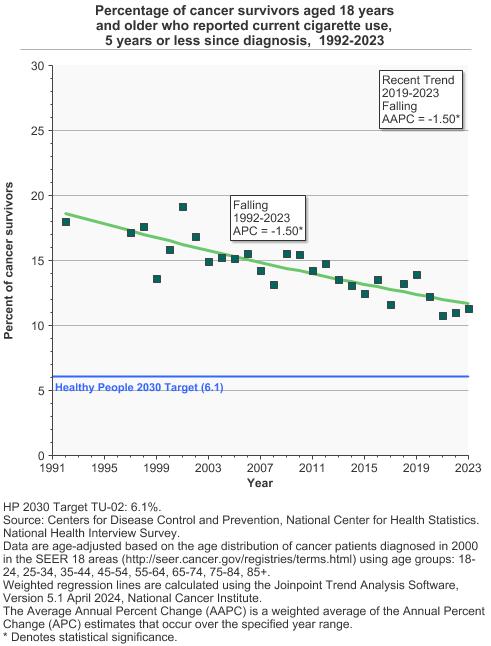
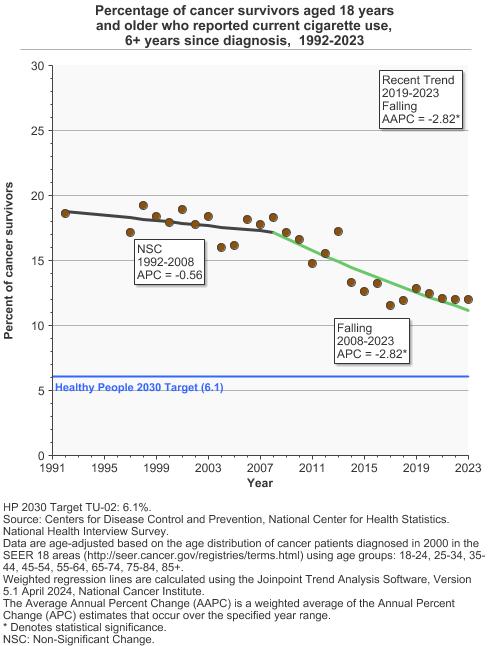
Percentage of cancer survivors aged 18 years and older who reported current cigarette use by time since cancer diagnosis, 1992-2023 Overview Graph Detailed Trend Graphs Most Recent Estimates (2023) Percent of cancer survivors 95% Confidence Interval 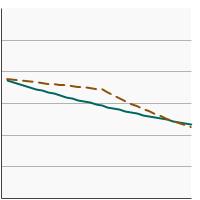
5 years or less since diagnosis 11.3 9.2 - 13.9 6+ years since diagnosis 12.0 10.3 - 14.0 - Compared to Remaining U.S. Population
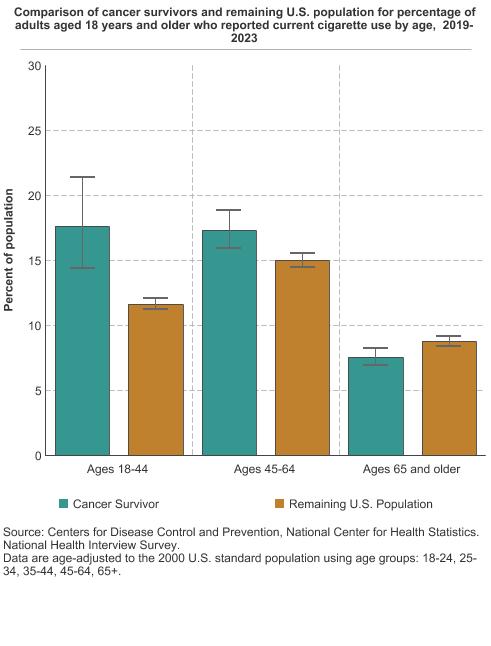
Comparison of cancer survivors and remaining U.S. population for percentage of adults aged 18 years and older who reported current cigarette use by age, 2019-2023 Overview graph Age Group Cancer Survivor Remaining U.S. Population Percent of population Confidence Interval Percent of population Confidence Interval 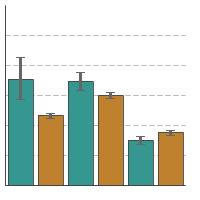
Ages 18-44 17.6 14.4 - 21.4 11.6 11.2 - 12.1 Ages 45-64 17.3 15.9 - 18.8 15.0 14.5 - 15.5 Ages 65 and older 7.5 6.9 - 8.2 8.8 8.4 - 9.2

Additional Information
- Smokefree.gov. National Cancer Institute.
- SmokefreeTXT. National Cancer Institute.
- Smokefree Women. National Cancer Institute.
- Tobacco. National Cancer Institute.
- Cancer Center Cessation Initiative. National Cancer Institute.
- Tobacco Control Evidence-Based Programs Listing. National Cancer Institute.
- Treating Tobacco Use in Cancer Care Settings. National Cancer Institute.
- Tobacco Cessation Tools & Resources. American Society of Clinical Oncology.
- Smoking Cessation, Version 1.2016, NCCN Clinical Practice Guidelines in Oncology. Shields PG, Herbst RS, Arenberg D, et al. J Natl Compre Canc Netw 2016;14(11):1430- 1468.
- Tobacco Smoking Cessation in Adults, Including Pregnant Persons: Interventions. U.S. Preventive Services Task Force.
- Monograph 23: Treating Smoking in Cancer Patients: An Essential Component of Cancer Care. National Cancer Institute.
- 2014 Surgeon General’s Report - The Health Consequences of Smoking: 50 Years of Progress. Centers for Disease Control and Prevention.
- Smoking Cessation: A Report of the Surgeon General. Centers for Disease Control and Prevention. 2020.
- Association of a Comprehensive Smoking Cessation Program With Smoking Abstinence Among Patients With Cancer. Cinciripini PM, Karam-Hage M, Kypriotakis G, et al. JAMA Netw Open. 2019 Sep 4;2(9):e1912251.
- Addressing a Core Gap in Cancer Care - The NCI Moonshot Program to Help Oncology Patients Stop Smoking. Croyle RT, Morgan GD, Fiore MC. N Engl J Med 2019; 380:512-515.
- Quitting smoking improves two-year survival after a diagnosis of non-small cell lung cancer. Gemine RE, Davies GR, Lanyon K, et al. Lung Cancer. 2023 Dec;186:107388.
- Prevalence of Current Cigarette Smoking by Sociodemographic Characteristics in U.S. Cancer Survivors. González Ruiz LM, Mondragón Márquez LI, Domínguez Bueso DL, Liu JJ. Subst Use Misuse. 2023 Nov 16:1-8.
- Prevalence of health behaviors among cancer survivors in the United States. Gregory K, Zhao L, Felder TM, et al. J Cancer Surviv. 2023 Mar 18:1–9
- Tobacco use in the oncology setting: advancing clinical practice and research. Gritz ER, Toll BA, Warren GW. Cancer Epidemiol Biomarkers Prev. 2014;23(1):3-9.
- Tobacco use and cessation for cancer survivors: an overview for clinicians. Karam-Hage M, Cinciripini PM, Gritz ER. CA Cancer J Clin. 2014 Jul-Aug;64(4):272-90.
- Cigarette smoking, comorbidity, and general health among survivors of adolescent and young adult cancer. Kaul S, Veeranki SP, Rodriguez AM, Kuo YF. Cancer. 2016 Sep 15;122(18):2895-905.
- Research priorities, measures, and recommendations for assessment of tobacco use in clinical cancer research. Land SR, Toll BA, Moinpour CM, et al. Clin Cancer Res. 2016;22(8):1907-13.
- A systematic review and meta-analysis of e-cigarette use among cancer survivors. Lopez-Olivo MA, James J, James J, et al. J Cancer Surviv. 2023 Mar 23.
- Impact of smoking status on health-related quality of life (HRQoL) in cancer survivors. Nolazco JI, Rosner BA, Roebuck EH, et al. Front Oncol. 2024 Jan 4;13:1261041.
- Smoking status among cancer patients by specialty: A U.S. nationwide representative analysis. Nolazco JI, Tang Y, Alkhatib KY, et al. Cancer Med. 2023 Dec;12(23):21389-21399.
- Effect of Sustained Smoking Cessation Counseling and Provision of Medication vs Shorter-term Counseling and Medication Advice on Smoking Abstinence in Patients Recently Diagnosed With Cancer: A Randomized Clinical Trial. Park ER, Perez GK, Regan S, et al. JAMA. 2020 Oct 13;324(14):1406-1418.
- Cigarette smoking before and after breast cancer diagnosis: mortality from breast cancer and smoking-related diseases.. Passarelli MN, Newcomb PA, Hampton JM, et. al. Journal of Clinical Oncology 2016;34(12):1315–22.
- Tobacco use and cancer-related symptom burden: Analysis of the US Population Assessment of Tobacco and Health Study. Price SN, Palmer AM, Fucito LM, et al. Cancer. 2023 Aug 1;129(15):2385-2394.
- Smoking Behaviors Among Black and Hispanic Cancer Patients: A Systematic Review of the Literature. Rabin J, Castelin S, Strauss N, et al. J Immigr Minor Health. 2023 Aug;25(4):925-952
- Use of electronic cigarettes among cancer survivors in the U.S.. Salloum RG, Getz KR, Tan ASL, et al. Am J Prev Med. 2016 Nov;51(5):762-766.
- Postdiagnosis Smoking Cessation and Reduced Risk for Lung Cancer Progression and Mortality: A Prospective Cohort Study. Sheikh M, Mukeriya A, Shangina O, et al. Ann Intern Med. 2021 Sep;174(9):1232-1239.
- Cigarette and Alternative Tobacco Product Use among Adult Cancer Survivors Enrolled in 9 ECOG-ACRIN Clinical Trials. Streck JM, Lee JW, Walter AW, et al. Cancer Epidemiol Biomarkers Prev. 2023 Nov 1;32(11):1552-1557.
- Cancer Center Cessation Initiative Special Issue. Journal of the National Comprehensive Cancer Network, Volume 19: Issue Suppl_1, Online Publication Date: Nov 2021.
- Assessing tobacco use by cancer patients and facilitating cessation: an American Association for Cancer Research policy statement. Toll B, Brandon T, Gritz E, et al. Clin Cancer Res. 2013;19(8):1941-8.
- Efficacy of a Smoking Cessation Intervention for Survivors of Cervical Intraepithelial Neoplasia or Cervical Cancer: A Randomized Controlled Trial. Vidrine JI, Sutton SK, Wetter DW, et al. J Clin Oncol. 2023 May 20;41(15):2779-2788
- The biological and clinical effects of smoking by patients with cancer and strategies to implement evidence-based tobacco cessation support. Warren GW, Sobus S, Gritz ER. Lancet Oncol. 2014;15(12): e568–e80.
- Use of electronic cigarettes among African American cancer survivors. Wharram CE, Kyko JM, Ruterbusch JJ, et al. Cancer. 2023 Oct 15;129(20):3334-3345.
- Active smoking and mortality among colorectal cancer survivors: the Cancer Prevention Study II nutrition cohort. Yang B, Jacobs EJ, Gapstur SM, et al. J Clin Oncol. 2015;33(8):885–93.
- Association of Cigarette Smoking and Alcohol Consumption With Subsequent Mortality Among Black Breast Cancer Survivors in New Jersey. Zeinomar N, Qin B, Amin S, et al. JAMA Netw Open. 2023 Jan 3;6(1):e2252371.