On This Page:
- Background
- Measure
- Healthy People 2030 Target
- Data Source
- Trends and Most Recent Estimates
- Additional Information
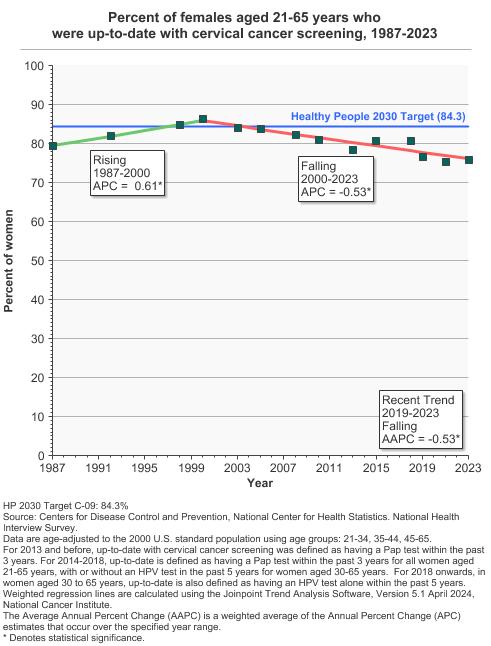
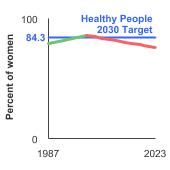
In 2023, 75.8% of women aged 21-65 years were up-to-date with cervical cancer screening.
Background
Screening methods used to find cervical changes that may lead to cervical cancer include the Pap test (cytology-based screening, where a sample of cervical cells are collected and examined under a microscope) and human papillomavirus (HPV) testing (which tests cervical cells for the presence of high-risk types of HPV, a viral infection causing nearly all cervical cancer). Such screening tests may find cancers earlier when they are more easily treated. Women who have never been screened face the greatest risk of developing invasive cervical cancer.
The U.S. Preventive Services Task Force (USPSTF) recommends screening for cervical cancer with the Pap test alone every 3 years in women aged 21 to 29 years. In women aged 30 to 65 years, the USPSTF recommends the Pap test alone every 3 years or HPV testing, with or without Pap co-testing, every 5 years.
Measure
The percentage of women aged 21 to 65 years who were up-to-date with cervical cancer screening, by race/ethnicity, income, and education level. For 2013 and before, up-to-date was defined as having a Pap test within the past 3 years. For 2014-2018, up-to date is defined as having a Pap test within the past 3 years for all women aged 21 to 65 years, or having a Pap test, with or without an HPV test, in the past 5 years for women aged 30 to 65 years.
Starting in 2018, up-to-date was additionally defined as having an HPV test alone in the past 5 years for women aged 30 to 65 years.
Measurement challenges
We track cervical cancer screening rates in U.S. women using a large, national, in-person survey in which people are asked about their health behaviors and the medical care they receive (see Data Source, below). There are important limitations to this method that impact what information we can accurately collect and how confident we can be in the findings. Studies have found that certain types of healthcare survey questions can be difficult for people to clearly understand and answer.
It can be challenging to determine by self-report alone which type of cervical cancer screening test a woman received (i.e., a Pap smear, HPV test, or both). Both tests appear identical to the woman experiencing them; a person may only know if informed by her healthcare provider. People may also not always accurately recall the specific time they received a particular test. Additionally, cancer screening is looking for cancer before a person has symptoms, when they are not known to have had that specific cancer type before. Looking for new or recurrent asymptomatic cancer in a person previously diagnosed and treated for that cancer type represents a different type of testing known as surveillance testing. Finally, guidelines for cervical cancer screening have increased in complexity over time, which results in a greater likelihood for missing or incomplete self-reported information about the screening tests women received. Different approaches by researchers for handling this missing information can result in somewhat varied estimates presented for up-to-date cervical cancer screening status, depending on publication.
Our measure captures any type of cervical cancer screening received by a woman, and the population may include those with a prior diagnosis of cervical cancer. It is a reasonable approximation of the true U.S. cervical cancer screening rate, but it is not perfectly comparing the actual frequency of women’s use of specific cervical cancer screening tests to national recommendations.
Even though the National Health Interview Survey cervical cancer screening measures have limitations, it is the best nationally representative data we have available to assess cervical cancer screening rates. It is frequently used by governmental and other organizations to track screening use over time in the U.S.
Data Source
Centers for Disease Control and Prevention, National Center for Health Statistics, National Health Interview Survey, 1987–2023.
Refer to the Data Sources page for more information about data collection years 2019+.
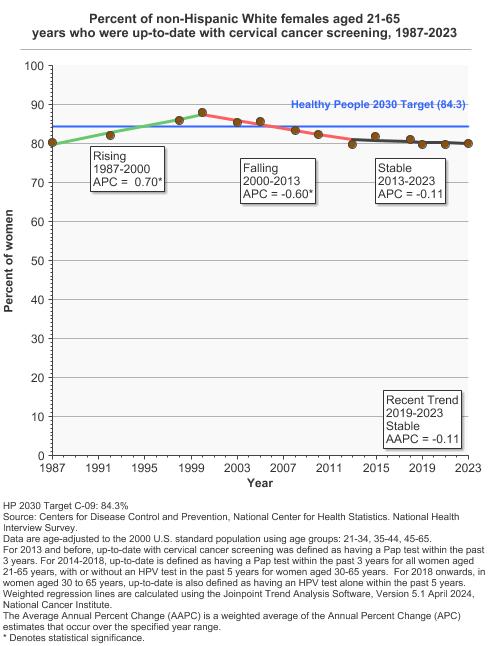
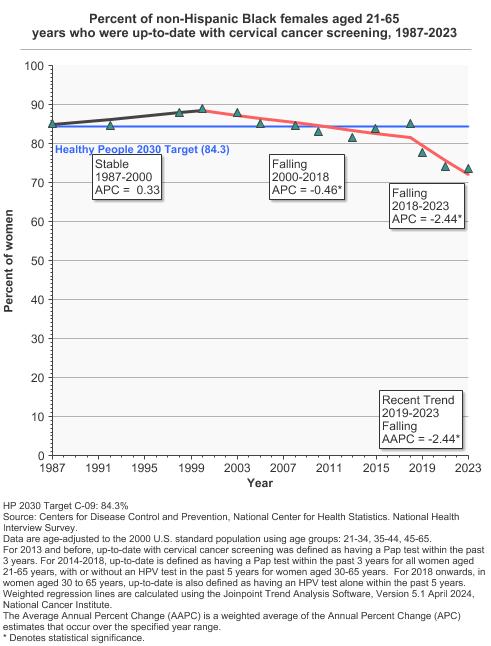
Healthy People 2030 Target
- Increase to 84.3 percent the proportion of women aged 21 to 65 years who received cervical cancer screening based on the most recent guidelines.
Healthy People 2030 is a set of goals set forth by the Department of Health and Human Services.
Note: Goals are indicated as blue line on Detailed Trend Graphs.
Trends and Most Recent Estimates
- By Race/Ethnicity
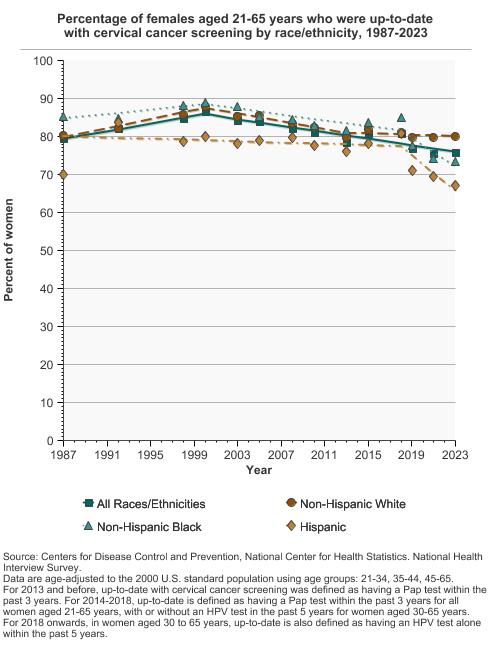
Percentage of females aged 21-65 years who were up-to-date with cervical cancer screening by race/ethnicity, 1987-2023 Overview Graph Detailed Trend Graphs Most Recent Estimates (2023) Percent of women 95% Confidence Interval 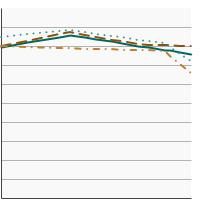

All Races/Ethnicities 
75.8 74.5 - 77.0 Non-Hispanic White 80.1 78.7 - 81.5 Non-Hispanic Black 73.5 69.8 - 76.9 Hispanic 67.2 64.4 - 69.9 - By Poverty Income Level
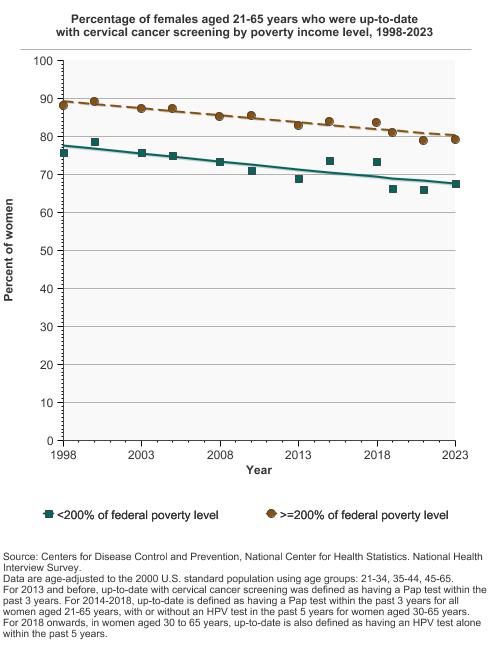
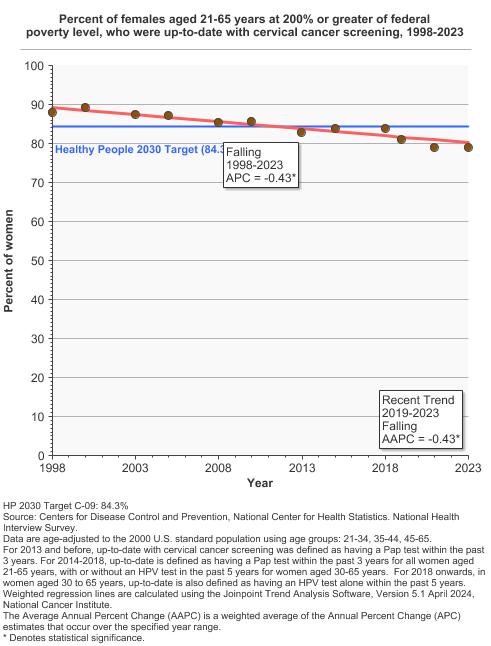
Percentage of females aged 21-65 years who were up-to-date with cervical cancer screening by poverty income level, 1998-2023 Overview Graph Detailed Trend Graphs Most Recent Estimates (2023) Percent of women 95% Confidence Interval 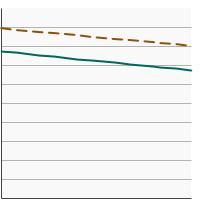
<200% of federal poverty level 67.6 65.4 - 69.8 >=200% of federal poverty level 79.1 77.6 - 80.5 - By Education Level
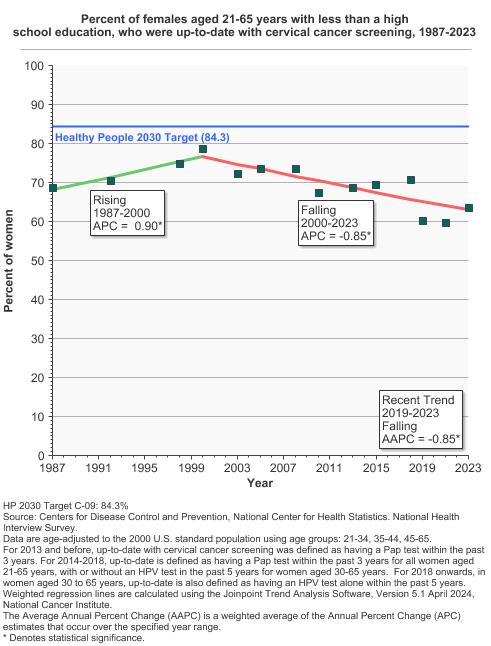
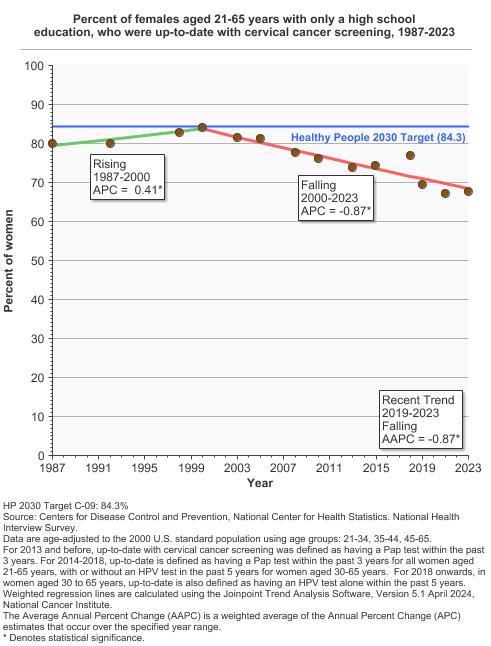
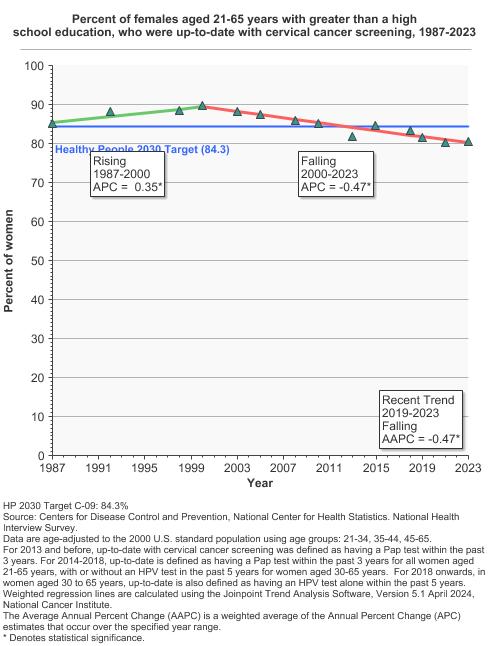
Percentage of females aged 21-65 years who were up-to-date with cervical cancer screening by highest level of education obtained, 1987-2023 Overview Graph Detailed Trend Graphs Most Recent Estimates (2023) Percent of women 95% Confidence Interval 
Less than High School 63.5 58.6 - 68.2 High School 67.7 65.1 - 70.2 Greater than High School 80.4 79.1 - 81.7


Additional Information
- Cervical Cancer Screening. National Cancer Institute.
- HPV and Pap Test Results: Next Steps after an Abnormal Cervical Cancer Screening Test. National Cancer Institute.
- Medicare Coverage for Cancer Prevention and Early Detection. American Cancer Society.
- Screening for Cervical Cancer. Centers for Disease Control and Prevention.
- National Breast and Cervical Cancer Early Detection Program. Centers for Disease Control and Prevention.
- Cervical Cancer Screening (PDQ®)-Health Professional Version. National Cancer Institute.
- Cervical Cancer Prevention (PDQ®)-Health Professional Version. National Cancer Institute.
- Cervical Cancer: Screening. U.S. Preventive Services Task Force.
- Impact of COVID-19-related care disruptions on cervical cancer screening in the United States. Burger EA, Jansen EE, Killen J, et al. J Med Screen. 2021 Jun;28(2):213-216.
- Self-Sampling as a Plausible Alternative to Screen Cervical Cancer Precursor Lesions in a Population with Low Adherence to Screening: A Systematic Review. Caleia AI, Pires C, Pereira JF, et al. 2020;64(4):332-343.
- Cervical cancer screening research in the PROSPR I consortium: Rationale, methods and baseline findings from a US cohort. Kamineni A, Tiro J, Beaber EF, et al. Int J Cancer. 2019; 144(6):1460-73.
- Screening for Cervical Cancer with High-Risk Human Papillomavirus Testing: Updated Evidence Report and Systematic Review for the US Preventive Services Task Force. Melnikow J, Henderson JT, Burda BU, et al. JAMA. 2018;320(7): 687-705.
- Strategies to Increase Cervical Cancer Screening With Mailed Human Papillomavirus Self-Sampling Kits: A Randomized Clinical Trial. Winer RL, Lin J, Anderson ML, et al. JAMA. 2023;330 (20):1971-1981.
- Health Information National Trends Survey. National Cancer Institute.
- SEER Cancer Stat Facts: Cervical Cancer. National Cancer Institute.
- Behavioral Risk Factor Surveillance System: Prevalence Data & Data Analysis Tools. Centers for Disease Control and Prevention, National Center for Chronic Disease Prevention and Health Promotion.