On This Page:
- Background
- Measure
- Healthy People 2030 Target
- Data Source
- Trends and Most Recent Estimates
- Additional Information
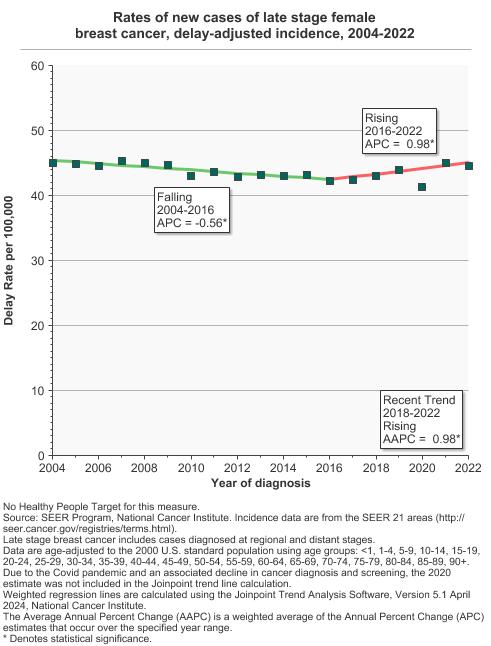
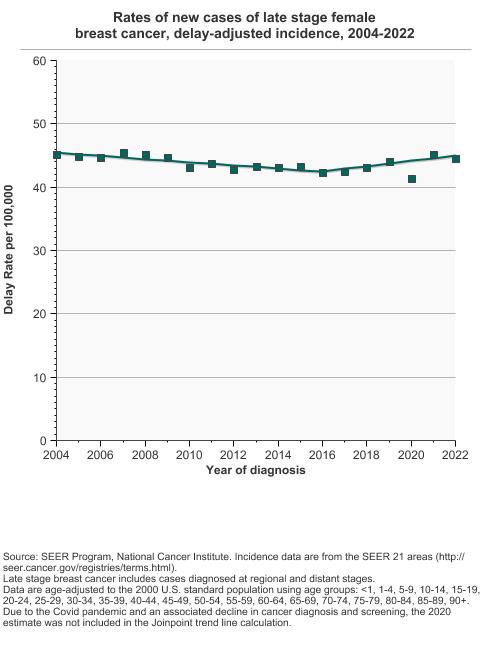
In 2022, the rate of new regional and distant stage female breast cancer cases was 44.6 per 100,000 females.
Background
Cancers can be diagnosed at different stages in their development. Stage of cancer diagnosis may be expressed as numbers (for example, I, II, III, or IV) or by terms such as “localized,” “regional,” and “distant.” The lower the number or the more localized the cancer, the better a person’s chances of benefiting from treatment.
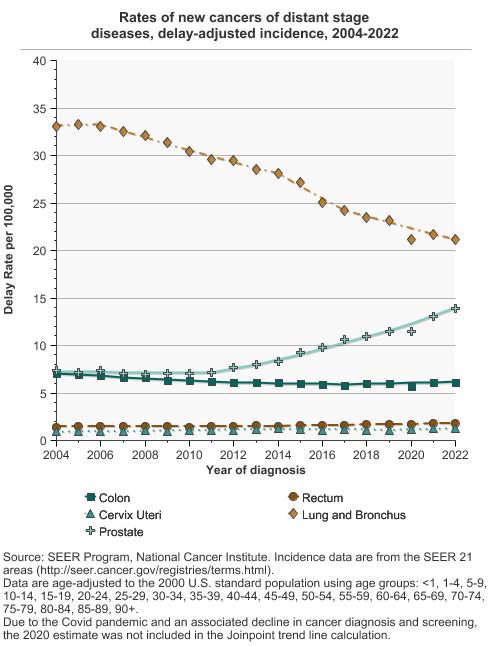
Tracking the rates of late-stage (distant) cancers is a good way to monitor the impact of cancer screening. When more cancers are detected in early stages, fewer should be detected in late stages.
Both rates of late stage disease and stage proportions are provided below since each has a somewhat different interpretation. For example, rates could be declining among all stages of disease, but the proportion of late stage disease among diagnosed cases could be relatively constant.
Measure
Late-stage diagnosis rate: The number of new cancer cases diagnosed at a distant stage per 100,000 people per year for cancers of the prostate, lung and bronchus, colon, rectum, and cervix uteri. Late stage is defined as regional and distant stage diagnoses, per 100,000 women per year for cancer of the female breast. Late stage is defined as the stages which screening tends to reduce and differs by cancer site (i.e. when screening is initiated the proportion diagnosed with late state disease goes down).
Stage Distribution: The proportion of new cancer cases among all cases diagnosed in a specific year. The full distribution of all stages (local, regional, distant and unstaged/unknown) is shown.
Trend lines: calculated from the underlying rates using the Joinpoint Trend Analysis Software.
The 2020 incidence rate is displayed but not used in the fit of the trends line(s). Impact of COVID on SEER Incidence 2020 data.
Data Source
SEER Program, National Cancer Institute, 2004–2022.
Healthy People 2030 Target
- There are no Healthy People Target for breast, colon, rectum, cervix uteri, lung and bronchus or prostate cancer by stage at diagnosis.
Healthy People 2030 is a set of goals set forth by the Department of Health and Human Services.
Trends and Most Recent Estimates
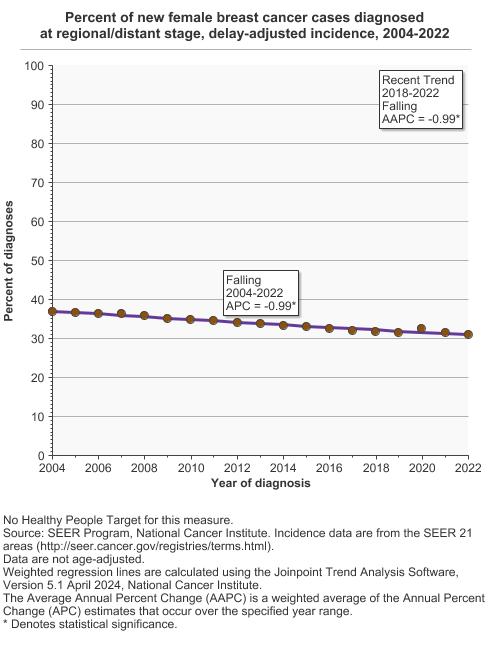
- Late Stage Female Breast Cancer Rates
Rates of new cases of late stage female breast cancer, delay-adjusted incidence, 2004-2022 Overview Graph Detailed Trend Graphs Most Recent Estimates (2022) Delay Rate per 100,000 95% Confidence Interval 

Late Stage Breast Cancer 
44.6 44.1 - 45.0 - Distant Stage Cancer Rates
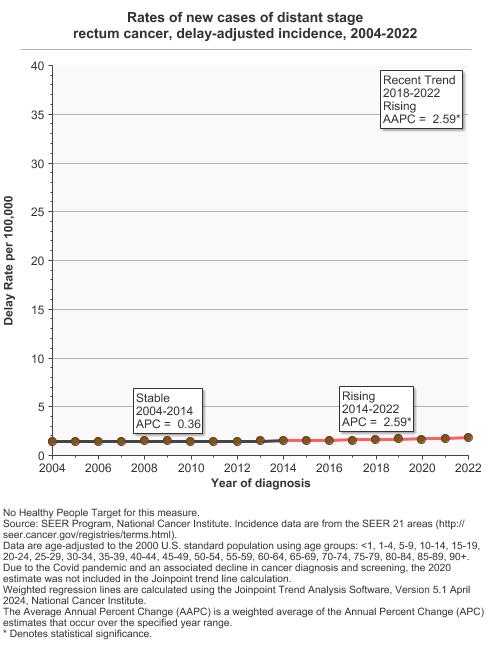
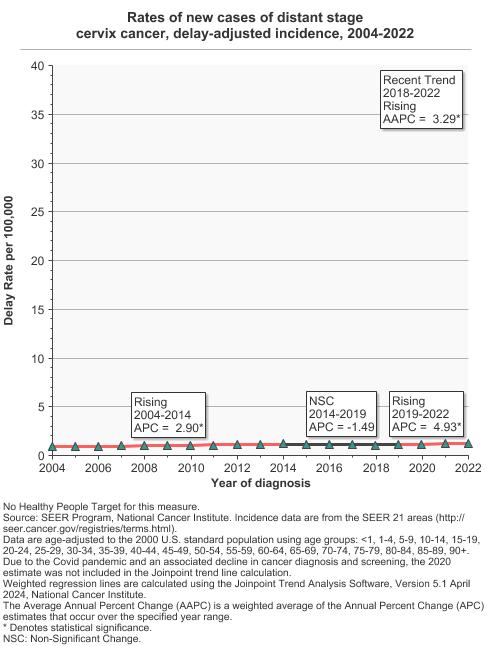
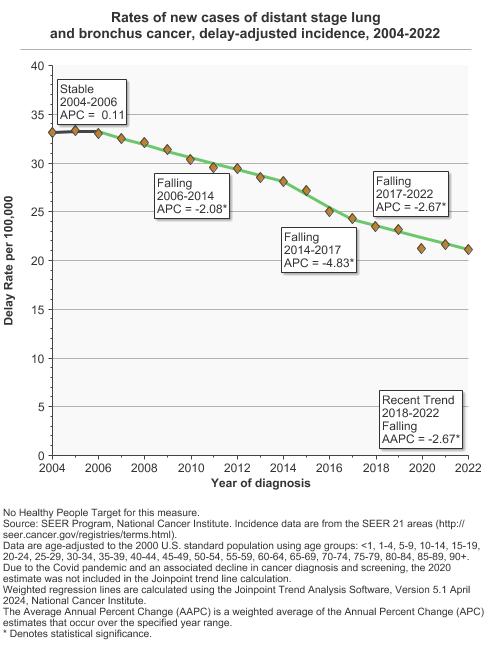
Rates of new cancers of distant stage diseases, delay-adjusted incidence, 2004-2022 Overview Graph Detailed Trend Graphs Most Recent Estimates (2022) Delay Rate per 100,000 95% Confidence Interval 
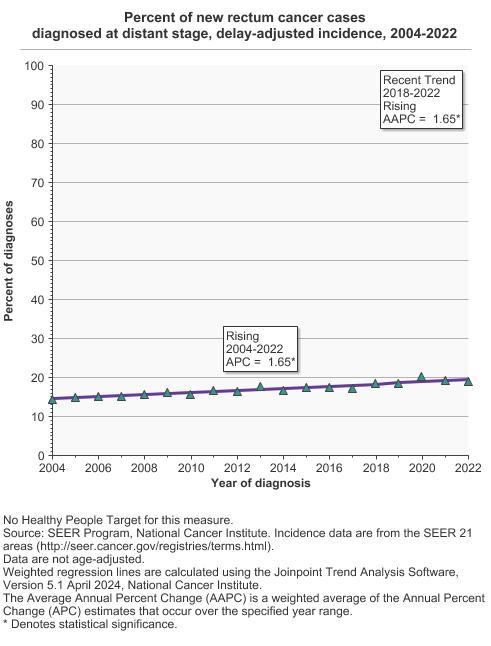
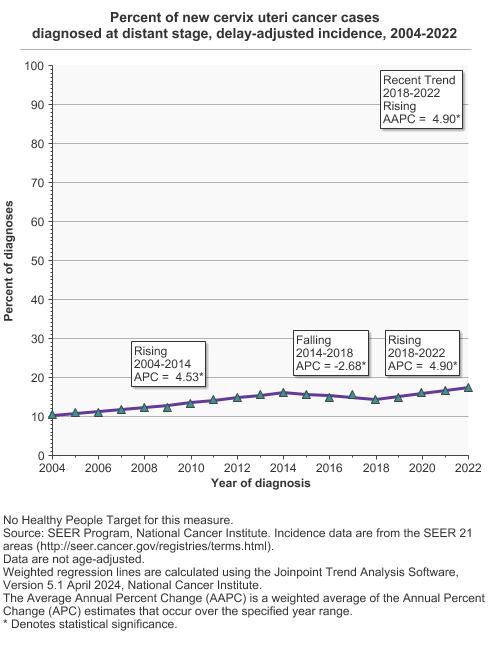
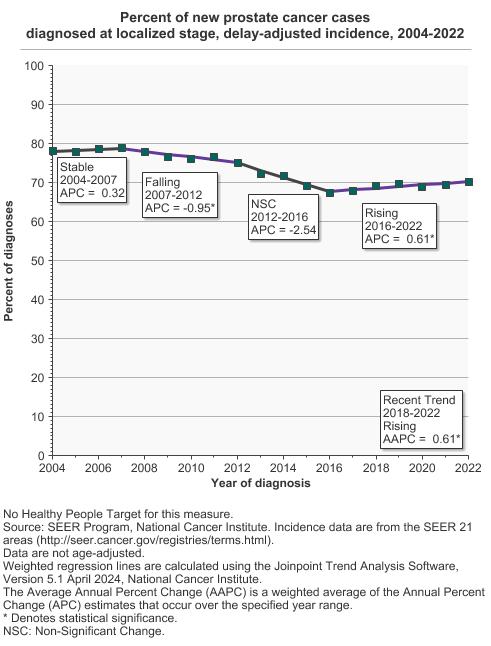
Colon 6.1 6.0 - 6.3 Rectum 1.8 1.8 - 1.9 Cervix Uteri 1.3 1.2 - 1.3 Lung and Bronchus 21.1 20.9 - 21.3 Prostate 13.9 13.6 - 14.1 - Stage Distribution
- Female Breast Cancer
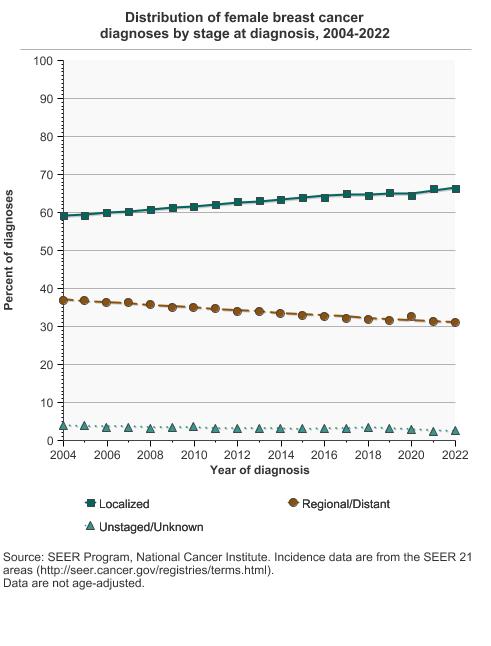
Distribution of female breast cancer diagnoses by stage at diagnosis, 2004-2022 Overview Graph Detailed Trend Graphs Most Recent Estimates (2022) Percent of diagnoses 95% Confidence Interval 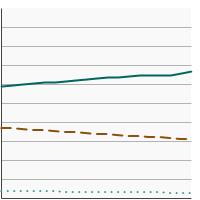
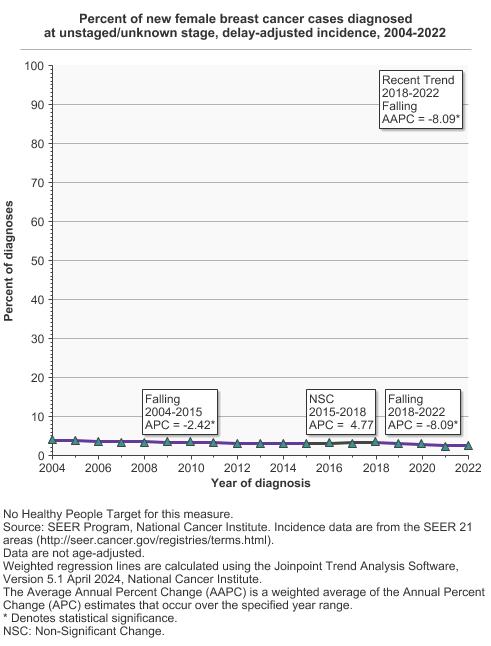
Localized 66.4 66.1 - 66.7 Regional/Distant 31.0 30.8 - 31.3 Unstaged/Unknown 2.6 2.5 - 2.7 - Lung Cancer
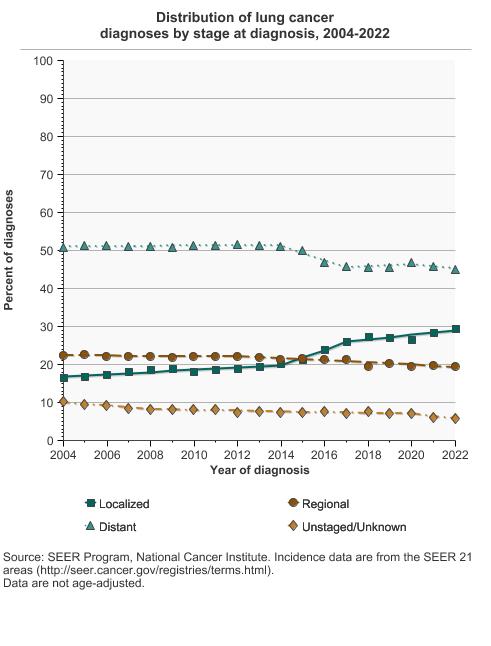
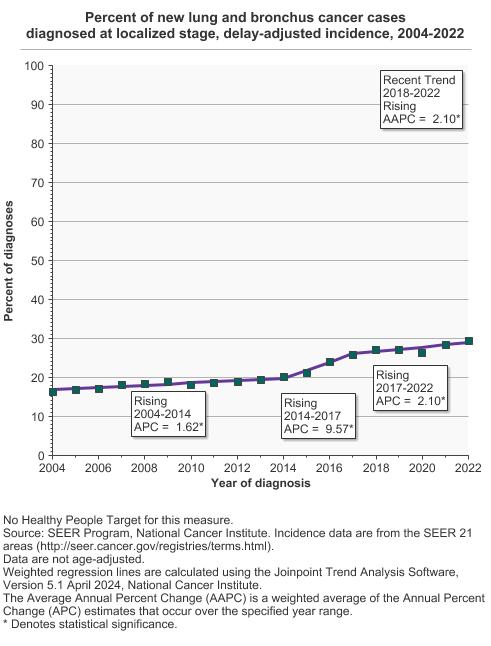
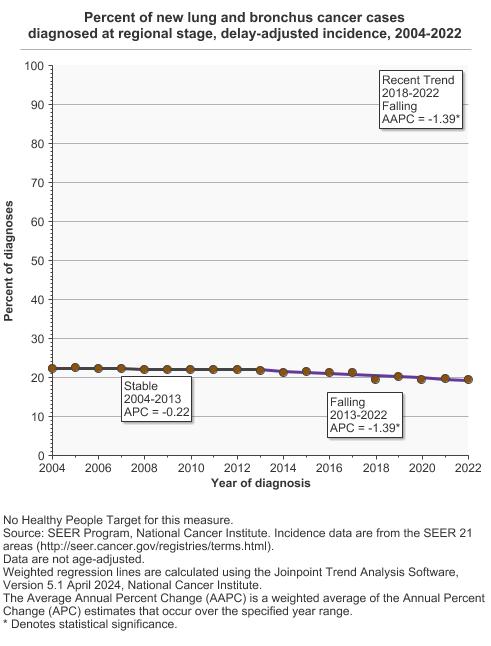
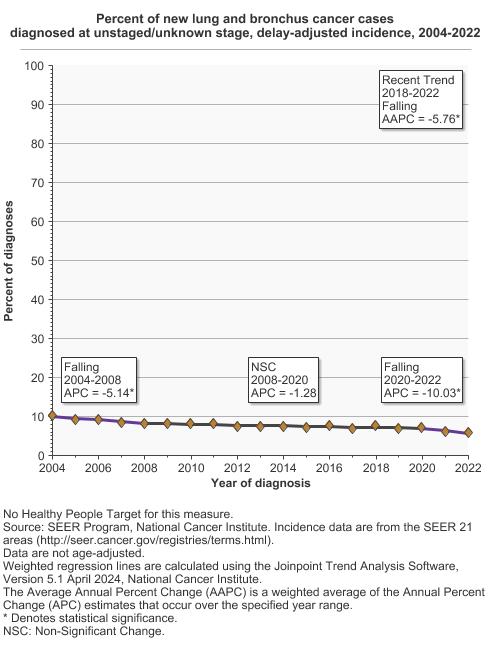
Distribution of lung cancer diagnoses by stage at diagnosis, 2004-2022 Overview Graph Detailed Trend Graphs Most Recent Estimates (2022) Percent of diagnoses 95% Confidence Interval 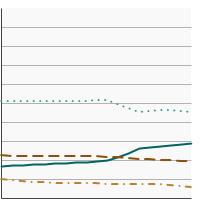
Localized 29.5 29.2 - 29.8 Regional 19.6 19.3 - 19.9 Distant 45.1 44.8 - 45.5 Unstaged/Unknown 5.8 5.6 - 6.0 - Colon Cancer
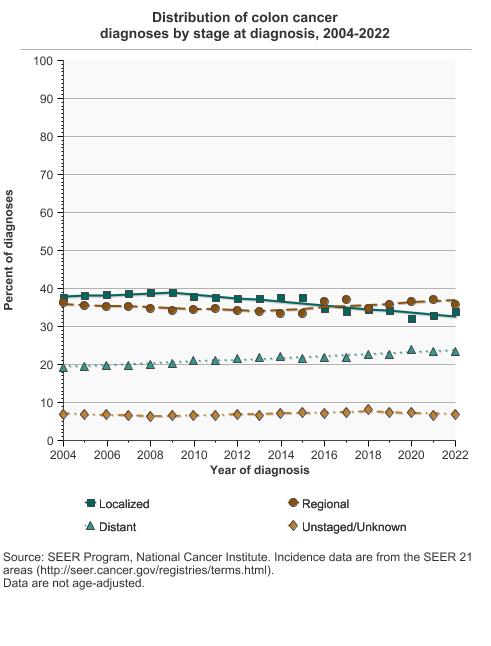
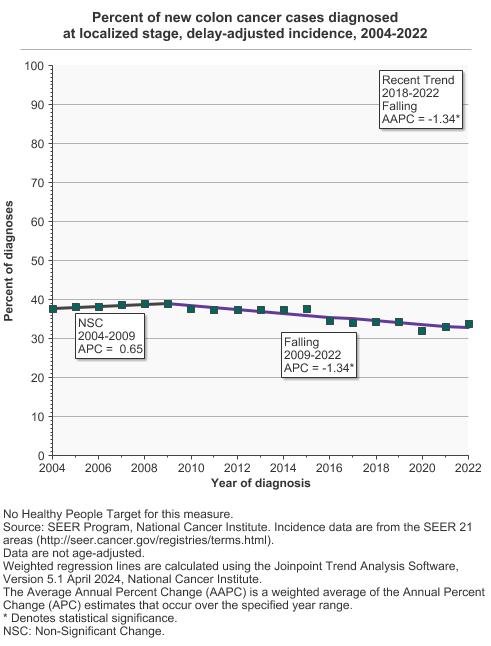
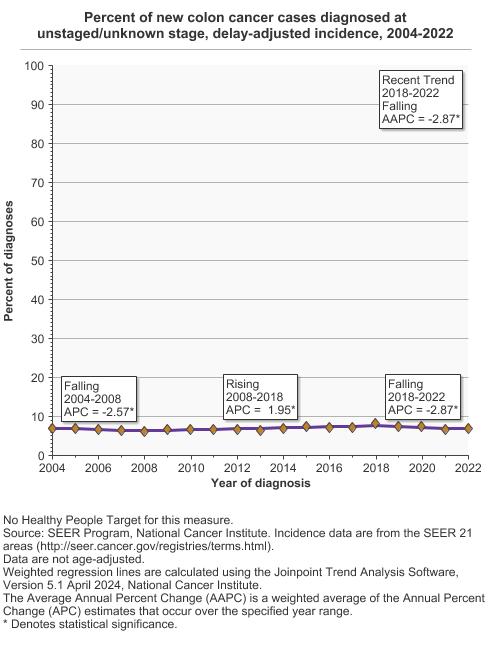
Distribution of colon cancer diagnoses by stage at diagnosis, 2004-2022 Overview Graph Detailed Trend Graphs Most Recent Estimates (2022) Percent of diagnoses 95% Confidence Interval 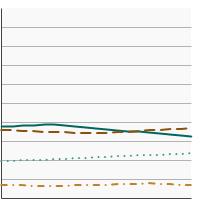
Localized 33.8 33.4 - 34.3 Regional 35.8 35.4 - 36.3 Distant 23.4 23.0 - 23.8 Unstaged/Unknown 7.0 6.7 - 7.2 - Rectum Cancer
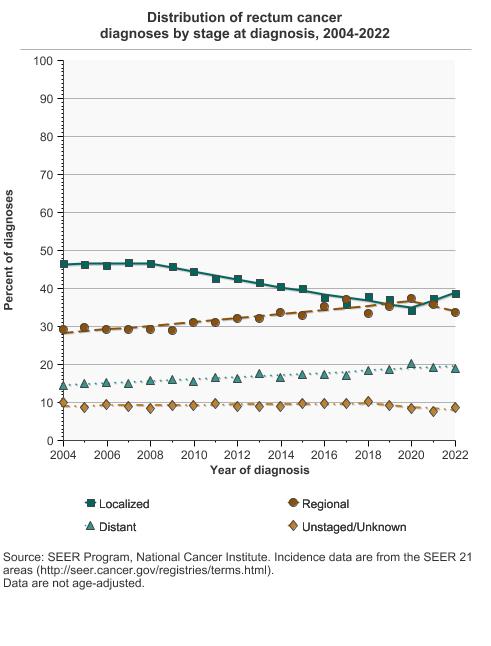
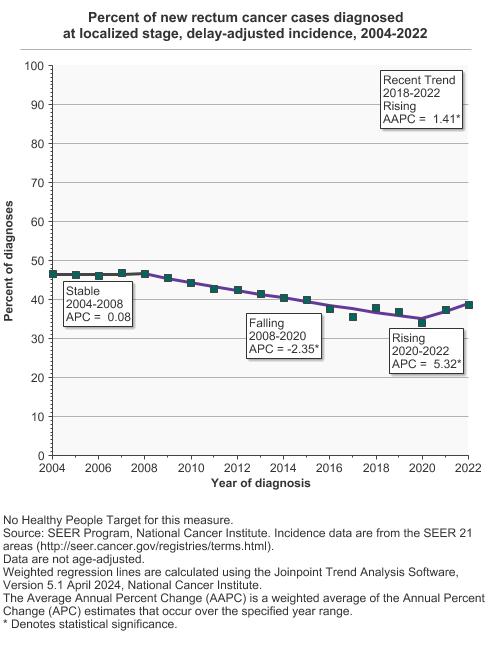
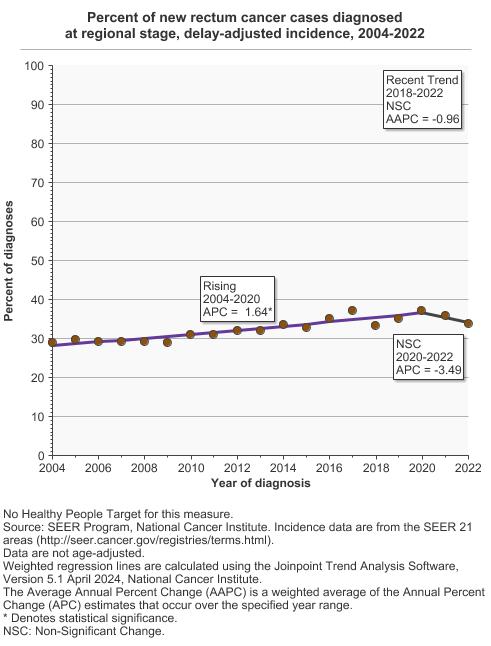
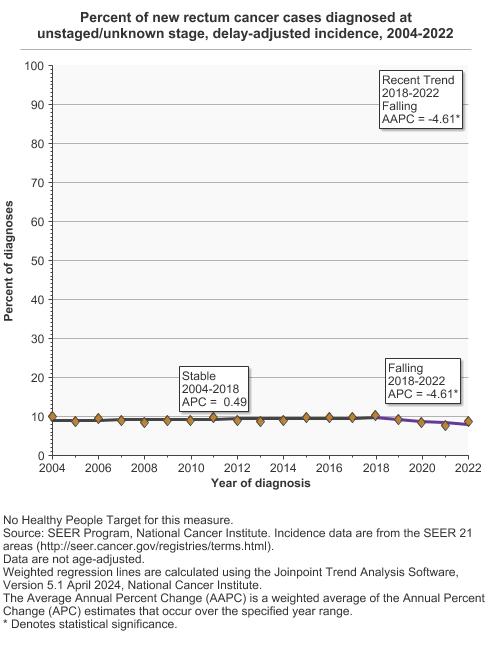
Distribution of rectum cancer diagnoses by stage at diagnosis, 2004-2022 Overview Graph Detailed Trend Graphs Most Recent Estimates (2022) Percent of diagnoses 95% Confidence Interval 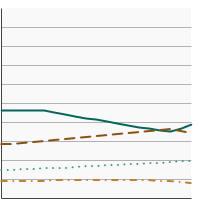
Localized 38.6 37.9 - 39.4 Regional 33.8 33.1 - 34.5 Distant 18.9 18.4 - 19.5 Unstaged/Unknown 8.6 8.2 - 9.1 - Cervix Uteri Cancer
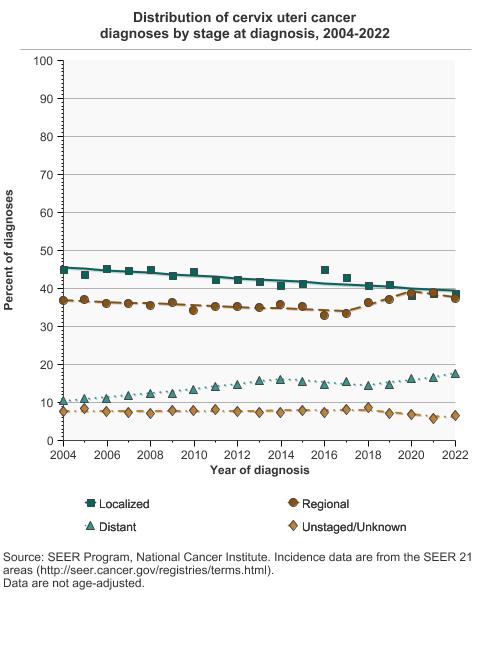
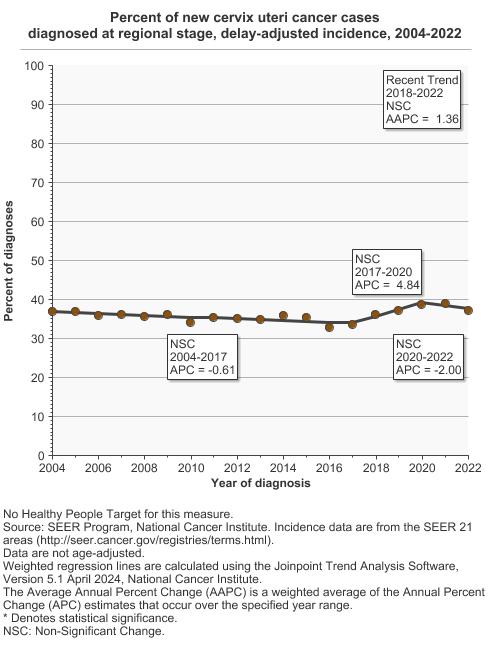
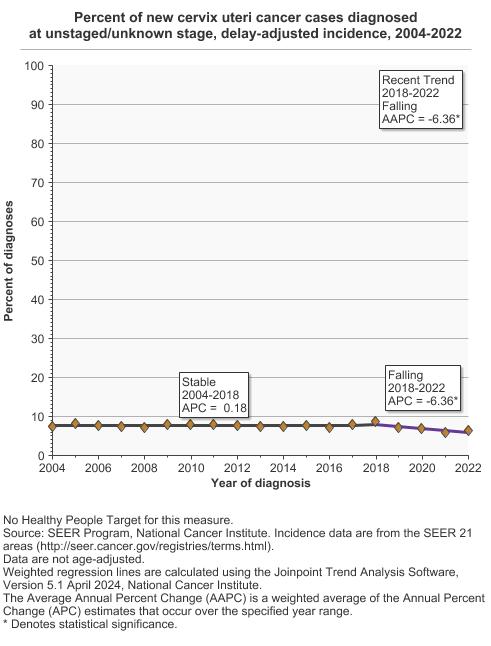
Distribution of cervix uteri cancer diagnoses by stage at diagnosis, 2004-2022 Overview Graph Detailed Trend Graphs Most Recent Estimates (2022) Percent of diagnoses 95% Confidence Interval 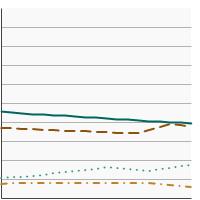
Localized 38.6 37.4 - 39.9 Regional 37.3 36.1 - 38.5 Distant 17.6 16.6 - 18.5 Unstaged/Unknown 6.5 5.9 - 7.1 - Prostate Cancer
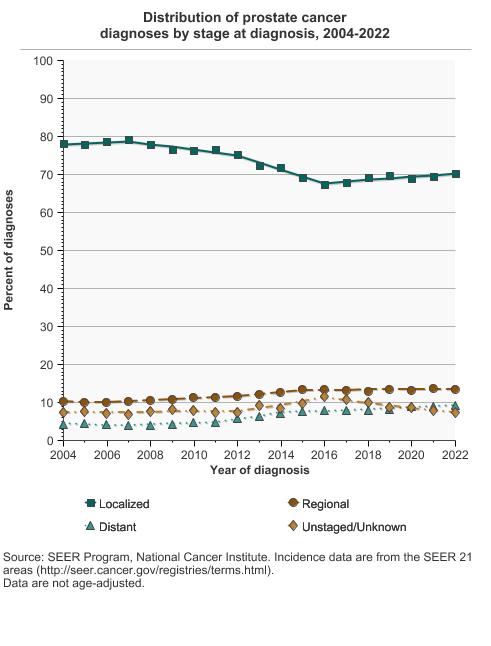
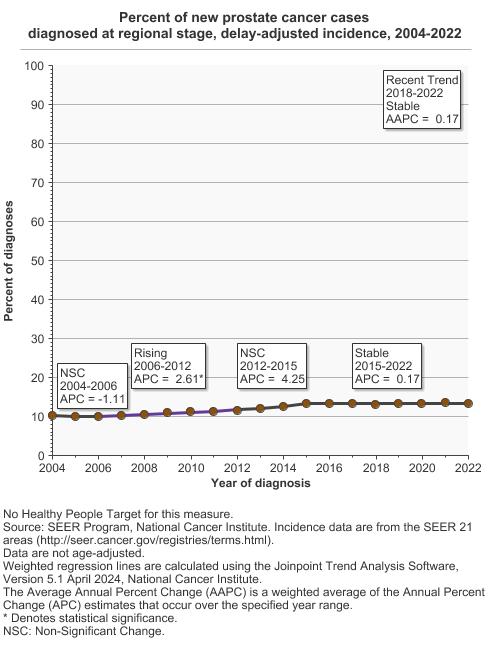
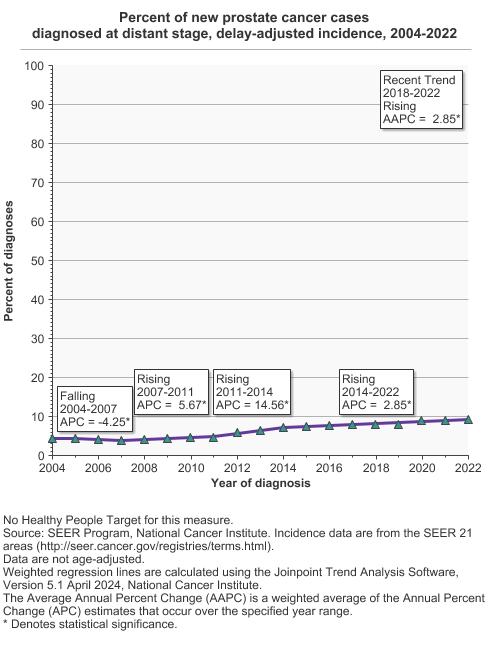
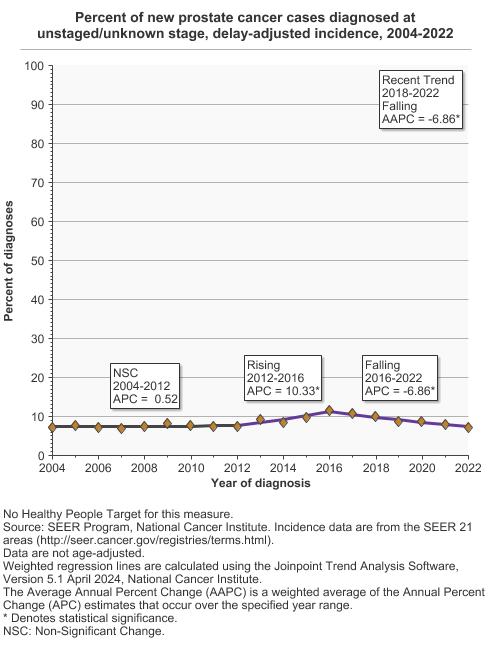
Distribution of prostate cancer diagnoses by stage at diagnosis, 2004-2022 Overview Graph Detailed Trend Graphs Most Recent Estimates (2022) Percent of diagnoses 95% Confidence Interval 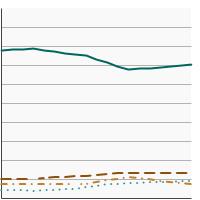
Localized 70.3 70.0 - 70.5 Regional 13.3 13.1 - 13.5 Distant 9.1 9.0 - 9.3 Unstaged/Unknown 7.3 7.1 - 7.4


Additional Information
- Cancer Staging. National Cancer Institute.
- Metastatic Cancer. National Cancer Institute.
- Tumor Grade. National Cancer Institute.
- Tumor Markers. National Cancer Institute.
- Understanding Laboratory Tests. National Cancer Institute.
- Staging. American Cancer Society.
- Resources for Health Professionals. National Cancer Institute.
- SEER Program Coding and Staging Manual 2018. National Cancer Institute.
- Annual Report to the Nation on the Status of Cancer. National Cancer Institute.
- SEER Cancer Stat Facts: Breast Cancer. National Cancer Institute.
- SEER Cancer Stat Facts: Cervix Uteri Cancer. National Cancer Institute.
- SEER Cancer Stat Facts: Colon and Rectum Cancer. National Cancer Institute.
- SEER Cancer Stat Facts: Lung and Bronchus Cancer. National Cancer Institute.
- SEER Cancer Stat Facts: Prostate Cancer. National Cancer Institute.