On This Page:
- Background
- Measure
- Healthy People 2030 Target
- Data Source
- Trends and Most Recent Estimates
- Additional Information
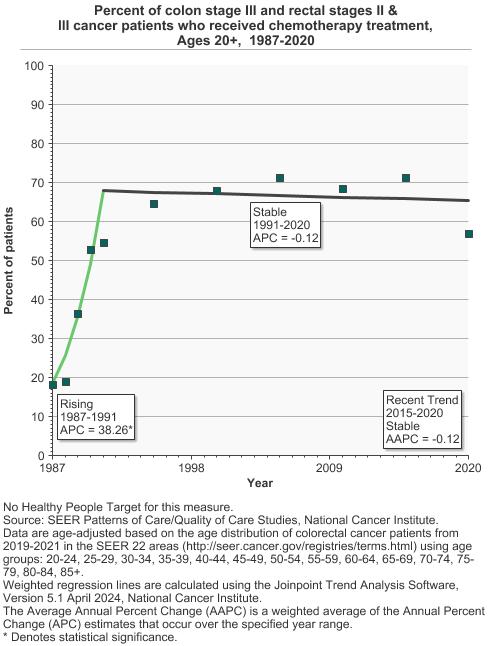
In 2020, 56.8% of stage III colon and stage II and III rectal patients received chemotherapy as part of their treatment strategy.
Background
Colon cancer forms in the tissues of the colon, which is the longest part of the large intestine. Rectal cancer forms in the tissues of the rectum, which is the last several inches of the large intestine closest to the anus.
The main types of treatment for colon and rectal cancer are surgery, radiation therapy, chemotherapy, immunotherapy, and targeted therapy. Depending on the stage of the cancer, two or more of these types of treatment may be combined at the same time or used one after another.
Surgery is the most common treatment for all stages of colorectal cancer. Radiation therapy uses high energy rays or particles to destroy cancer cells. Chemotherapy (used after surgery for stage III colon cancer and before or after surgery, often in conjunction with radiation therapy, for stages II and III rectal cancer) has been shown to help people with these cancers live longer.
Measure
Percent of individuals, aged 20 years and older, diagnosed with stage III colon cancer who received adjuvant chemotherapy or diagnosed with stage II or stage III rectal cancer who received chemotherapy with or without radiation therapy.
Data Source
SEER Patterns of Care/Quality of Care Studies, National Cancer Institute, 1987-2020.
Healthy People 2030 Target
- There are no Healthy People 2030 targets for cancer treatment, including colorectal cancer treatment.
Healthy People 2030 is a set of goals set forth by the Department of Health and Human Services.
Trends and Most Recent Estimates
- Chemotherapy Treatment
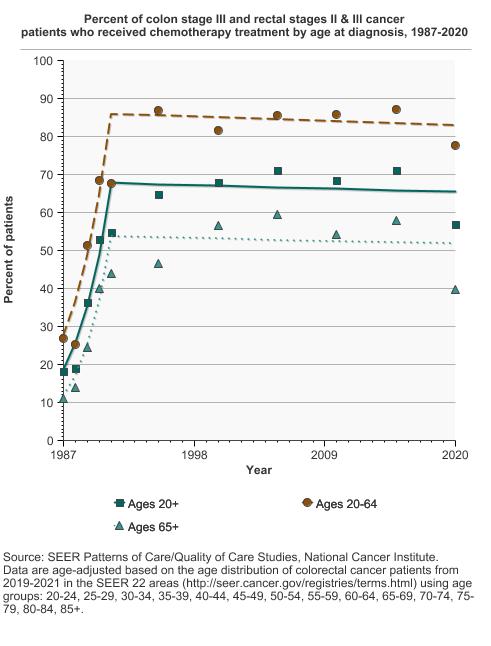
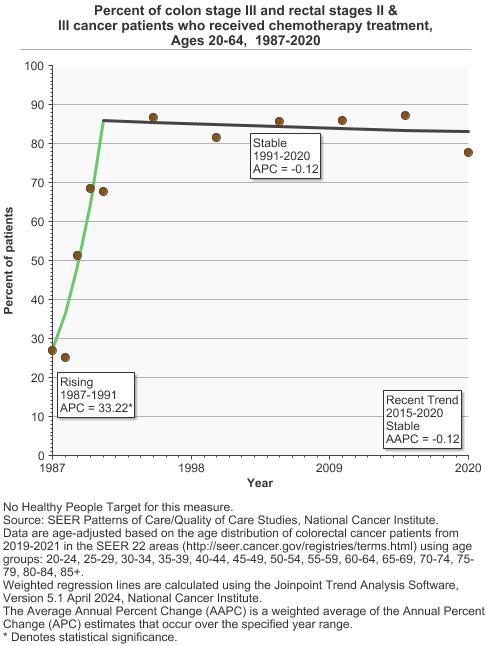
Percent of colon stage III and rectal stages II & III cancer patients who received chemotherapy treatment by age at diagnosis, 1987-2020 Overview Graph Detailed Trend Graphs Most Recent Estimates (2020) Percent of patients 95% Confidence Interval 

Ages 20+ 
56.8 53.3 - 60.3 Ages 20-64 77.6 72.9 - 81.7 Ages 65+ 39.6 34.6 - 44.9

Additional Information
- Colorectal Cancer. National Cancer Institute
- Colon Cancer Treatment (PDQ®)-Patient Version. National Cancer Institute.
- Rectal Cancer Treatment (PDQ®)-Patient Version. National Cancer Institute.
- Treating Colorectal Cancer. American Cancer Society.
- Colon Cancer (NCCN Guidelines for Patients®). National Comprehensive Cancer Network.
- Rectal Cancer (NCCN Guidelines for Patients®). National Comprehensive Cancer Network.
- Advances in Colorectal Cancer Research. National Cancer Institute.
- Colon Cancer Treatment (PDQ®)-Health Professional Version. National Cancer Institute.
- Rectal Cancer Treatment (PDQ®)-Health Professional Version. National Cancer Institute.
- SEER Cancer Stat Facts: Colorectal Cancer. National Cancer Institute.
- SEER-Medicare Linked Database. National Cancer Institute.
- SEER Patterns of Care/Quality of Care Studies. National Cancer Institute.
- Colorectal Cancer Mortality Projections. Cancer Intervention Surveillance Network.