On This Page:
- Background
- Measure
- Healthy People 2030 Target
- Data Source
- Trends and Most Recent Estimates
- Additional Information
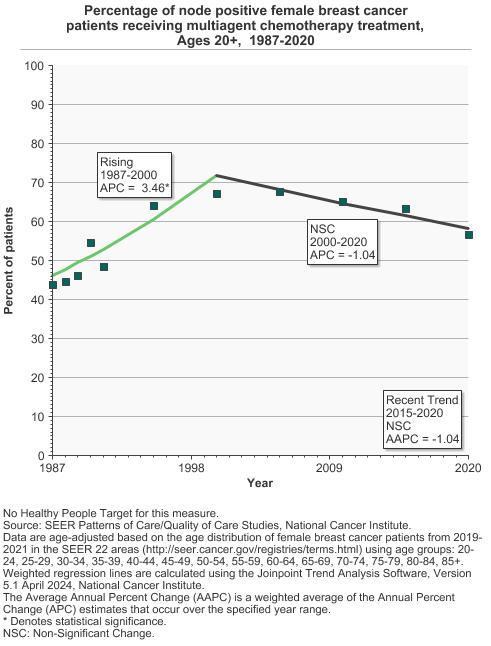
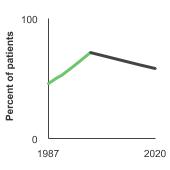
In 2020, 56.7% of women diagnosed with node positive breast cancer, received multi-agent chemotherapy.
Background
Breast cancer is the most common type of cancer among women in the United States (other than skin cancer). Women with breast cancer have many treatment options, including surgery, radiation therapy, hormone therapy, chemotherapy, immunotherapy, and targeted therapy. Treatment options for a woman diagnosed with breast cancer may include more than one type of treatment (ex. surgery and radiation) or more than one systemic agent (e.g., multi-agent chemotherapy).
Clinical trials have demonstrated that women with early-stage breast cancer who receive breast-conserving surgery (BCS) plus radiation therapy have a survival rate similar to those of women who undergo a mastectomy (removal of the whole breast). Among women for whom chemotherapy is indicated, older women are less likely to receive chemotherapy than younger women, but there are no major differences in treatment among major racial and ethnic groups.
Breast cancer also develops in men, but it is rare and is not included in the data presented on this page.
Measure
Percentage of women aged 20 and older, diagnosed with stage I or II breast cancer receiving breast-conserving surgery and radiation treatment.
Percentage of women aged 20 and older, diagnosed with node-positive, stage I–IIIA breast cancer, receiving multi-agent chemotherapy.
Note: This measure includes women with both hormone receptor positive and negative breast cancer.
Data Source
Breast-conserving surgery and radiation treatment estimates: SEER 22 Registries, National Cancer Institute, 2004–2021.
Multi-agent chemotherapy estimates: SEER Patterns of Care/Quality of Care Studies, National Cancer Institute, 1987-2020.
Healthy People 2030 Target
- There are no Healthy People 2030 targets for cancer treatment, including breast cancer treatment and multi-agent chemotherapy.
Healthy People 2030 is a set of goals set forth by the Department of Health and Human Services.
Trends and Most Recent Estimates
- Treatment Distribution
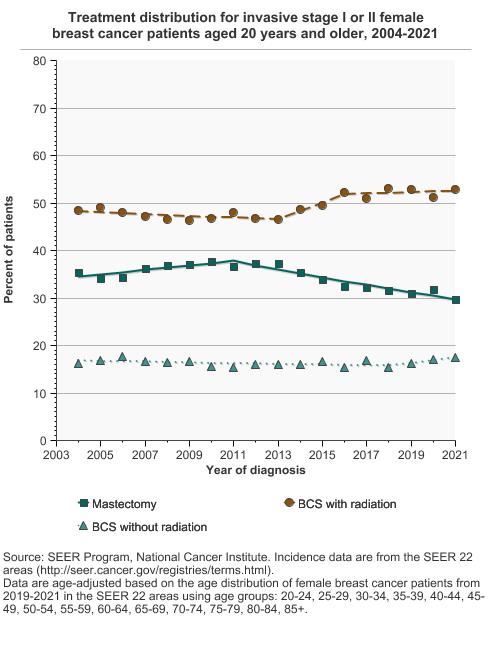
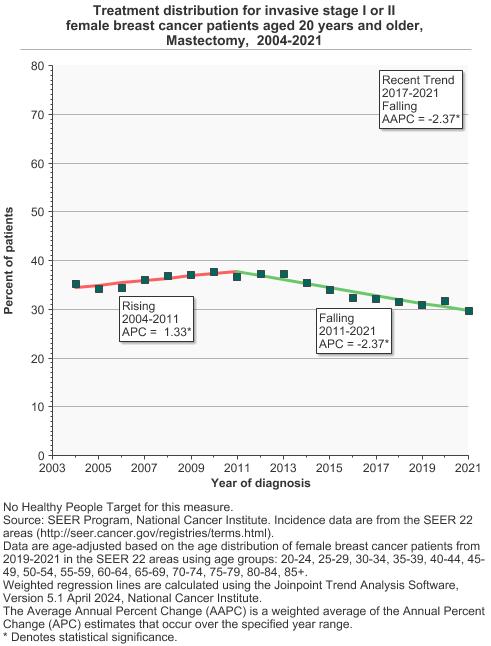
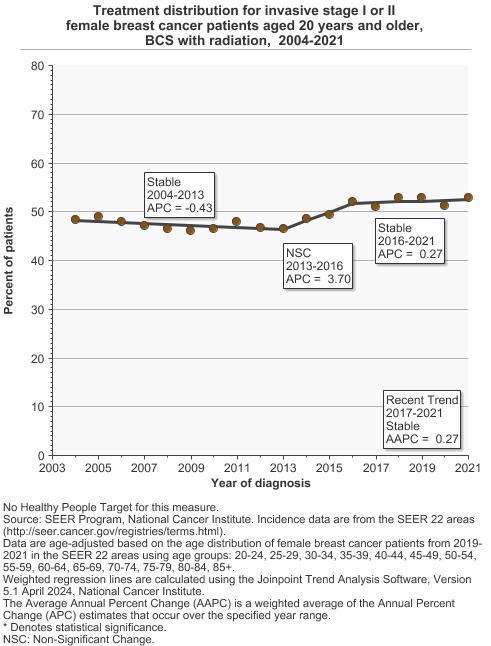
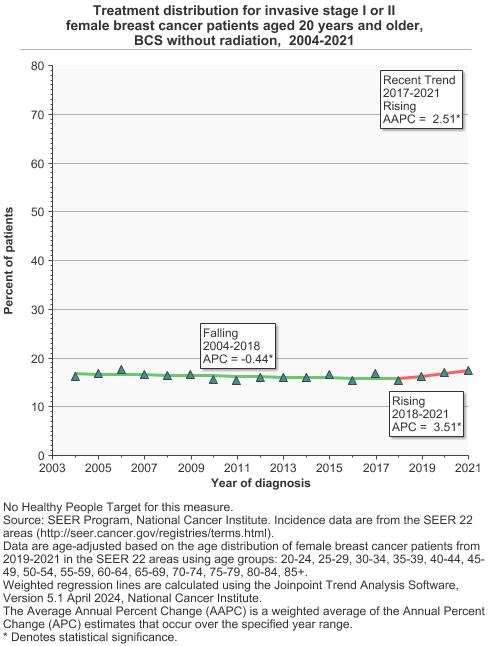
Treatment distribution for invasive stage I or II female breast cancer patients aged 20 years and older, 2004-2021 Overview Graph Detailed Trend Graphs Most Recent Estimates (2021) Percent of patients 95% Confidence Interval 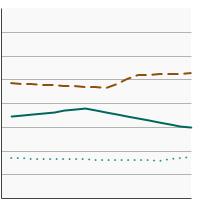

Mastectomy 
29.6 29.5 - 29.8 BCS with radiation 52.9 52.7 - 53.1 BCS without radiation 17.4 17.3 - 17.6 - Chemotherapy
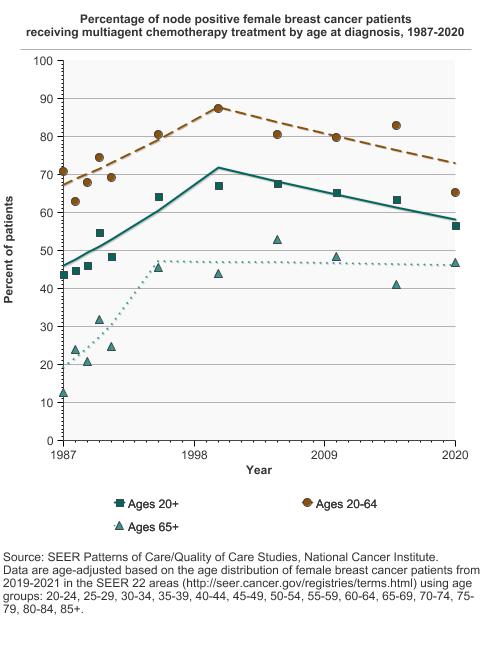
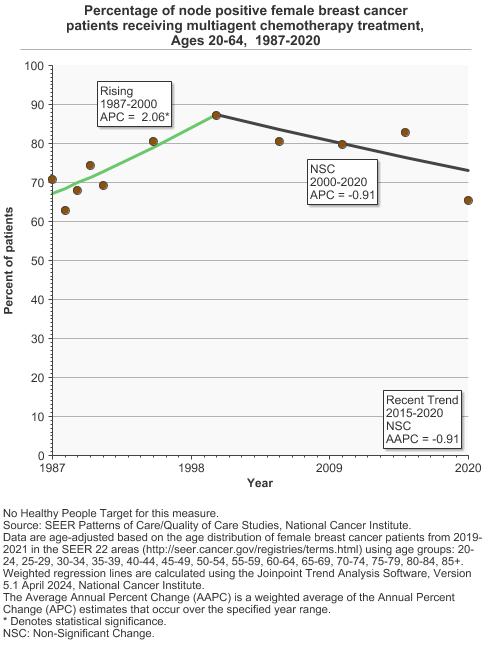
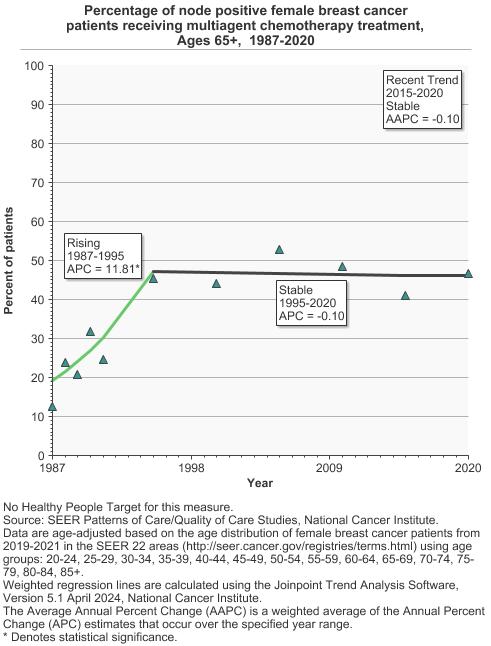
Percentage of node positive female breast cancer patients receiving multiagent chemotherapy treatment by age at diagnosis, 1987-2020 Overview Graph Detailed Trend Graphs Most Recent Estimates (2020) Percent of patients 95% Confidence Interval 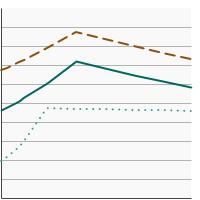
Ages 20+ 56.7 50.2 - 62.9 Ages 20-64 65.3 57.7 - 72.2 Ages 65+ 46.7 36.0 - 57.8
Additional Information
- Breast Cancer. National Cancer Institute.
- Breast Cancer Treatment (PDQ®)-Patient Version. National Cancer Institute.
- Breast Biopsy. American Cancer Society.
- Treating Breast Cancer. American Cancer Society.
- Breast Cancer (NCCN Guidelines for Patients®). National Comprehensive Cancer Network.
- Advances in Breast Cancer Research. National Cancer Institute.
- Breast Cancer Treatment (PDQ®)-Health Professional Version. National Cancer Institute.
- SEER Cancer Stat Facts: Breast Cancer. National Cancer Institute.
- SEER-Medicare Linked Database. National Cancer Institute.
- SEER Patterns of Care/Quality of Care Studies. National Cancer Institute.