On This Page:
- Background
- Measure
- Healthy People 2030 Target
- Data Source
- Trends and Most Recent Estimates
- Additional Information
Background
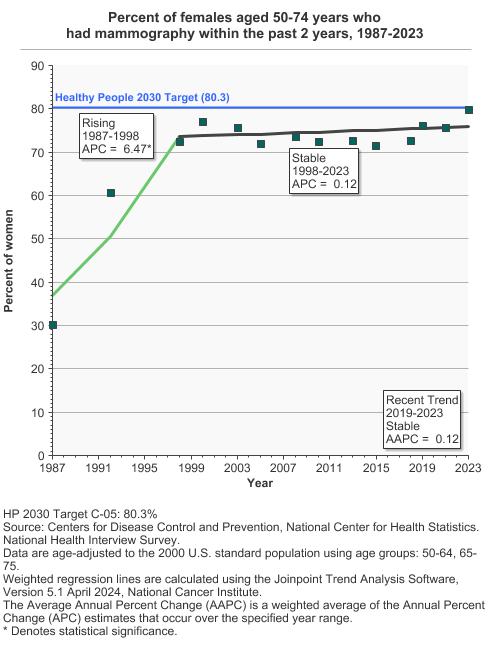
Mammography screening uses an x-ray of the breast to look for tumors in women who don’t have symptoms. This screening method allows for the earlier detection of breast cancer, which, when followed by timely treatment, can help reduce deaths due to the disease. In part because age is the most important risk factor for breast cancer, women aged 60 to 69 years are likely to derive the greatest absolute benefit from screening.
Until April 2024, the U.S. Preventive Services Task Force recommended that women aged 50 to 74 years receive a mammogram every 2 years, and that women aged 40 to 49 years make an individual decision regarding screening. The USPSTF has now dropped the age to begin screening to 40 years.
Measure
As the most current data on mammography usage is from 2023, we measure the percentage of women aged 50 to 74 years who reported having had a mammogram within the past 2 years, by race/ethnicity, income, and education level.
Measurement challenges
We track breast cancer screening rates in U.S. women using a large, national, in-person survey in which people are asked about their health behaviors and the medical care they receive (see Data Source, below). There are important limitations to this method that impact what information we can accurately collect and how confident we can be in the findings. Studies have found that certain types of healthcare survey questions can be difficult for people to clearly understand and answer, and it is easy for some questions to be misinterpreted.
In the case of breast cancer screening, it can be challenging to determine by self-report alone if a woman received a mammogram for the purposes of looking for asymptomatic, previously undetected cancer (i.e., for screening purposes), or to follow up on symptoms or suspicious findings from a prior test (i.e., for diagnostic purposes). Both tests appear similar to the patient experiencing them. Additionally, looking for new or recurrent asymptomatic cancer in a person previously diagnosed and treated for that cancer type represents a third type of testing known as surveillance testing. People may also not always accurately recall the specific time they received a particular test. Our measure captures receipt of a mammogram (yes/no) more accurately than its underlying purpose, and the population may include those with a prior diagnosis of breast cancer. This serves as a reasonable approximation, although an overestimate, of the true U.S. breast cancer screening rate.
Data Source
Centers for Disease Control and Prevention, National Center for Health Statistics, National Health Interview Survey, 1987–2023.
Refer to the Data Sources page for more information about data collection years 2019+.
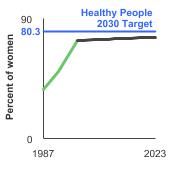
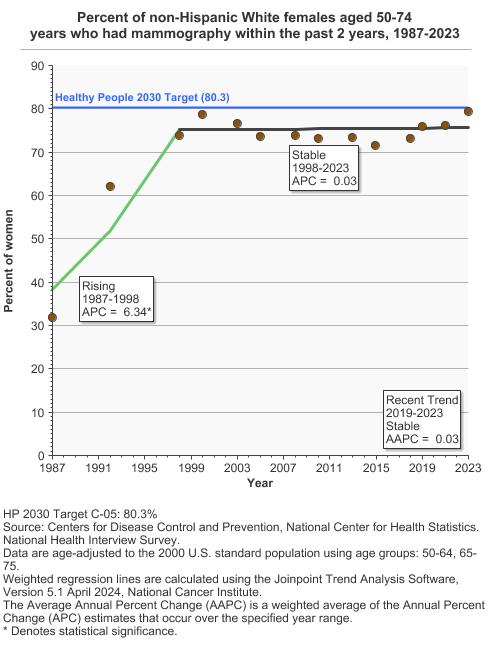
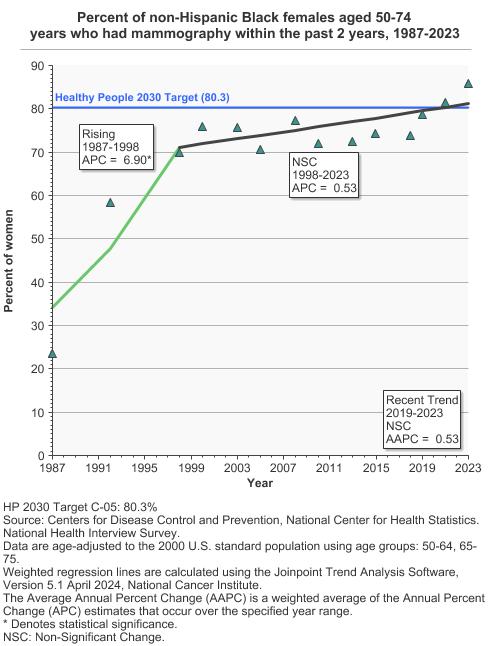
Healthy People 2030 Target
- Increase to 80.3 percent the proportion of women aged 50 to 74 years who have received a breast cancer screening based on the most recent guidelines.
Healthy People 2030 is a set of goals set forth by the Department of Health and Human Services.
Note: Goals are indicated as blue line on Detailed Trend Graphs.
Trends and Most Recent Estimates
- By Race/Ethnicity
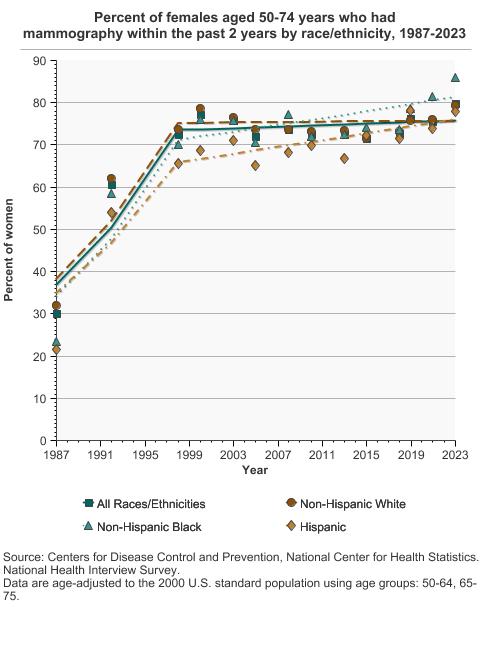
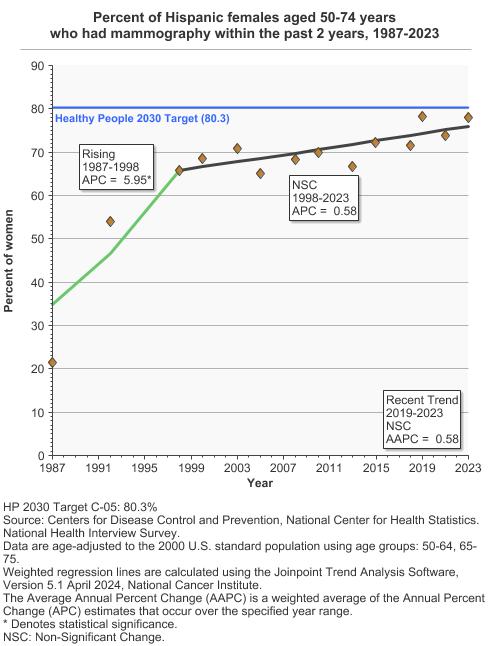
Percent of females aged 50-74 years who had mammography within the past 2 years by race/ethnicity, 1987-2023 Overview Graph Detailed Trend Graphs Most Recent Estimates (2023) Percent of women 95% Confidence Interval 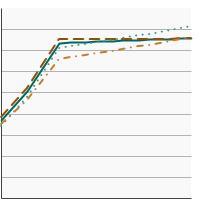

All Races/Ethnicities 
79.8 78.5 - 81.0 Non-Hispanic White 79.4 77.9 - 80.8 Non-Hispanic Black 85.9 82.5 - 88.6 Hispanic 78.0 74.2 - 81.4 - By Poverty Income Level
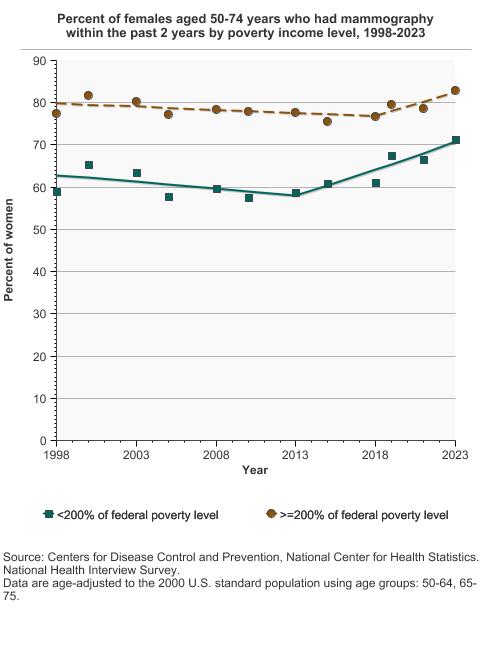
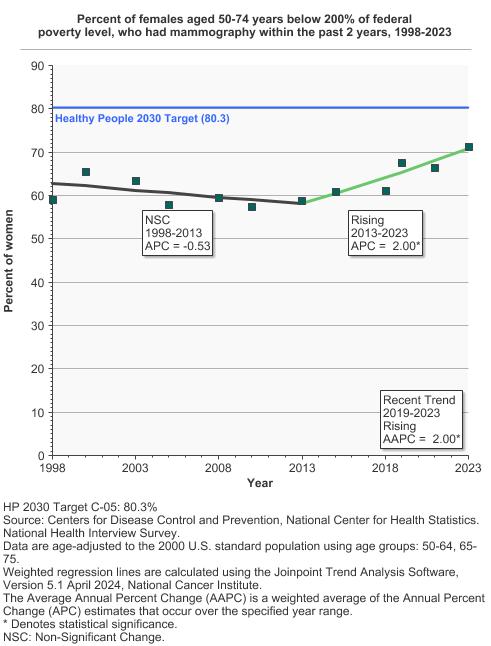
Percent of females aged 50-74 years who had mammography within the past 2 years by poverty income level, 1998-2023 Overview Graph Detailed Trend Graphs Most Recent Estimates (2023) Percent of women 95% Confidence Interval 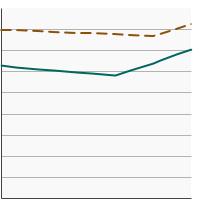
<200% of federal poverty level 71.3 68.5 - 73.9 >=200% of federal poverty level 83.0 81.6 - 84.3 - By Education Level
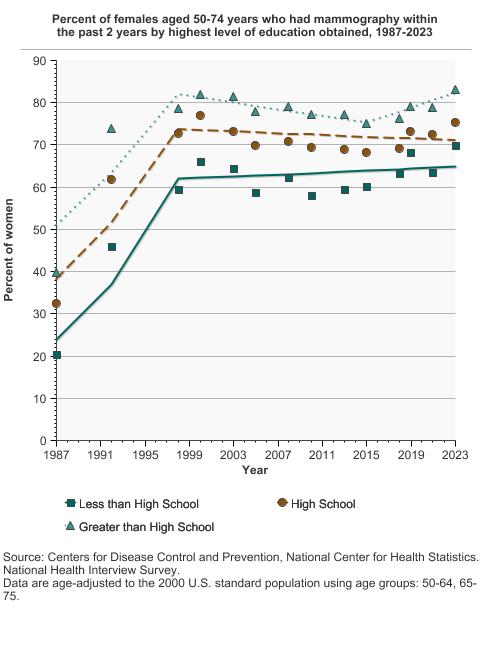
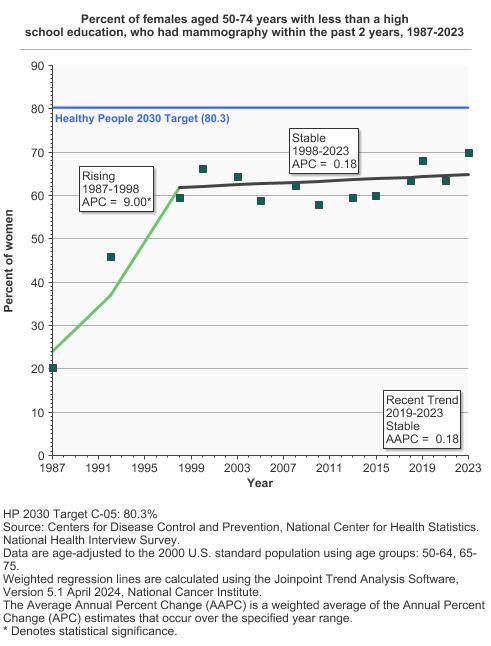
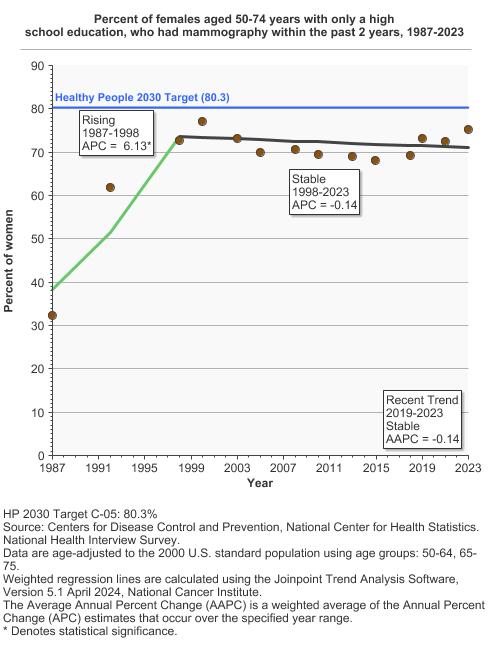
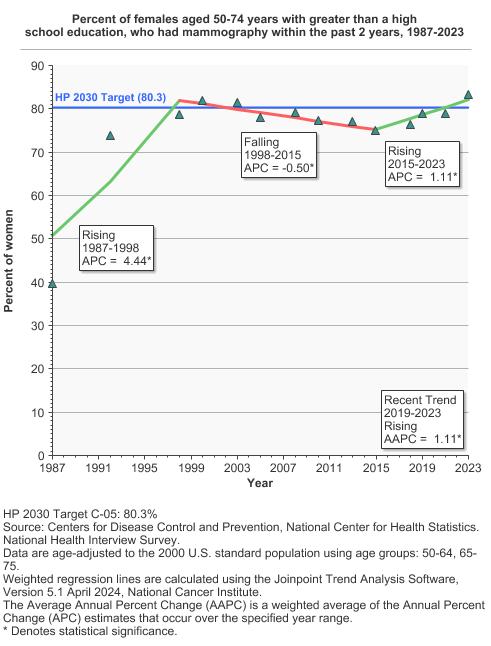
Percent of females aged 50-74 years who had mammography within the past 2 years by highest level of education obtained, 1987-2023 Overview Graph Detailed Trend Graphs Most Recent Estimates (2023) Percent of women 95% Confidence Interval 
Less than High School 69.9 65.2 - 74.2 High School 75.3 72.5 - 78.0 Greater than High School 83.2 81.9 - 84.5

Additional Information
- Breast Cancer Screening (PDQ®)-Patient Version. National Cancer Institute.
- Mammograms. National Cancer Institute.
- Medicare Coverage for Cancer Prevention and Early Detection. American Cancer Society.
- National Breast and Cervical Cancer Early Detection Program. Centers for Disease Control and Prevention.
- Screening for Breast Cancer. Centers for Disease Control and Prevention.
- Breast Cancer Screening (PDQ®)-Health Professional Version. National Cancer Institute.
- Breast Cancer: Screening. U.S. Preventive Services Task Force.
- Breast Cancer Surveillance Consortium (BCSC)
- Performance of Digital Breast Tomosynthesis, Synthetic Mammography, and Digital Mammography in Breast Cancer Screening: A Systematic Review and Meta-Analysis. Alabousi M, Wadera A, Kashif Al-Ghita M, et al. J Natl Cancer Inst. 2021;113(6):680-690.
- Screening for Breast Cancer: Evidence Report and Systematic Review for the US Preventive Services Task Force. Henderson JT, Webber EM, Weyrich MS, et al. JAMA. 2024;331(22): 1931-1946.
- Association of Screening With Digital Breast Tomosynthesis vs Digital Mammography With Risk of Interval Invasive and Advanced Breast Cancer. Kerlikowske K, Su Y-R, Sprague BL, et al. JAMA. 2022;327(22):2220-2230.
- Supplemental Screening as an Adjunct to Mammography for Breast Cancer Screening in People With Dense Breasts: A Health Technology Assessment. Schaink A, McMartin K, Higgins C, et al. Ont Health Technol Assess Ser. 2023;23(9):1-293.
- SEER Cancer Stat Facts: Female Breast Cancer. National Cancer Institute.
- Behavioral Risk Factor Surveillance System Prevalence Data & Analysis Tools. Centers for Disease Control and Prevention, National Center for Chronic Disease Prevention and Health Promotion.