On This Page:
- Background
- Measure
- Healthy People 2030 Target
- Data Source
- Trends and Most Recent Estimates
- Related Cancers
- Additional Information
Background
Consistent evidence indicates that preventing excess body weight and obesity reduces the risk of several types of cancer, including colorectal, breast (among women who have gone through menopause), uterine, esophageal, renal cell (kidney), liver, and pancreatic cancers.
Research has also identified an association between obesity and worse prognosis and outcomes among some cancer patients, particularly those with breast, prostate, liver, or colon cancer. Excess body weight is thought to contribute to as many as one in five cancer-related deaths in the United States.
Among children, obesity is linked to a higher risk for obesity, metabolic diseases, and other chronic diseases and conditions later in adulthood, including cancer risk.
While there is still much to be learned about the link between excess weight and cancer, people with overweight or obesity are encouraged to lose weight and maintain a healthy lifestyle. Doing so has the potential to reduce both cancer- and non-cancer-related morbidity.
Measure
Adults: The percentage of adults aged 20 years and older with a healthy weight, overweight, or obesity. These weight groups are defined by BMI, which is calculated by dividing weight in kilograms by height in meters squared. For most adults, experts consider a BMI within the range of 18.5 to 24.9 as healthy weight, a BMI between 25 and 29.9 as overweight, and a BMI of 30 and above as having obesity.
Children and adolescents: The percentage of children and adolescents aged 2-19 years with a healthy weight, overweight, or obesity. These weight groups are defined by a measurement called the body mass index (BMI) z-score, which is calculated based on BMI sex- and age-specific percentiles (from the CDC Growth Charts). For most children, experts consider BMI-for-age percentiles between 5-84% as healthy weight, between 85-94% as overweight, and 95% or above as having obesity.
Data Source
Centers for Disease Control and Prevention, National Center for Health Statistics, National Health and Nutrition Examination Survey (NHANES).
The NHANES 2017-2018 data point for the adult weight estimates were replaced with the NHANES 2017-March 2020 Pre-pandemic data point. More information is available at NHANES Questionnaires, Datasets, and Related Documentation.
Healthy People 2030 Target
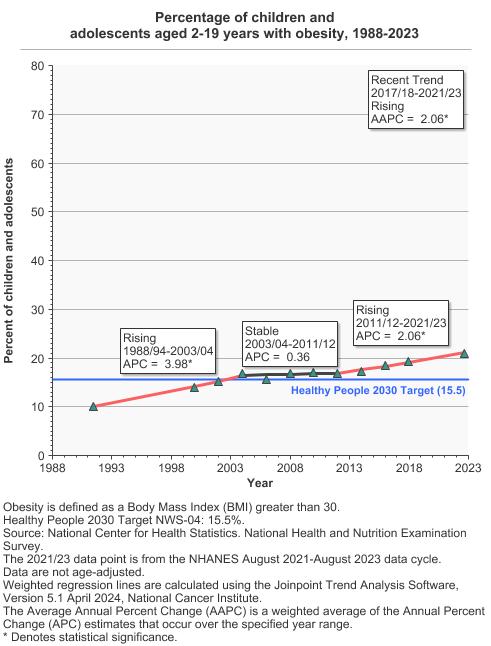
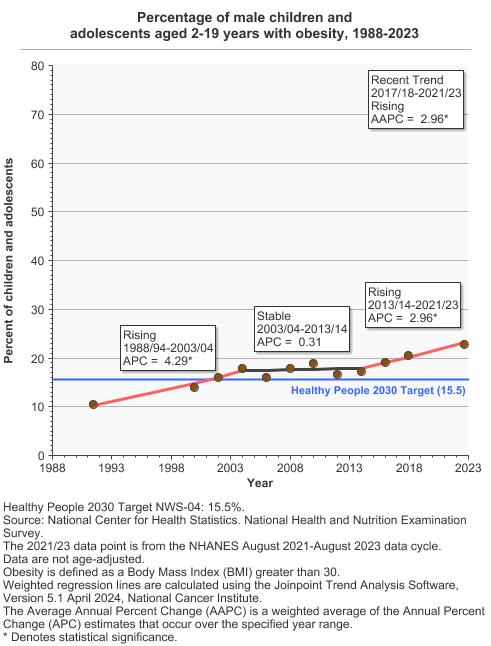
- Reduce the proportion of children and adolescents with obesity to 15.5 percent.
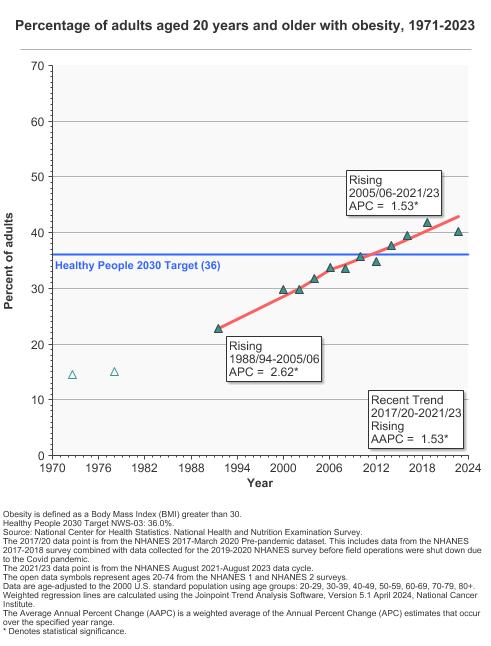
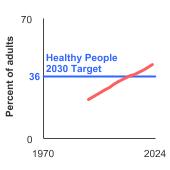
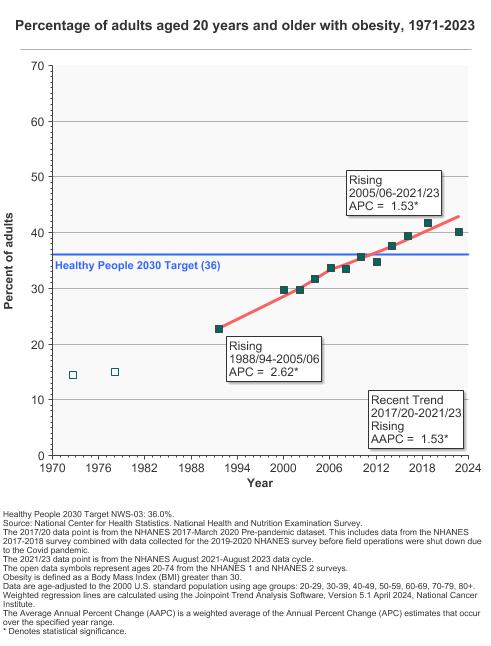
- Reduce the proportion of adults with obesity to 36.0 percent.
Healthy People 2030 is a set of goals set forth by the Department of Health and Human Services.
Note: Goals are indicated as blue line on Detailed Trend Graphs.
Trends and Most Recent Estimates
- Body Weight Comparison
- Children and Adolescents
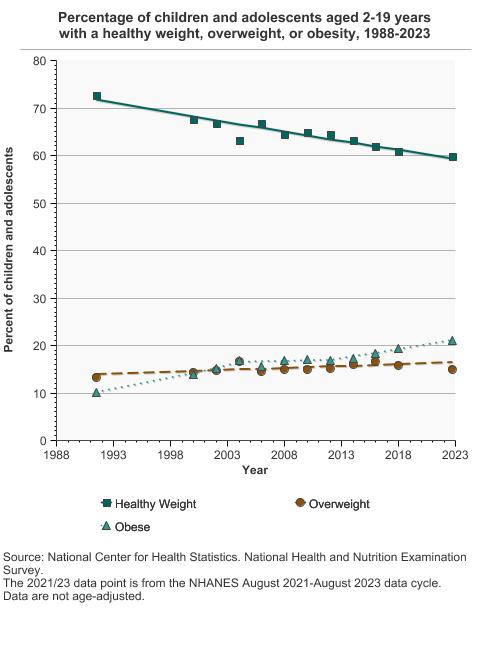
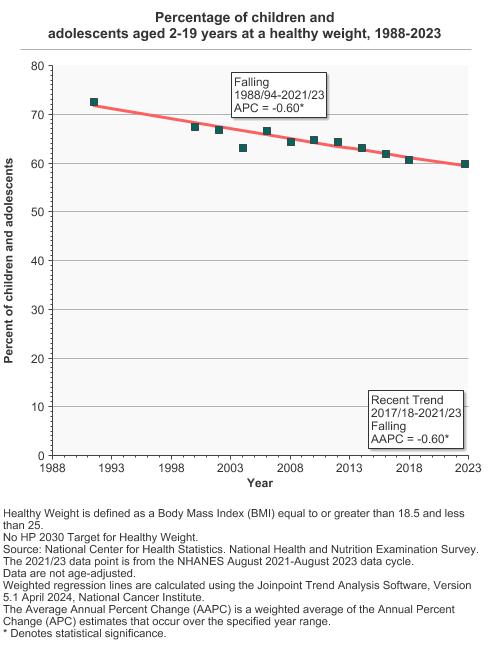
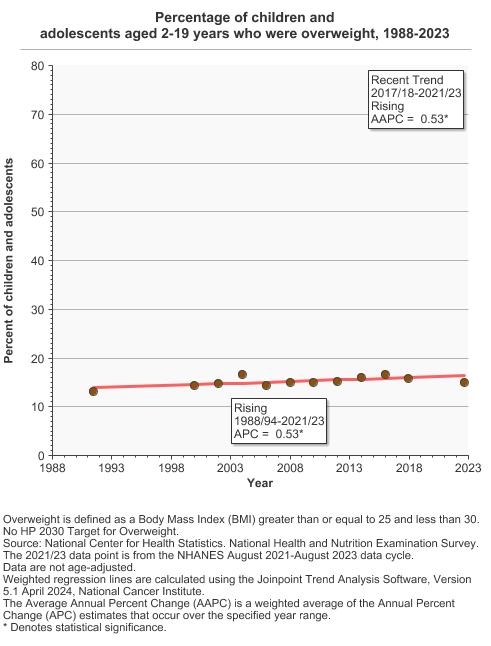
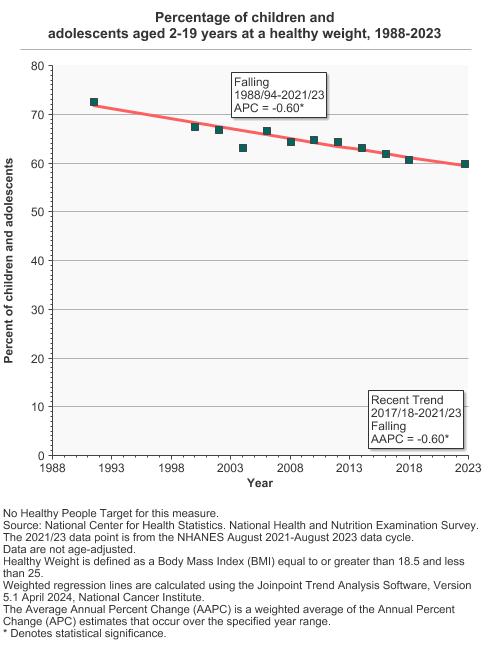
Percentage of children and adolescents aged 2-19 years with a healthy weight, overweight, or obesity, 1988-2023 Overview Graph Detailed Trend Graphs Most Recent Estimates (2021 to 2023) Percent of children and adolescents 95% Confidence Interval 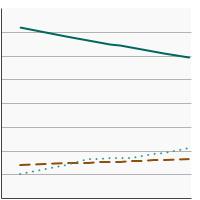

Healthy Weight 
59.9 57.3 - 62.4 Overweight 15.0 12.9 - 17.1 Obese 21.0 18.6 - 23.3 The 2021 to 2023 data point is from the NHANES August 2021-August 2023 data cycle. - Adults
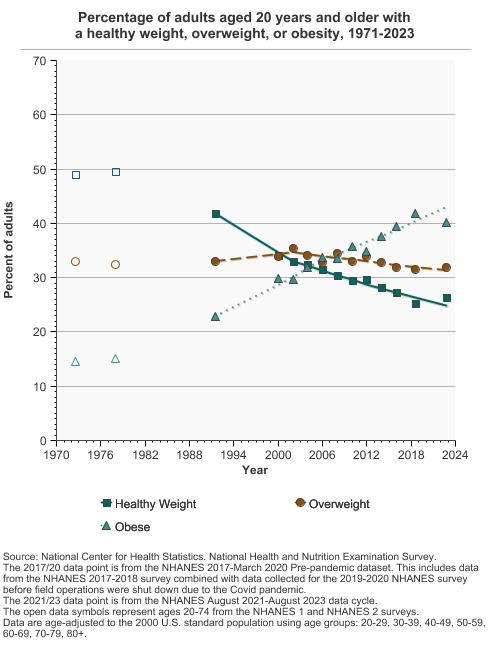
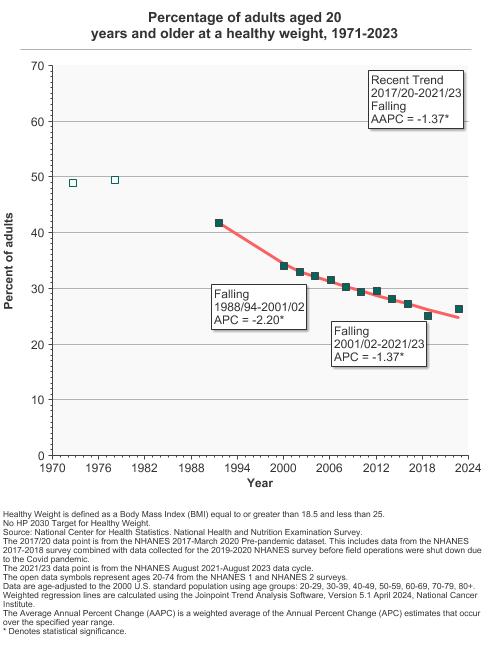
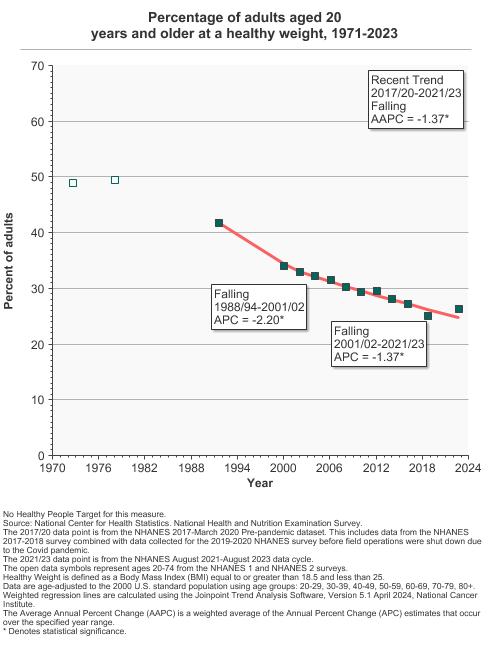
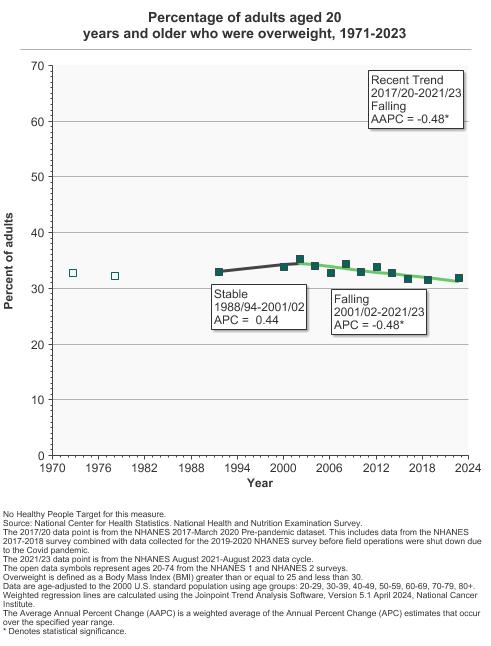
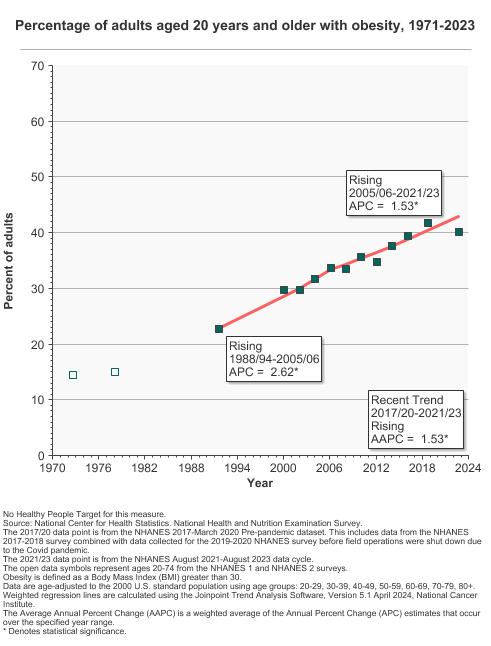
Percentage of adults aged 20 years and older with a healthy weight, overweight, or obesity, 1971-2023 Overview Graph Detailed Trend Graphs Most Recent Estimates (2021 to 2023) Percent of adults 95% Confidence Interval 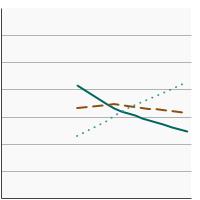
Healthy Weight 26.3 23.0 - 29.6 Overweight 31.9 30.0 - 33.8 Obese 40.2 36.2 - 44.1 The 2021 to 2023 data point is from the NHANES August 2021-August 2023 data cycle.
- Children and Adolescents, Healthy Weight
- By Sex
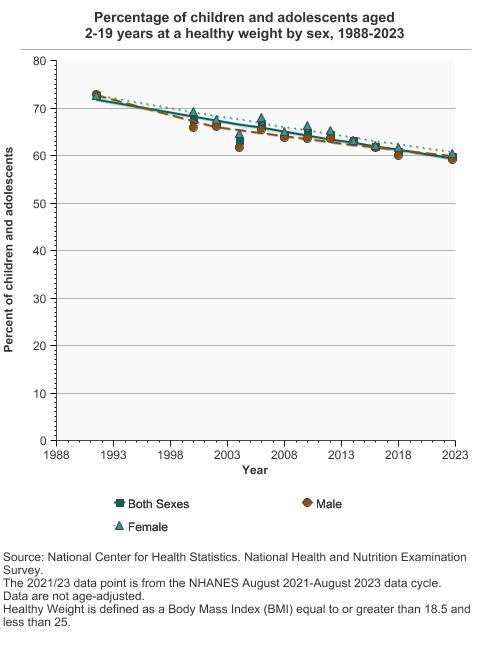
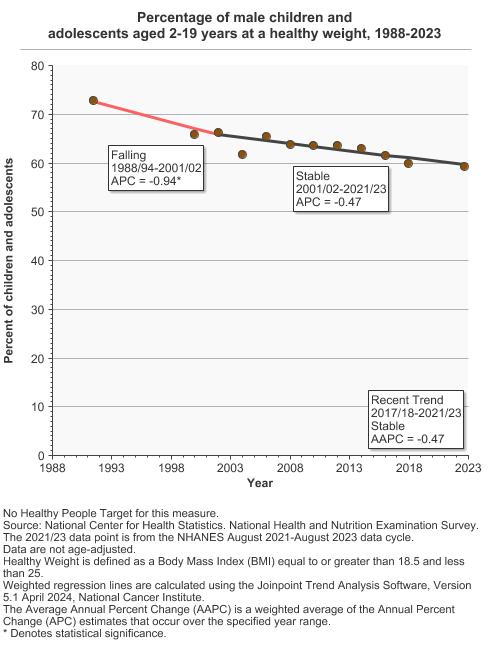
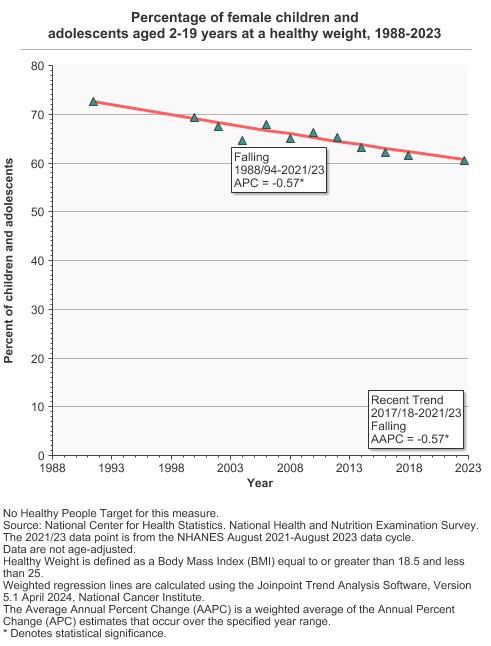
Percentage of children and adolescents aged 2-19 years at a healthy weight by sex, 1988-2023 Overview Graph Detailed Trend Graphs Most Recent Estimates (2021 to 2023) Percent of children and adolescents 95% Confidence Interval 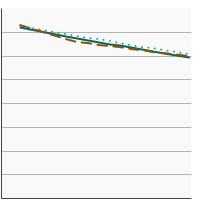
Both Sexes 59.9 57.3 - 62.4 Male 59.3 56.1 - 62.4 Female 60.5 56.6 - 64.4 The 2021 to 2023 data point is from the NHANES August 2021-August 2023 data cycle. - By Race/Ethnicity
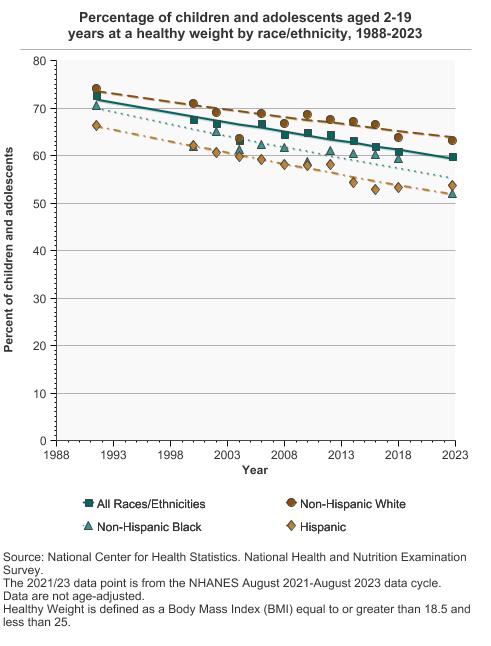
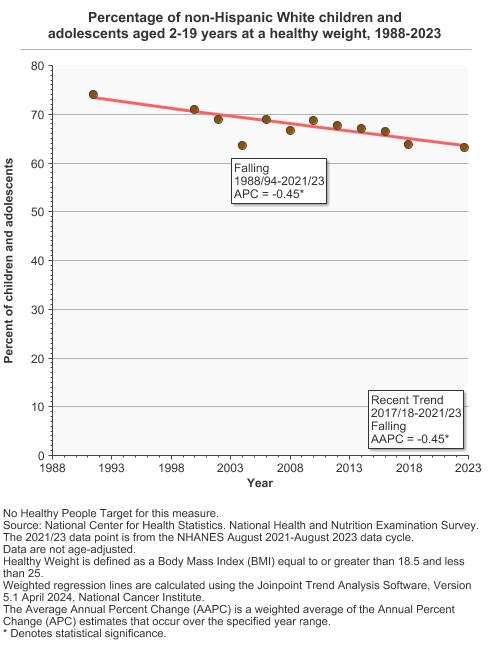
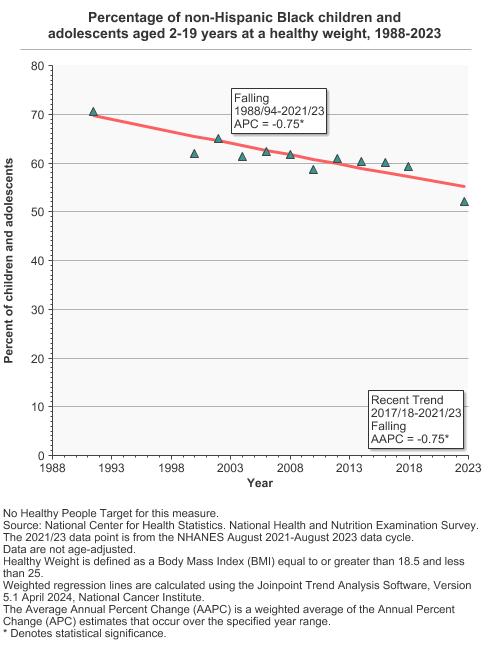
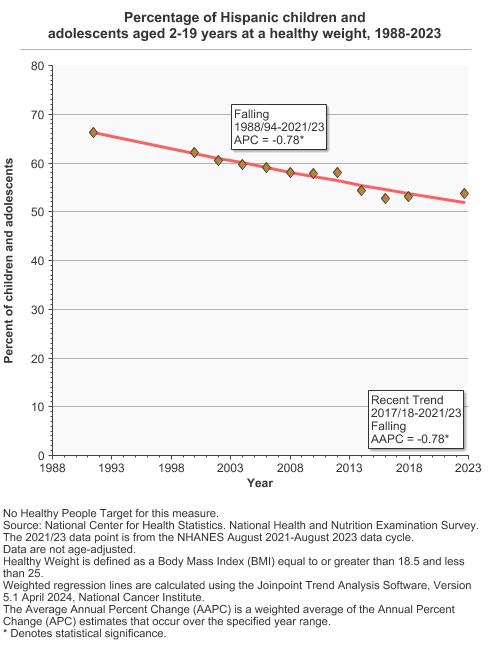
Percentage of children and adolescents aged 2-19 years at a healthy weight by race/ethnicity, 1988-2023 Overview Graph Detailed Trend Graphs Most Recent Estimates (2021 to 2023) Percent of children and adolescents 95% Confidence Interval 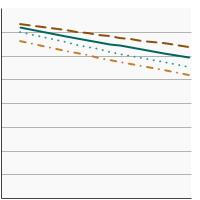
All Races/Ethnicities 59.9 57.3 - 62.4 Non-Hispanic White 63.2 59.4 - 67.0 Non-Hispanic Black 52.0 43.2 - 60.8 Hispanic 53.7 48.0 - 59.5 The 2021 to 2023 data point is from the NHANES August 2021-August 2023 data cycle. - By Poverty Income Level
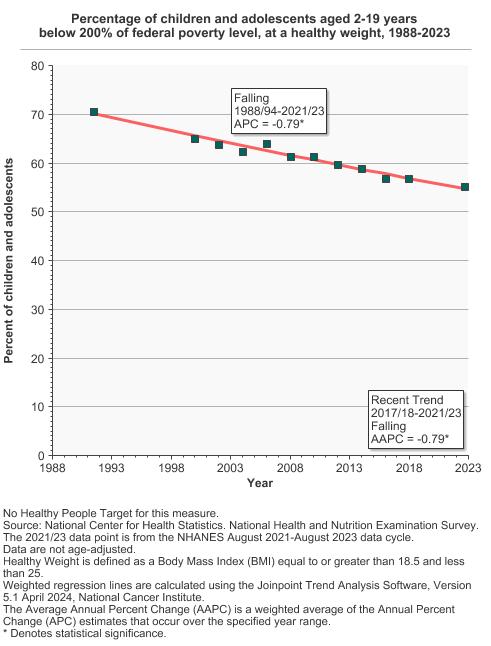
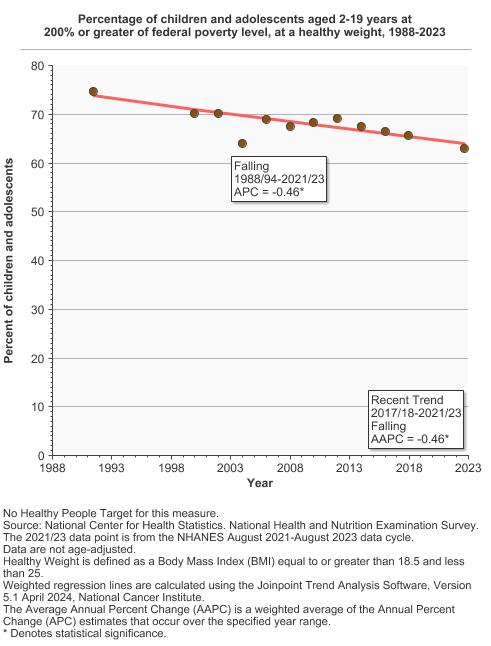
Percentage of children and adolescents aged 2-19 years at a healthy weight by poverty status, 1988-2023 Overview Graph Detailed Trend Graphs Most Recent Estimates (2021 to 2023) Percent of children and adolescents 95% Confidence Interval 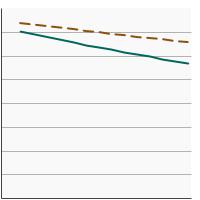
< 200% of the federal poverty level 55.3 52.0 - 58.5 >= 200% of the federal poverty level 62.9 59.6 - 66.2 The 2021 to 2023 data point is from the NHANES August 2021-August 2023 data cycle.
- Children and Adolescents, Overweight
- By Sex
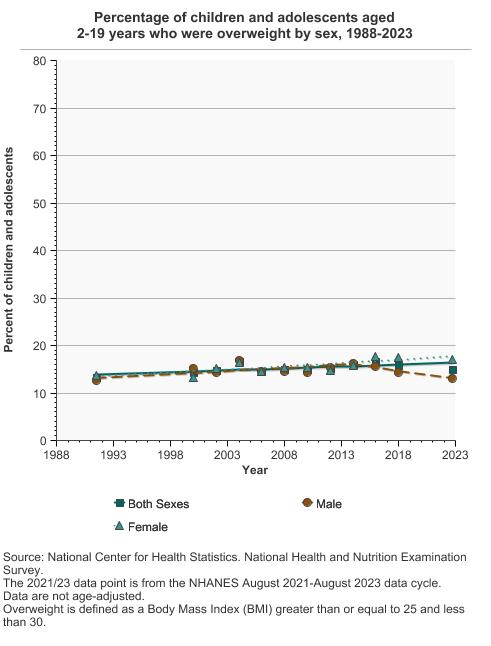
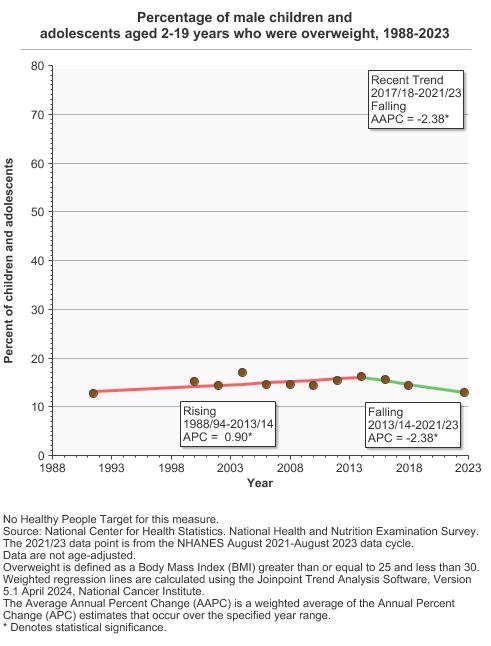
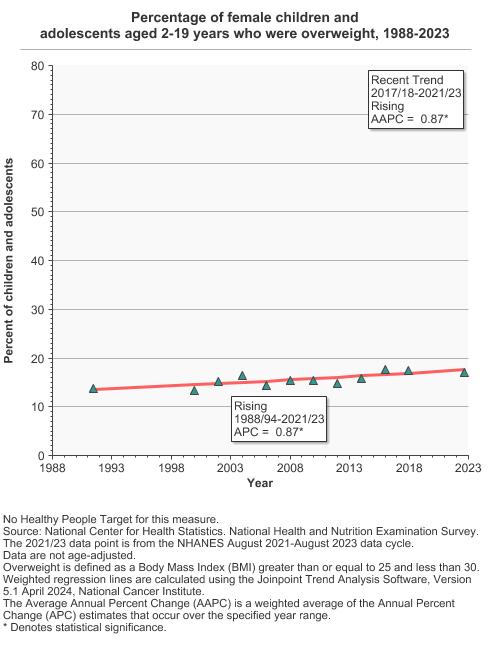
Percentage of children and adolescents aged 2-19 years who were overweight by sex, 1988-2023 Overview Graph Detailed Trend Graphs Most Recent Estimates (2021 to 2023) Percent of children and adolescents 95% Confidence Interval 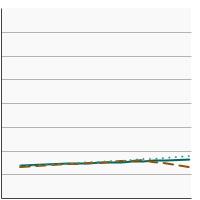
Both Sexes 15.0 12.9 - 17.1 Male 13.0 11.1 - 14.9 Female 17.1 14.0 - 20.3 The 2021 to 2023 data point is from the NHANES August 2021-August 2023 data cycle. - By Race/Ethnicity
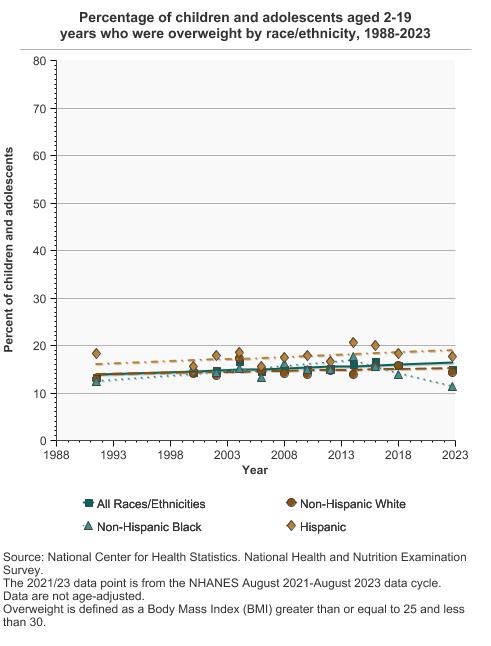
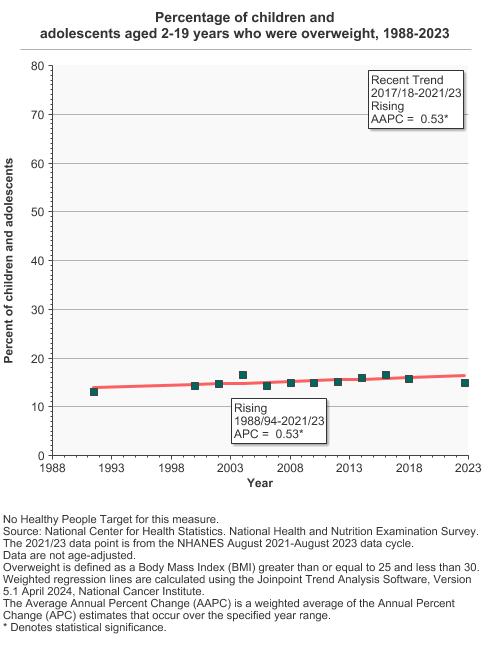
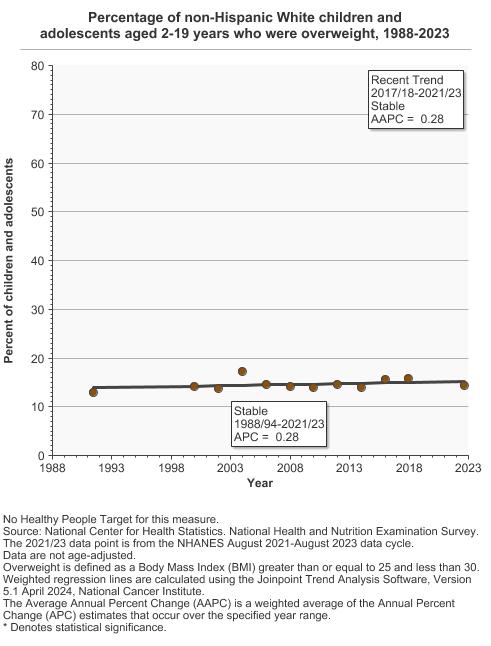
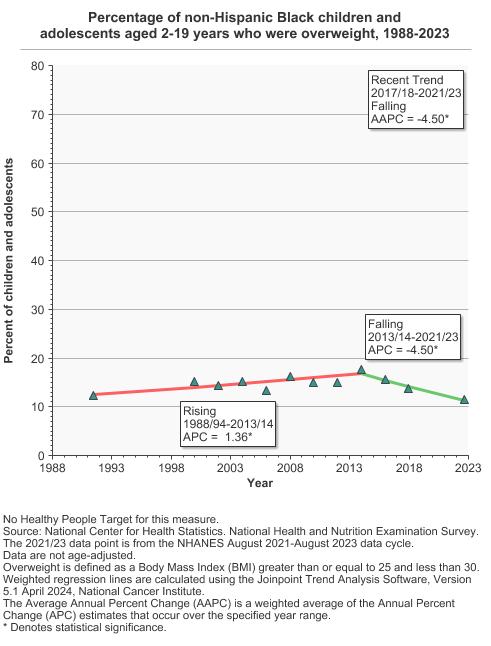
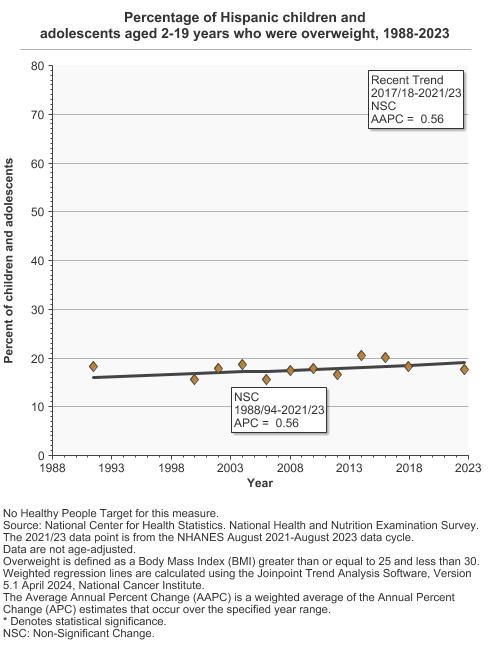
Percentage of children and adolescents aged 2-19 years who were overweight by race/ethnicity, 1988-2023 Overview Graph Detailed Trend Graphs Most Recent Estimates (2021 to 2023) Percent of children and adolescents 95% Confidence Interval 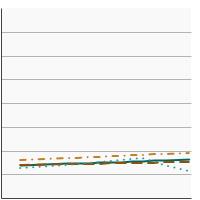
All Races/Ethnicities 15.0 12.9 - 17.1 Non-Hispanic White 14.3 12.3 - 16.4 Non-Hispanic Black 11.4 6.9 - 16.0 Hispanic 17.7 13.7 - 21.7 The 2021 to 2023 data point is from the NHANES August 2021-August 2023 data cycle. - By Poverty Income Level
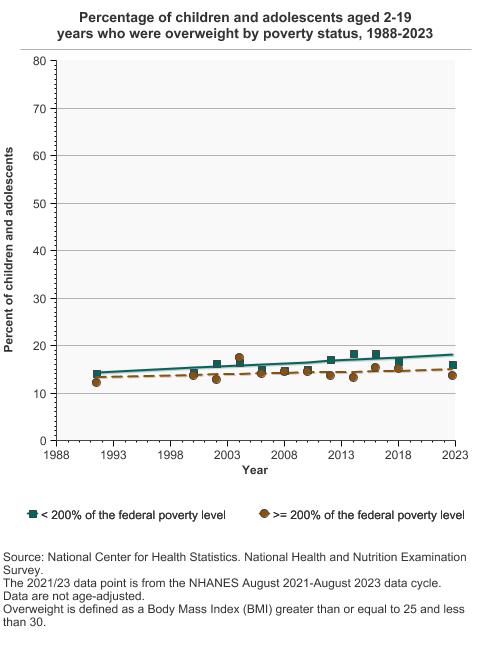
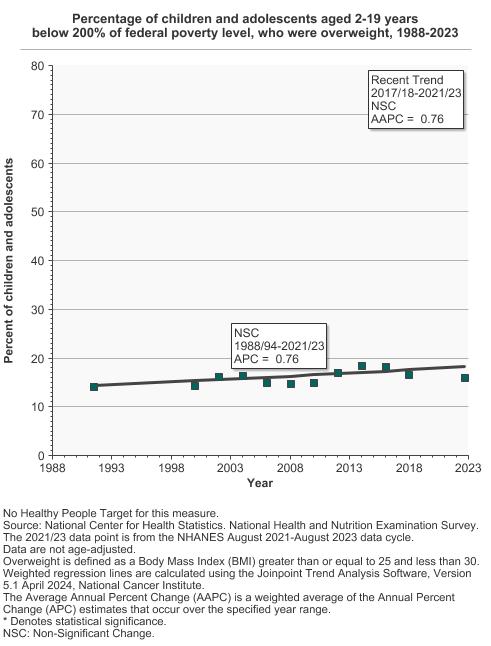
Percentage of children and adolescents aged 2-19 years who were overweight by poverty status, 1988-2023 Overview Graph Detailed Trend Graphs Most Recent Estimates (2021 to 2023) Percent of children and adolescents 95% Confidence Interval 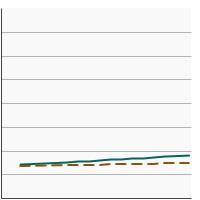
< 200% of the federal poverty level 16.1 13.1 - 19.1 >= 200% of the federal poverty level 13.7 11.6 - 15.9 The 2021 to 2023 data point is from the NHANES August 2021-August 2023 data cycle.
- Children and Adolescents, Obesity
- By Sex
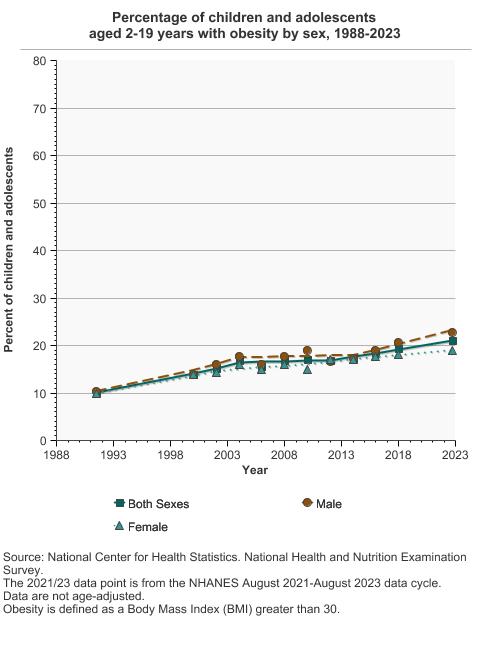
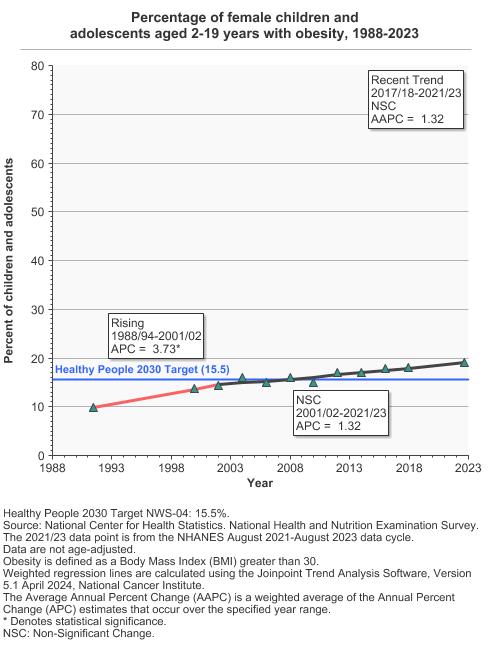
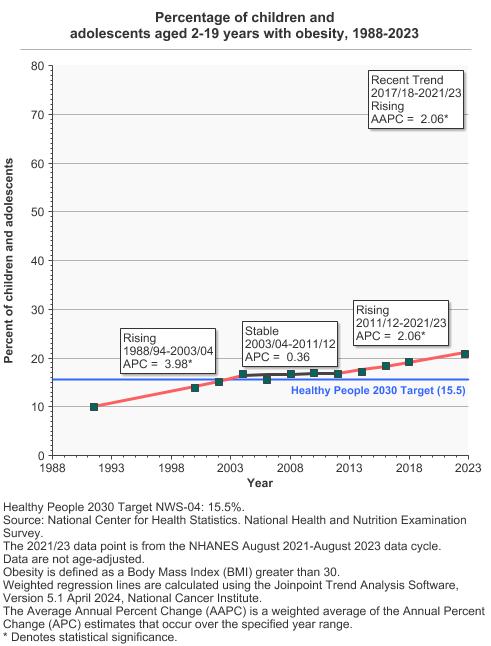
Percentage of children and adolescents aged 2-19 years with obesity by sex, 1988-2023 Overview Graph Detailed Trend Graphs Most Recent Estimates (2021 to 2023) Percent of children and adolescents 95% Confidence Interval 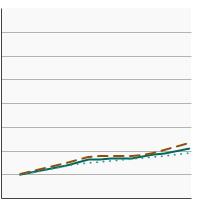
Both Sexes 21.0 18.6 - 23.3 Male 22.8 19.7 - 25.8 Female 19.0 15.9 - 22.1 The 2021 to 2023 data point is from the NHANES August 2021-August 2023 data cycle. - By Race/Ethnicity
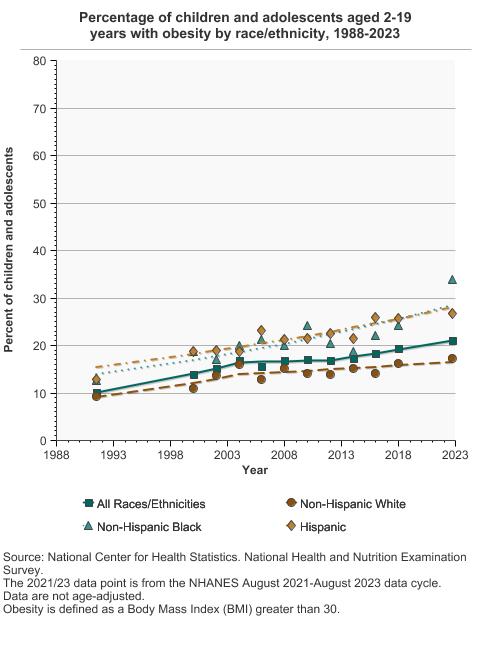
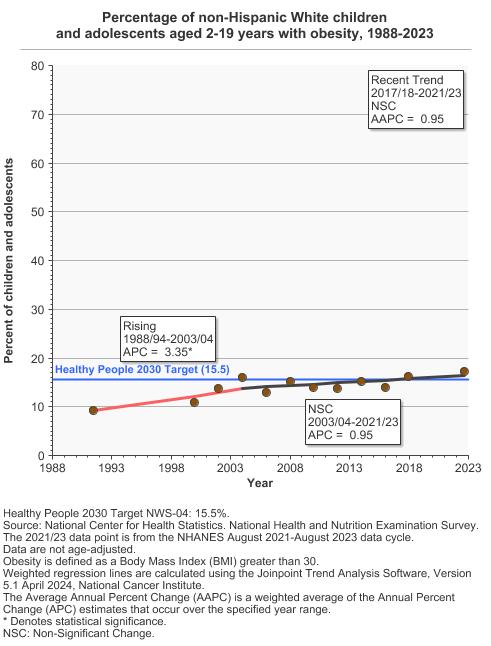
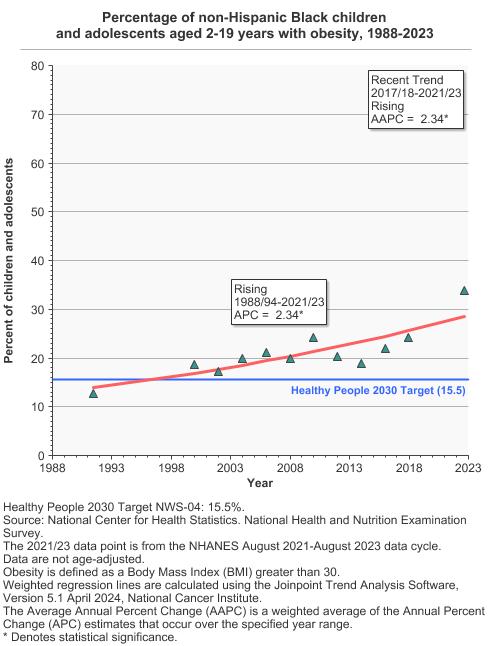
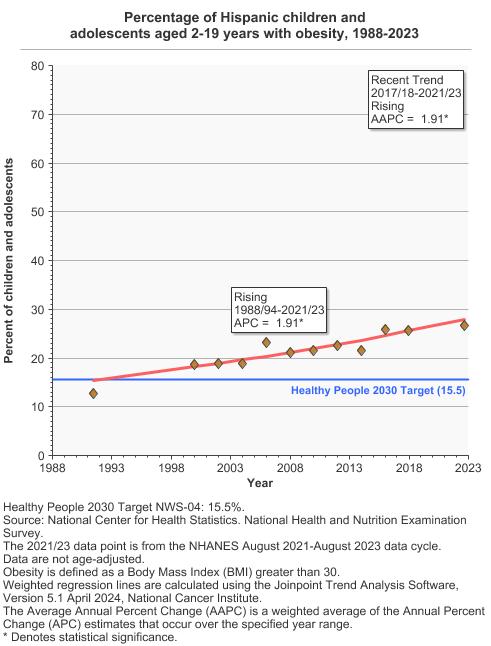
Percentage of children and adolescents aged 2-19 years with obesity by race/ethnicity, 1988-2023 Overview Graph Detailed Trend Graphs Most Recent Estimates (2021 to 2023) Percent of children and adolescents 95% Confidence Interval 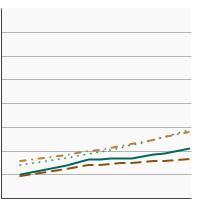
All Races/Ethnicities 21.0 18.6 - 23.3 Non-Hispanic White 17.2 14.9 - 19.5 Non-Hispanic Black 33.9 23.7 - 44.1 Hispanic 26.7 21.3 - 32.1 The 2021 to 2023 data point is from the NHANES August 2021-August 2023 data cycle. - By Poverty Income Level
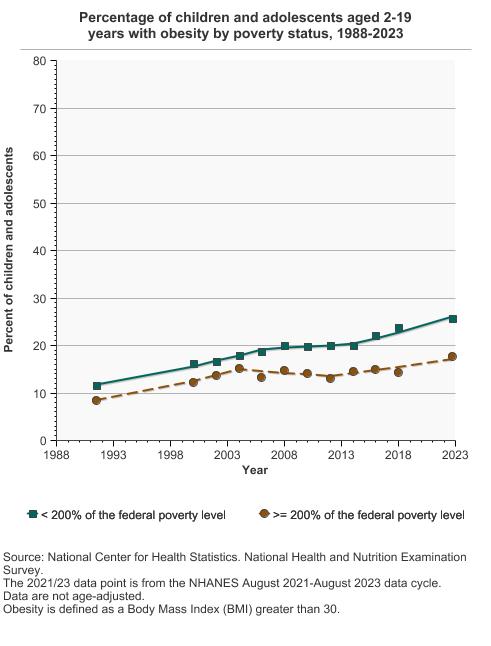
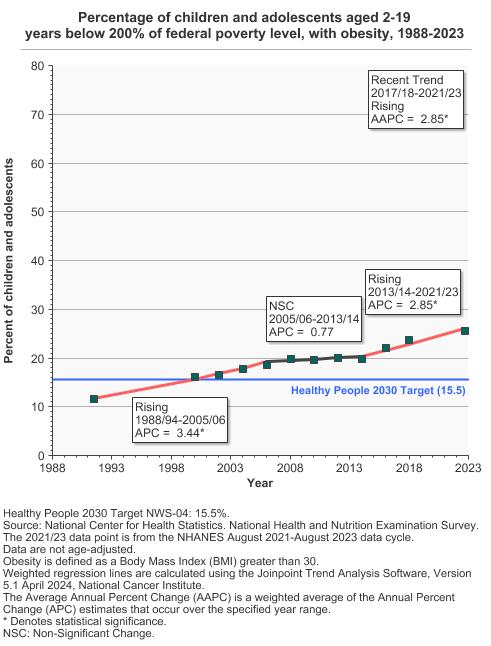
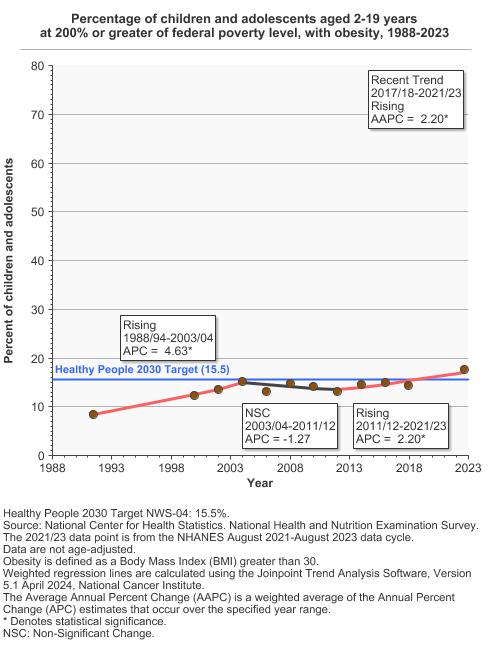
Percentage of children and adolescents aged 2-19 years with obesity by poverty status, 1988-2023 Overview Graph Detailed Trend Graphs Most Recent Estimates (2021 to 2023) Percent of children and adolescents 95% Confidence Interval 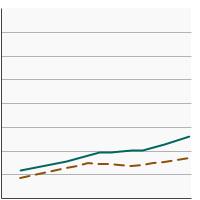
< 200% of the federal poverty level 25.6 22.7 - 28.5 >= 200% of the federal poverty level 17.6 14.2 - 21.0 The 2021 to 2023 data point is from the NHANES August 2021-August 2023 data cycle.
- Adults, Healthy Weight
- By Sex
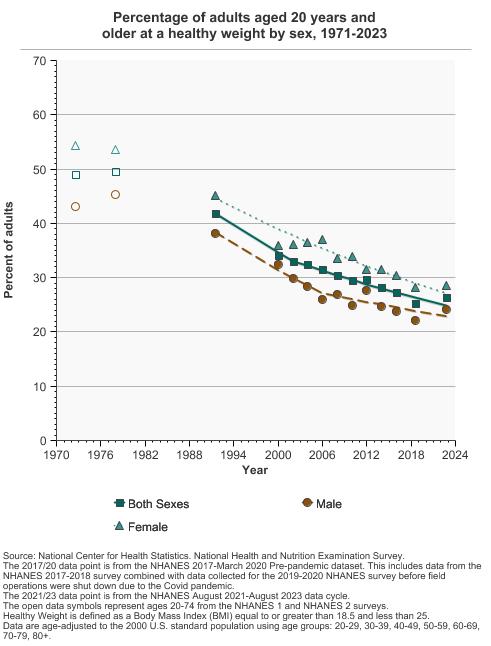
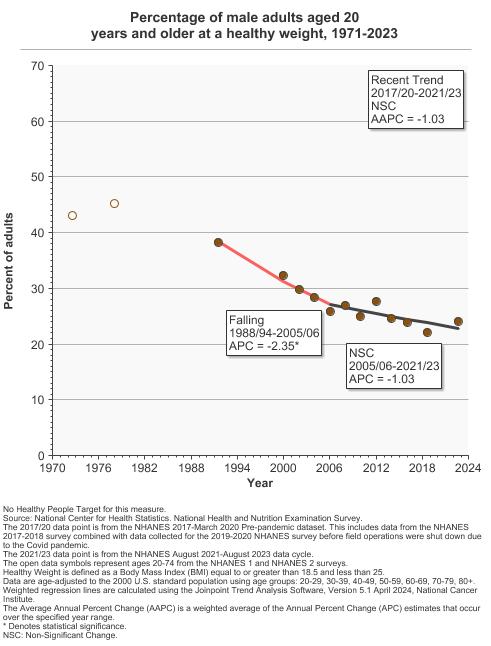
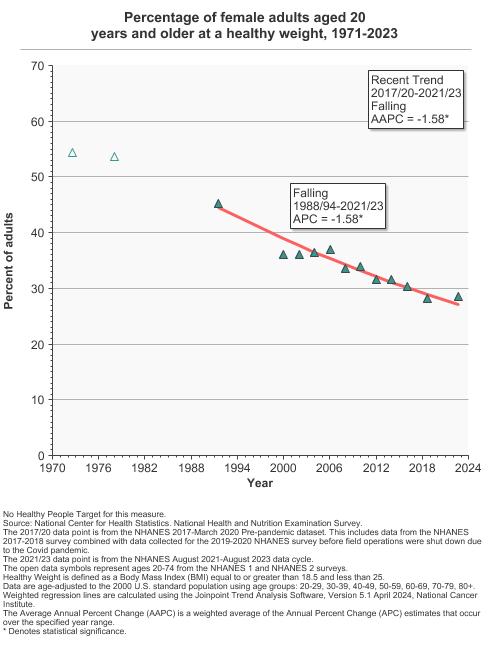
Percentage of adults aged 20 years and older at a healthy weight by sex, 1971-2023 Overview Graph Detailed Trend Graphs Most Recent Estimates (2021 to 2023) Percent of adults 95% Confidence Interval 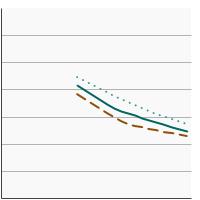
Both Sexes 26.3 23.0 - 29.6 Male 24.1 20.5 - 27.6 Female 28.5 24.7 - 32.4 The 2021 to 2023 data point is from the NHANES August 2021-August 2023 data cycle. - By Race/Ethnicity
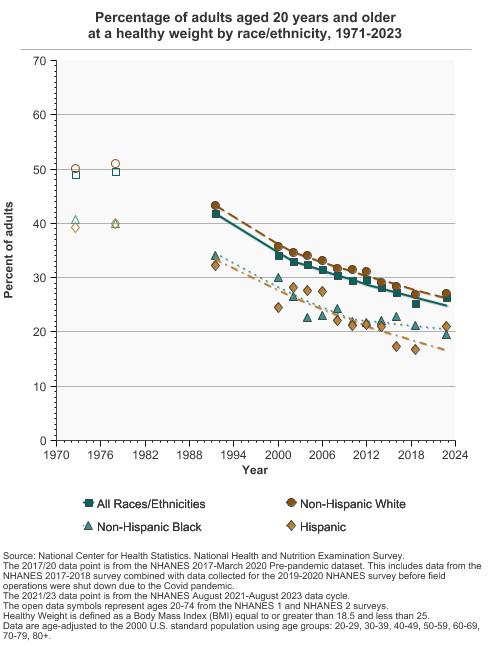
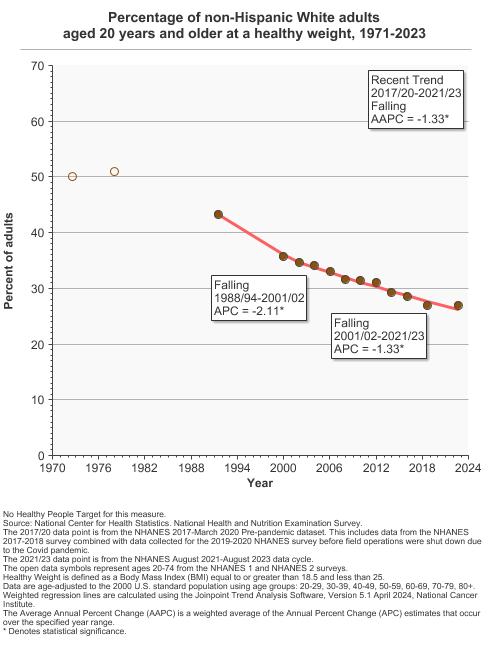
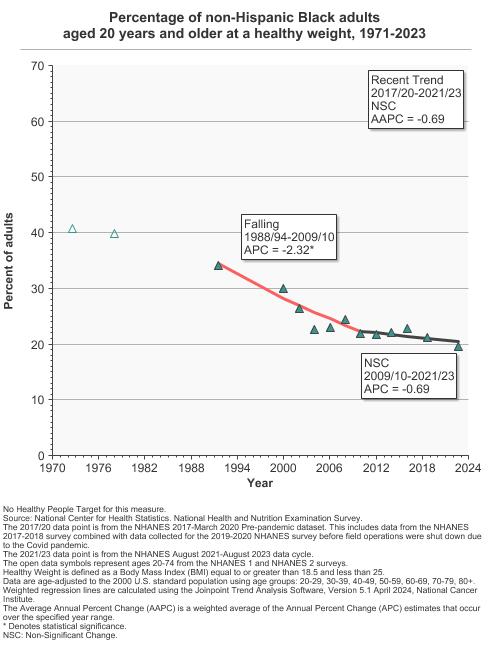
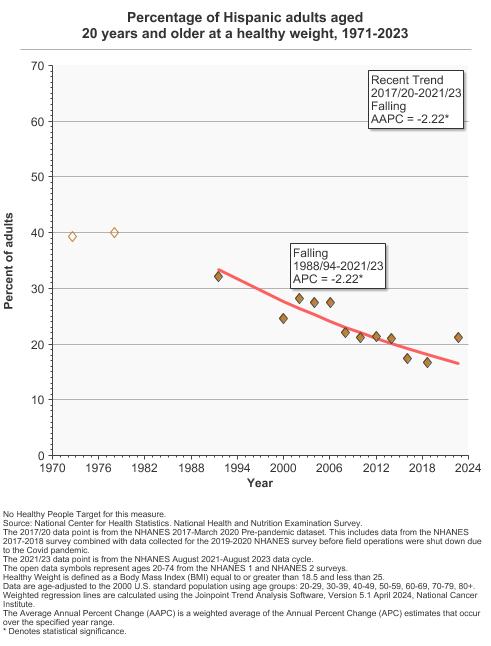
Percentage of adults aged 20 years and older at a healthy weight by race/ethnicity, 1971-2023 Overview Graph Detailed Trend Graphs Most Recent Estimates (2021 to 2023) Percent of adults 95% Confidence Interval 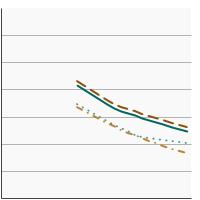
All Races/Ethnicities 26.3 23.0 - 29.6 Non-Hispanic White 27.0 24.3 - 29.7 Non-Hispanic Black 19.5 16.4 - 22.6 Hispanic 21.1 15.6 - 26.6 The 2021 to 2023 data point is from the NHANES August 2021-August 2023 data cycle. - By Poverty Income Level
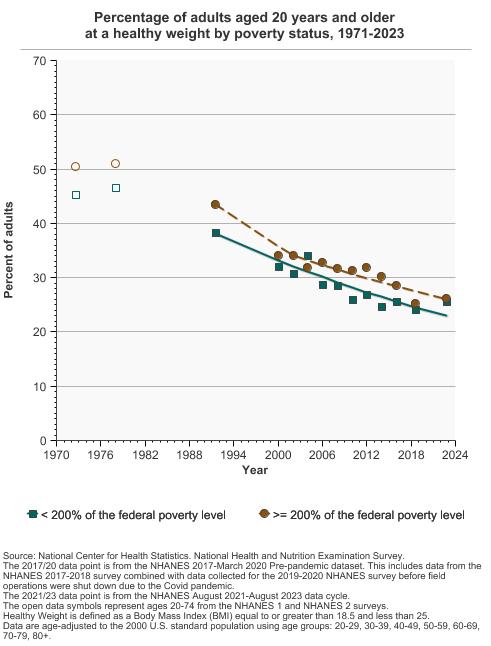
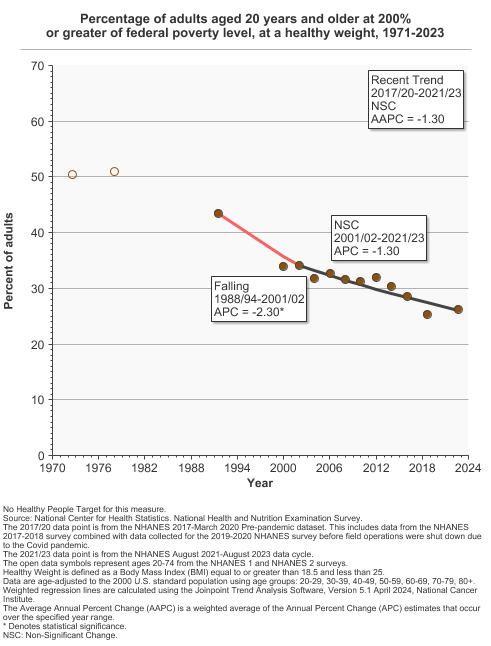
Percentage of adults aged 20 years and older at a healthy weight by poverty status, 1971-2023 Overview Graph Detailed Trend Graphs Most Recent Estimates (2021 to 2023) Percent of adults 95% Confidence Interval 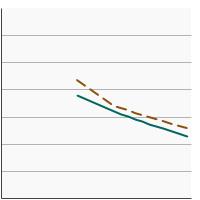
< 200% of the federal poverty level 25.6 22.7 - 28.5 >= 200% of the federal poverty level 26.2 22.3 - 30.1 The 2021 to 2023 data point is from the NHANES August 2021-August 2023 data cycle. - By Education Level
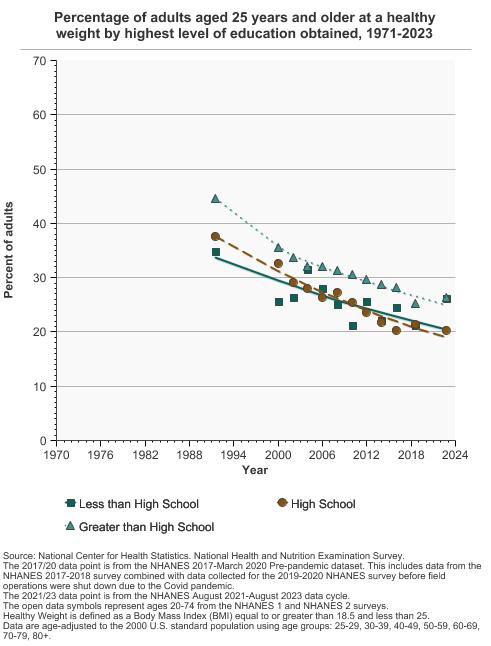
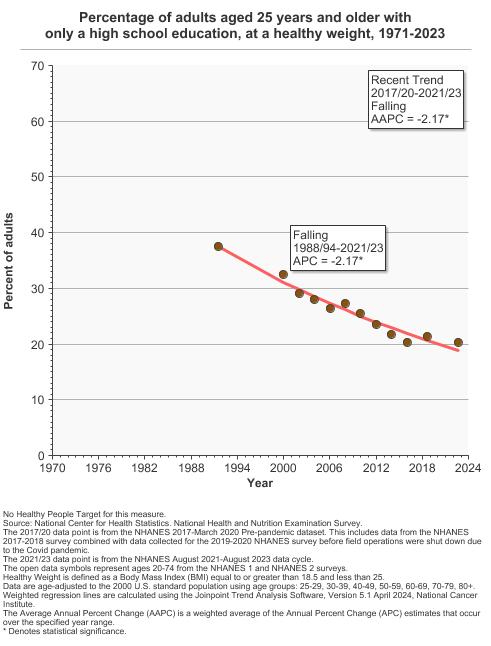
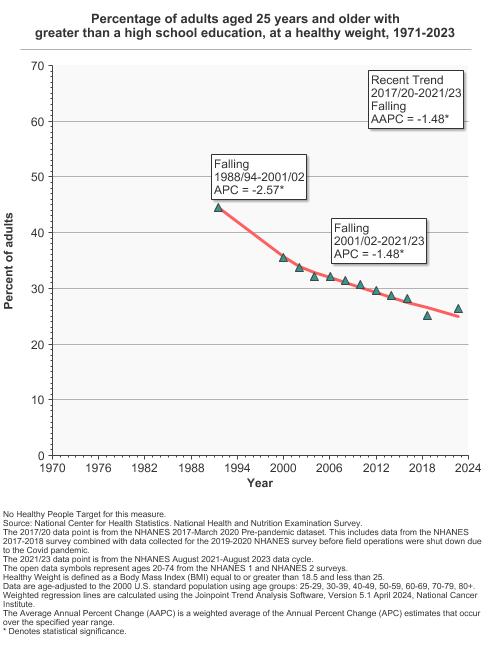
Percentage of adults aged 25 years and older at a healthy weight by highest level of education obtained, 1971-2023 Overview Graph Detailed Trend Graphs Most Recent Estimates (2021 to 2023) Percent of adults 95% Confidence Interval 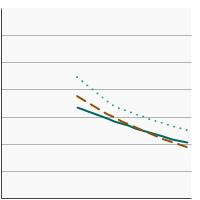
Less than High School 26.1 20.0 - 32.2 High School 20.3 15.3 - 25.3 Greater than High School 26.3 23.2 - 29.4
- Adults, Overweight
- By Sex
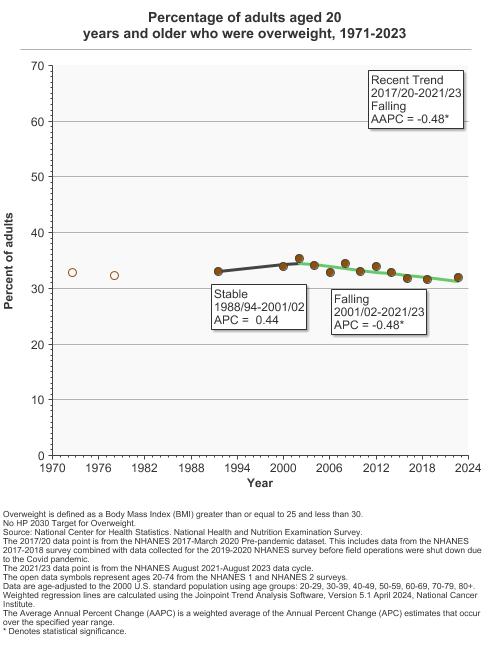
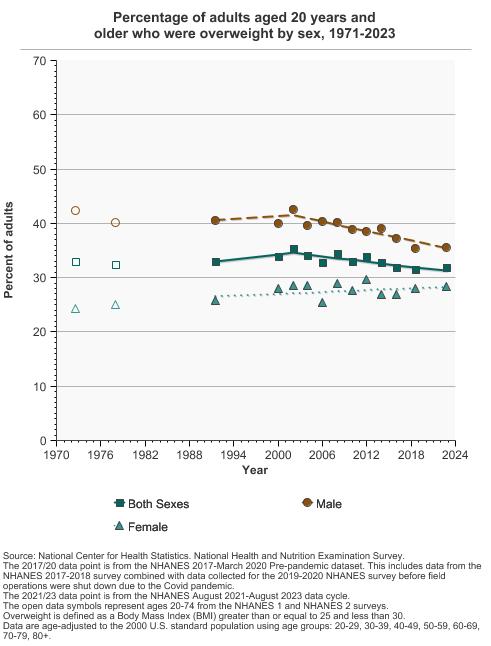
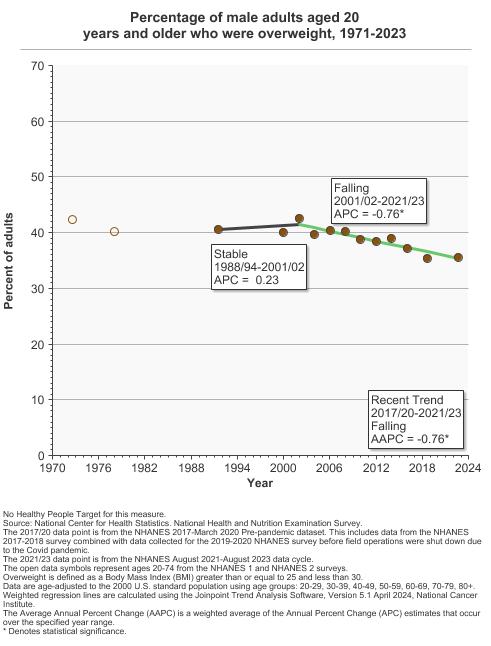
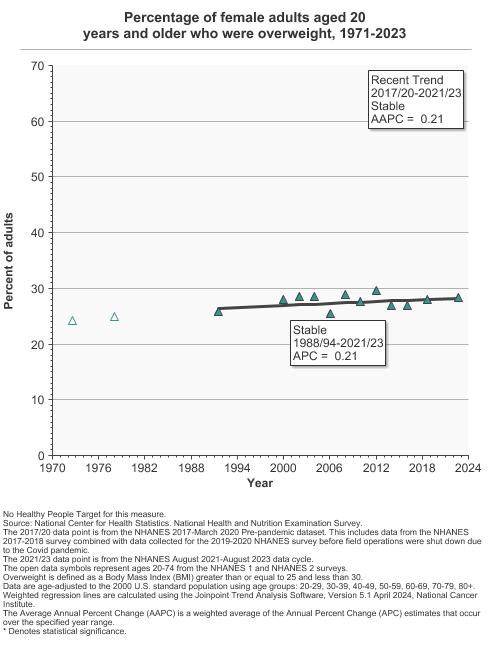
Percentage of adults aged 20 years and older who were overweight by sex, 1971-2023 Overview Graph Detailed Trend Graphs Most Recent Estimates (2021 to 2023) Percent of adults 95% Confidence Interval 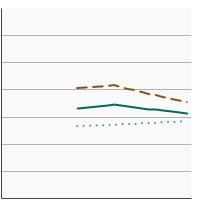
Both Sexes 31.9 30.0 - 33.8 Male 35.6 32.6 - 38.5 Female 28.3 26.3 - 30.3 The 2021 to 2023 data point is from the NHANES August 2021-August 2023 data cycle. - By Race/Ethnicity
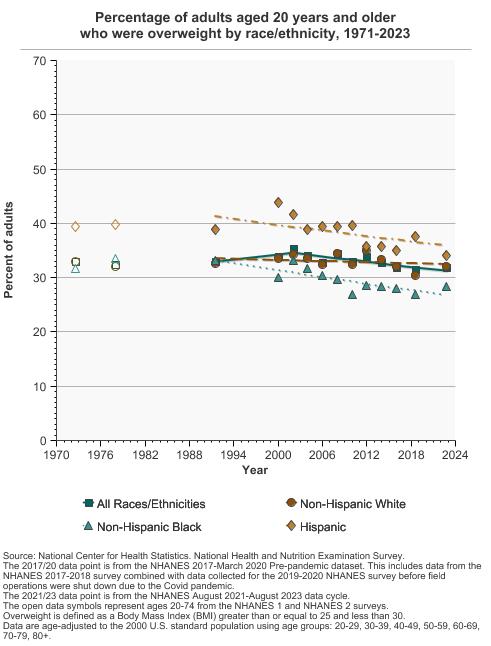
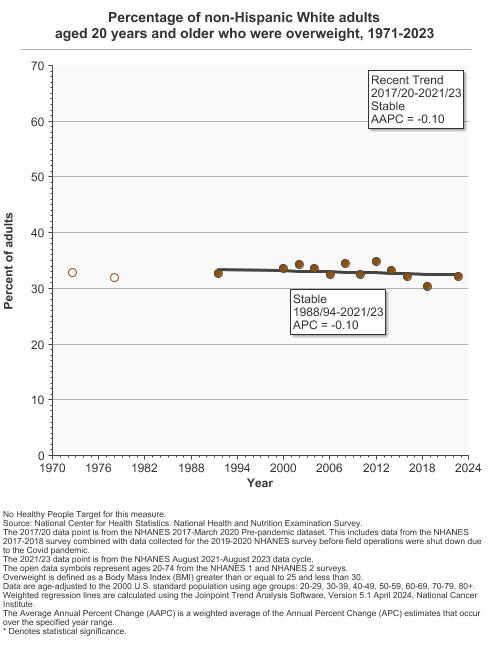
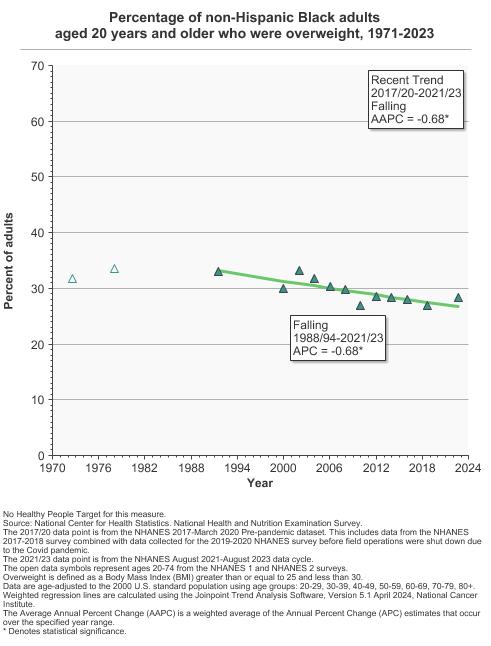
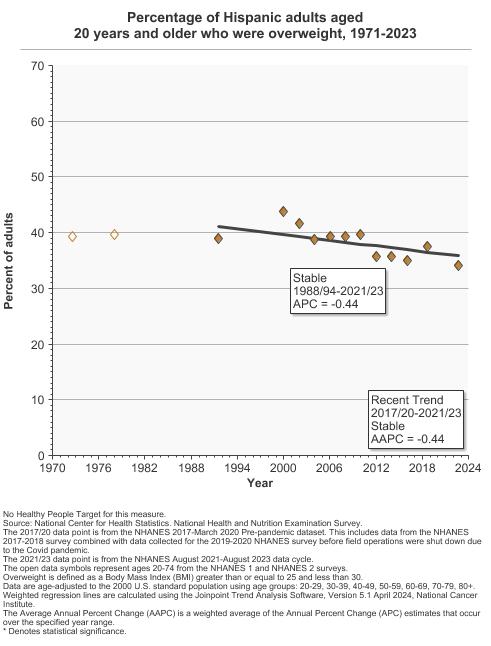
Percentage of adults aged 20 years and older who were overweight by race/ethnicity, 1971-2023 Overview Graph Detailed Trend Graphs Most Recent Estimates (2021 to 2023) Percent of adults 95% Confidence Interval 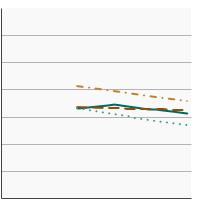
All Races/Ethnicities 31.9 30.0 - 33.8 Non-Hispanic White 32.1 29.8 - 34.4 Non-Hispanic Black 28.3 23.7 - 32.9 Hispanic 34.1 30.9 - 37.3 The 2021 to 2023 data point is from the NHANES August 2021-August 2023 data cycle. - By Poverty Income Level
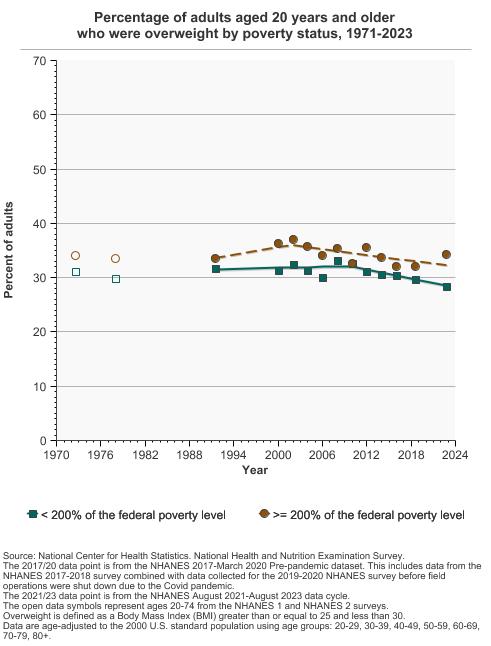
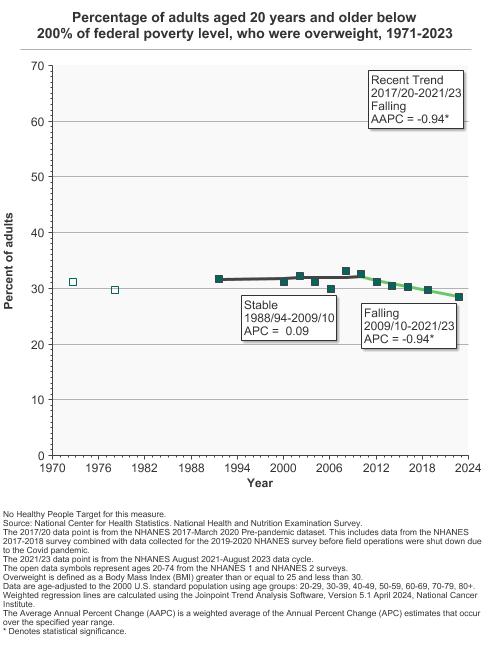
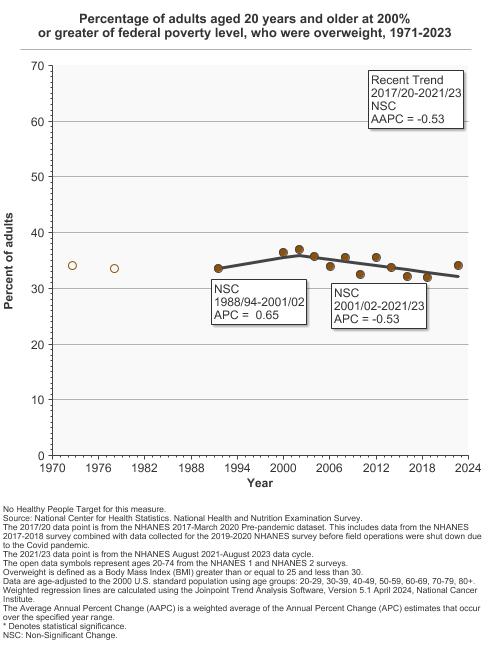
Percentage of adults aged 20 years and older who were overweight by poverty status, 1971-2023 Overview Graph Detailed Trend Graphs Most Recent Estimates (2021 to 2023) Percent of adults 95% Confidence Interval 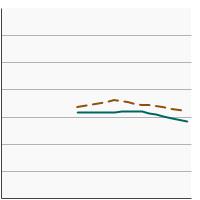
< 200% of the federal poverty level 28.5 26.2 - 30.7 >= 200% of the federal poverty level 34.2 31.7 - 36.7 The 2021 to 2023 data point is from the NHANES August 2021-August 2023 data cycle. - By Education Level
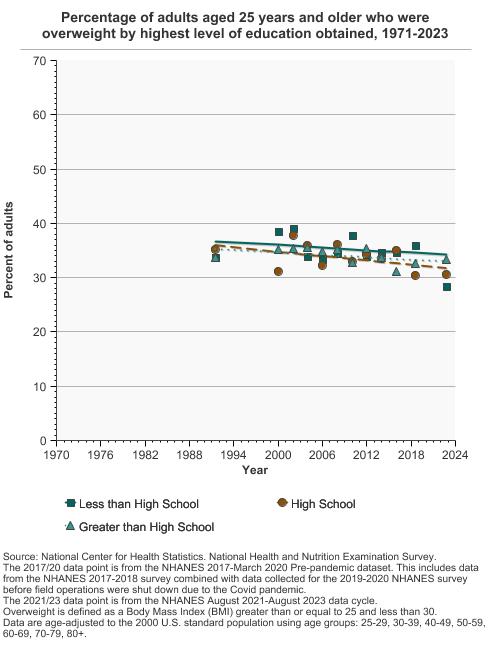
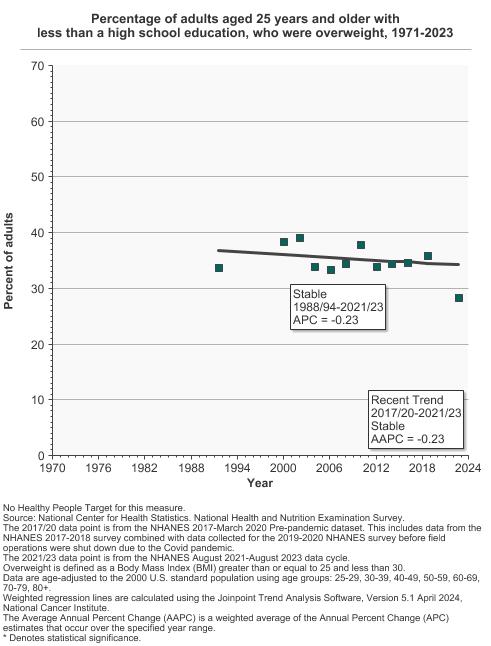
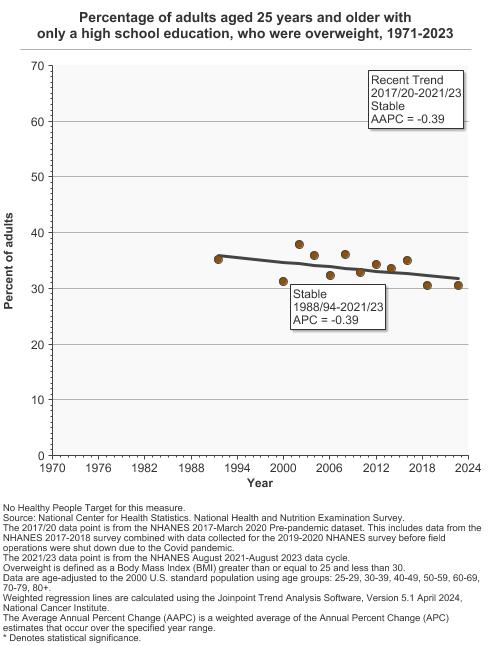
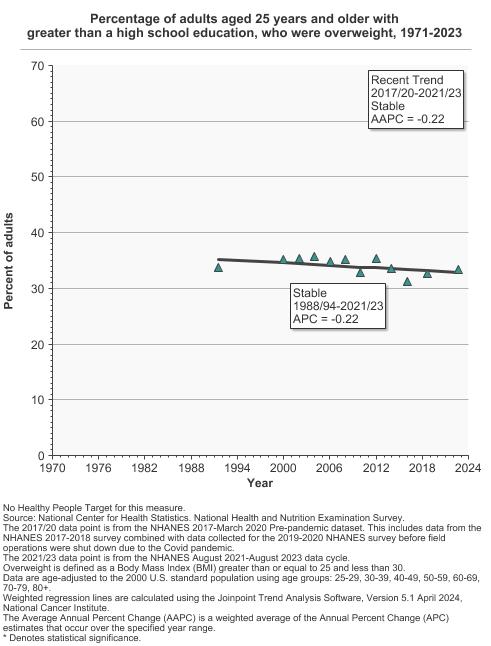
Percentage of adults aged 25 years and older who were overweight by highest level of education obtained, 1971-2023 Overview Graph Detailed Trend Graphs Most Recent Estimates (2021 to 2023) Percent of adults 95% Confidence Interval 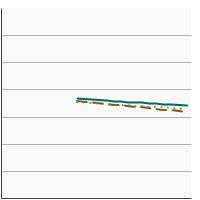
Less than High School 28.4 23.2 - 33.7 High School 30.5 27.3 - 33.7 Greater than High School 33.3 30.6 - 36.0
- Adults, Obesity
- By Sex
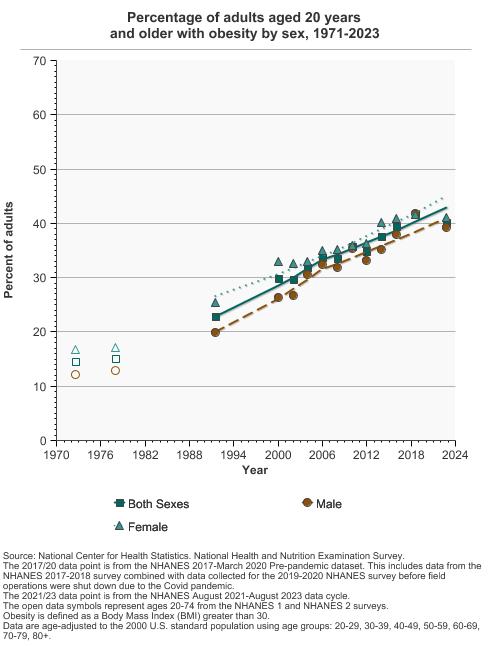
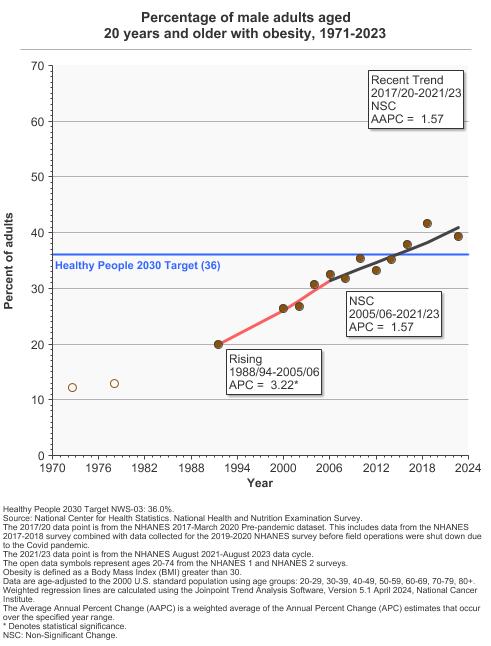
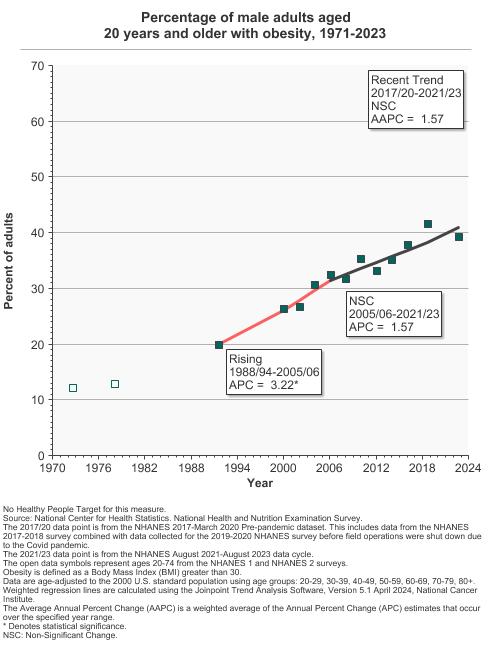
Percentage of adults aged 20 years and older with obesity by sex, 1971-2023 Overview Graph Detailed Trend Graphs Most Recent Estimates (2021 to 2023) Percent of adults 95% Confidence Interval 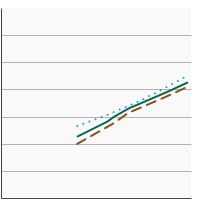
Both Sexes 40.2 36.2 - 44.1 Male 39.3 35.3 - 43.2 Female 41.0 36.3 - 45.7 The 2021 to 2023 data point is from the NHANES August 2021-August 2023 data cycle. - By Race/Ethnicity
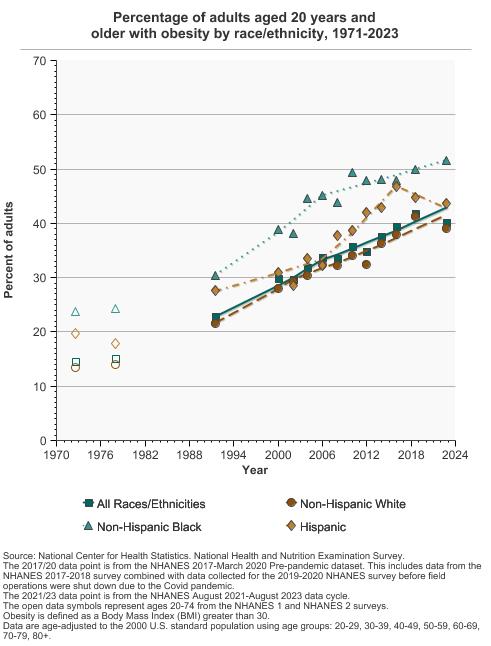
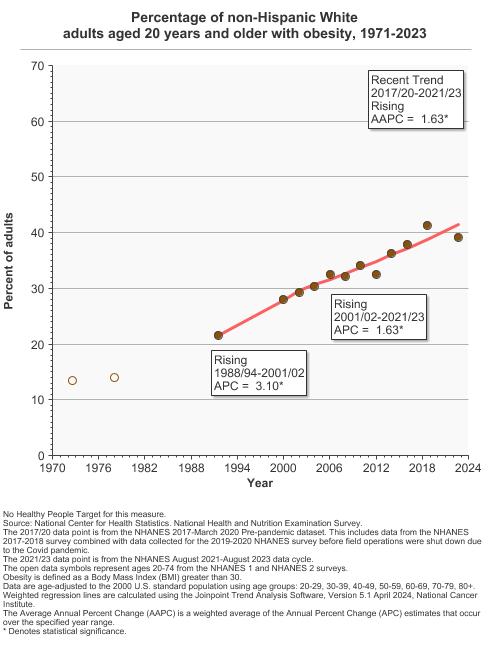
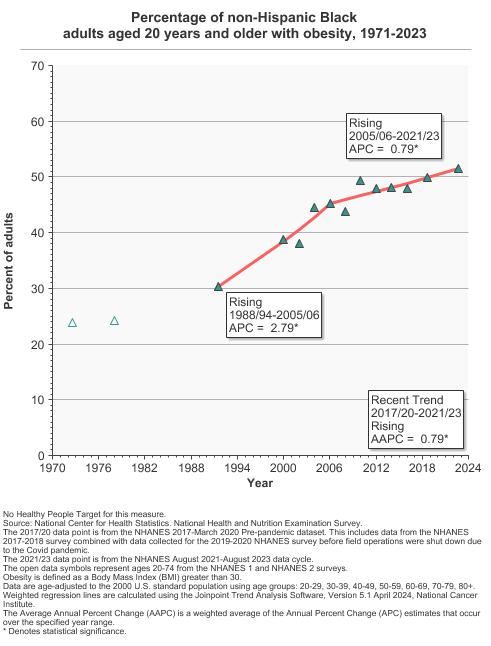
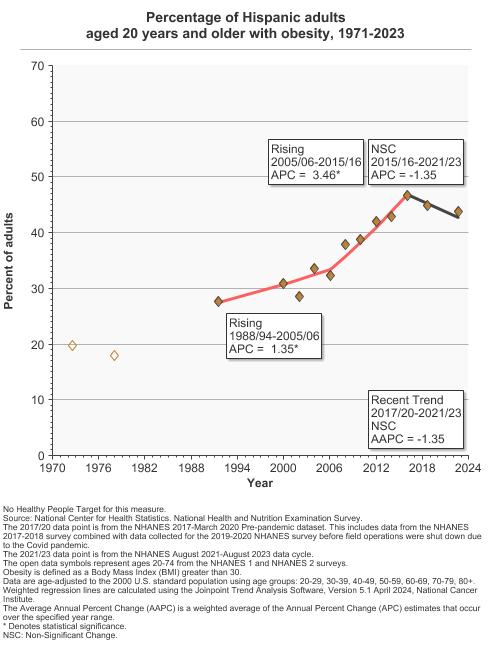
Percentage of adults aged 20 years and older with obesity by race/ethnicity, 1971-2023 Overview Graph Detailed Trend Graphs Most Recent Estimates (2021 to 2023) Percent of adults 95% Confidence Interval 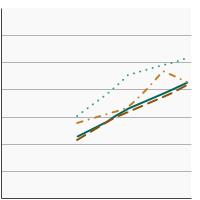
All Races/Ethnicities 40.2 36.2 - 44.1 Non-Hispanic White 39.1 35.4 - 42.9 Non-Hispanic Black 51.5 45.9 - 57.1 Hispanic 43.7 36.9 - 50.6 The 2021 to 2023 data point is from the NHANES August 2021-August 2023 data cycle. - Males by Race/Ethnicity
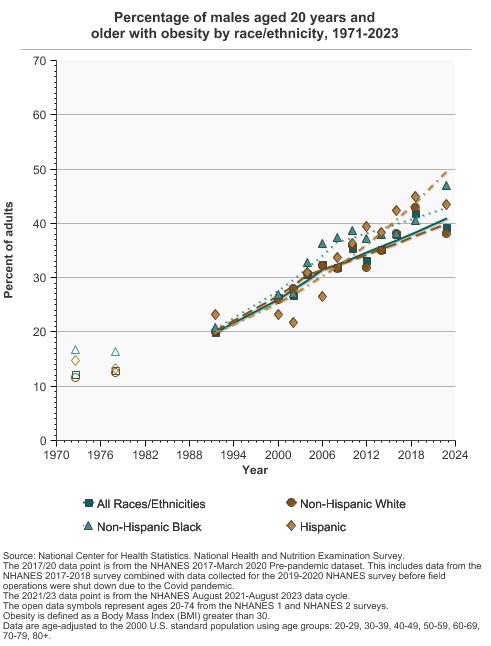
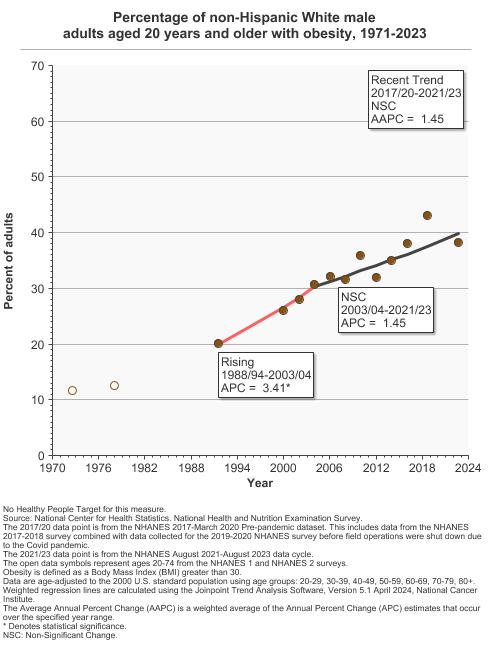
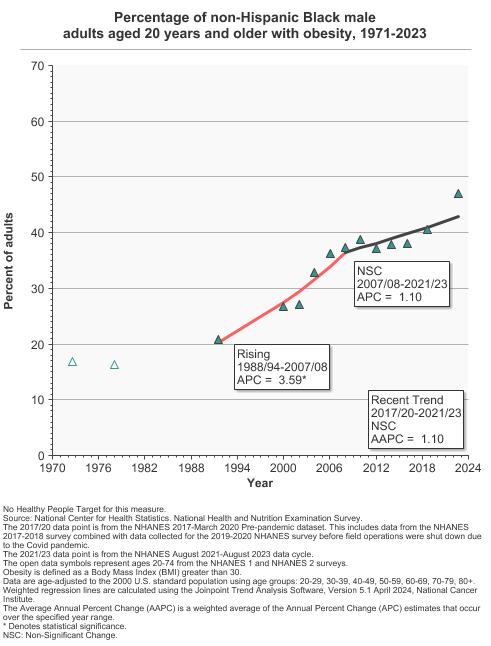
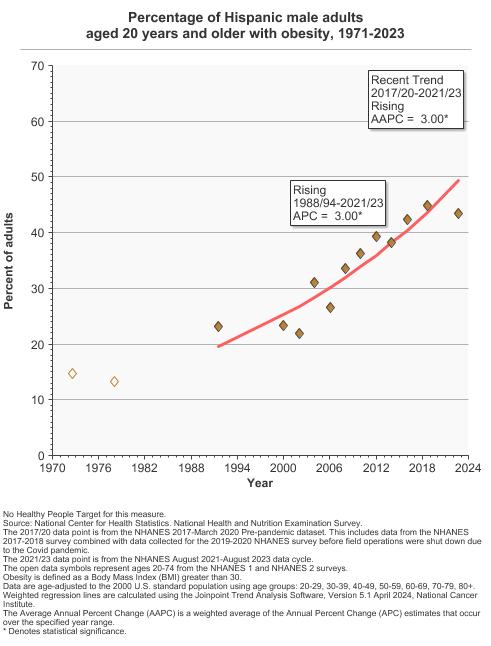
Percentage of males aged 20 years and older with obesity by race/ethnicity, 1971-2023 Overview Graph Detailed Trend Graphs Most Recent Estimates (2021 to 2023) Percent of adults 95% Confidence Interval 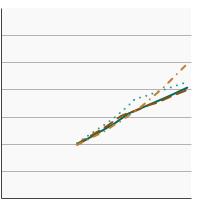
All Races/Ethnicities 39.3 35.3 - 43.2 Non-Hispanic White 38.2 34.4 - 42.0 Non-Hispanic Black 47.0 37.7 - 56.2 Hispanic 43.4 37.7 - 49.1 The 2021 to 2023 data point is from the NHANES August 2021-August 2023 data cycle. - Females by Race/Ethnicity
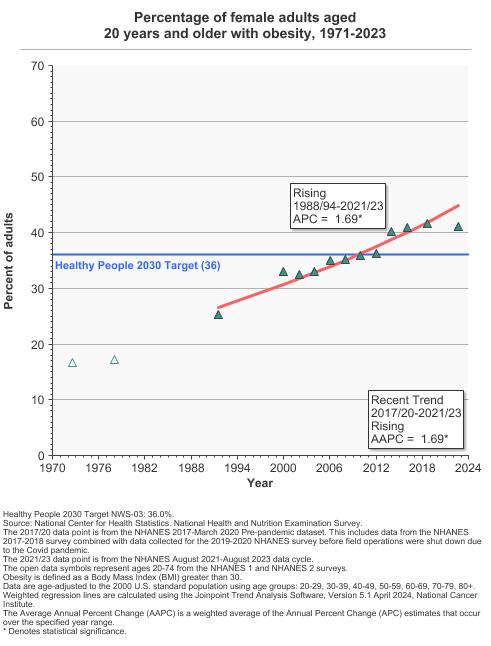
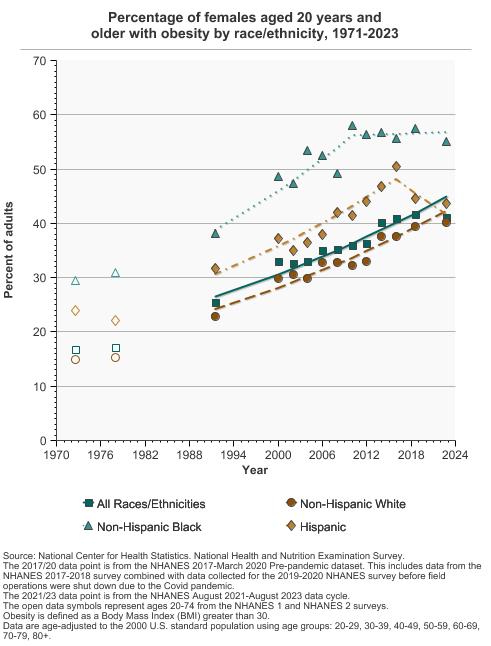
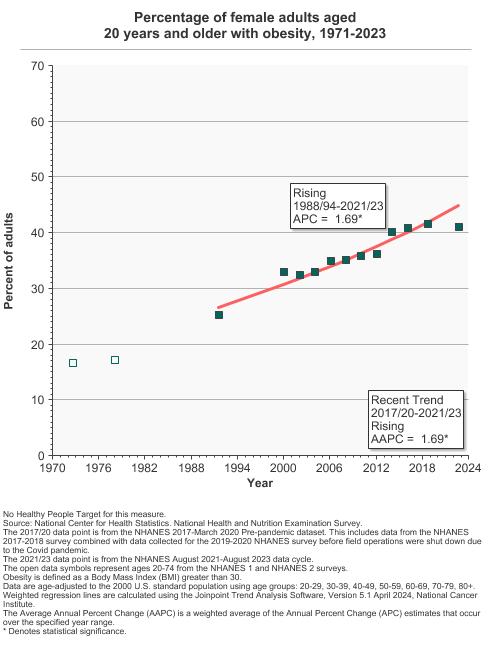
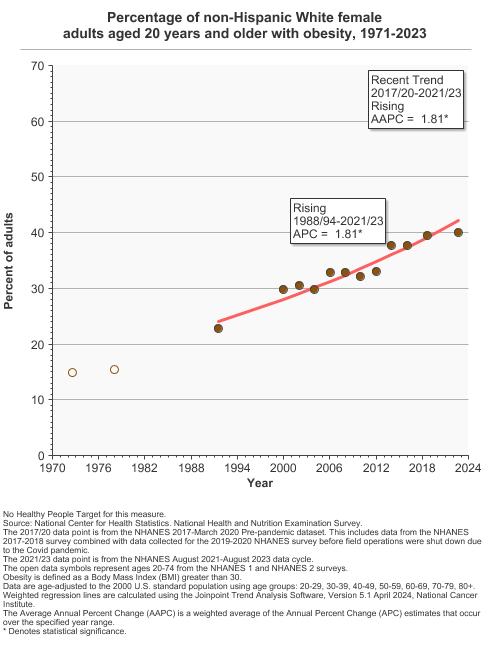
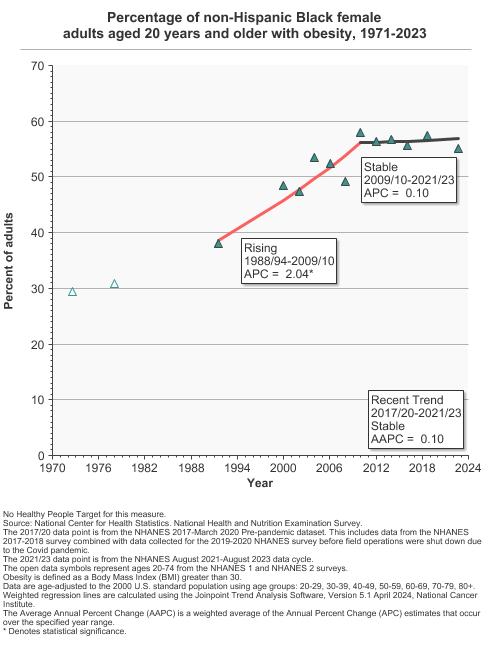
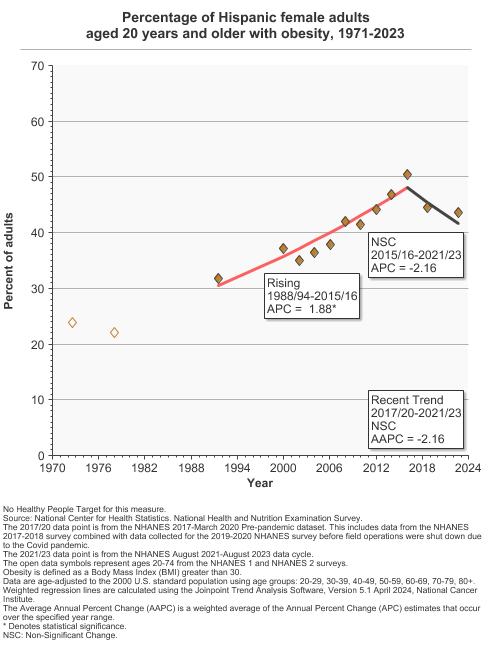
Percentage of females aged 20 years and older with obesity by race/ethnicity, 1971-2023 Overview Graph Detailed Trend Graphs Most Recent Estimates (2021 to 2023) Percent of adults 95% Confidence Interval 
All Races/Ethnicities 41.0 36.3 - 45.7 Non-Hispanic White 40.1 35.8 - 44.4 Non-Hispanic Black 55.1 48.3 - 62.0 Hispanic 43.7 35.0 - 52.4 The 2021 to 2023 data point is from the NHANES August 2021-August 2023 data cycle. - By Poverty Income Level
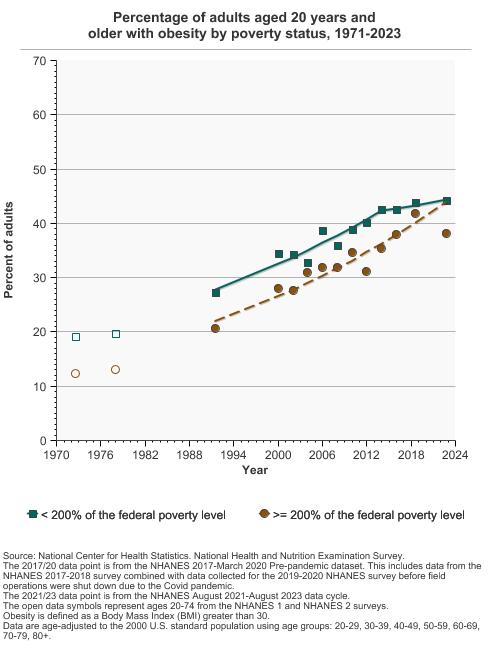
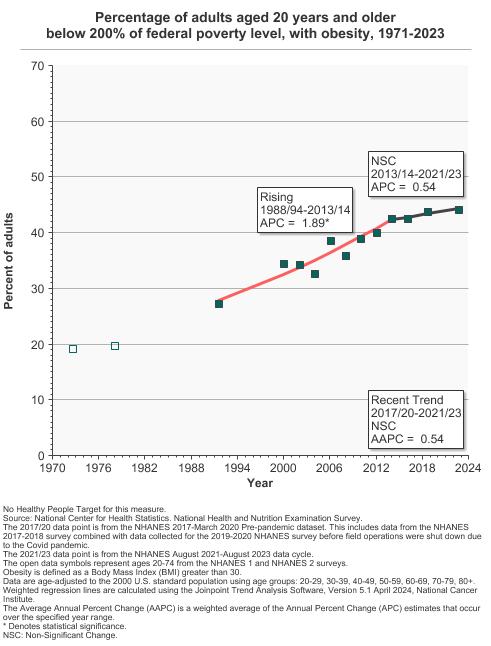
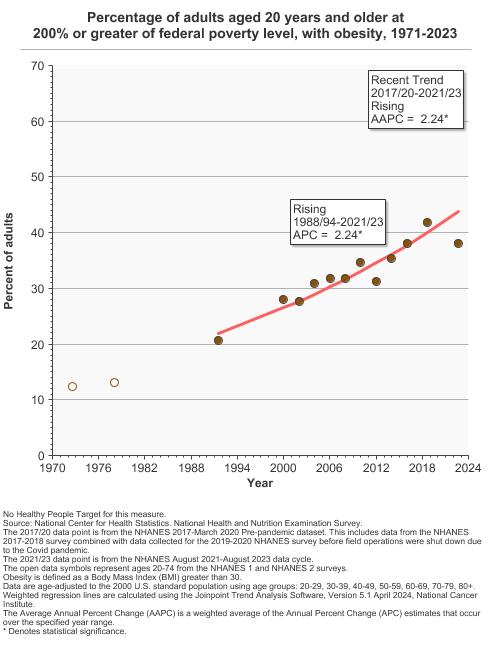
Percentage of adults aged 20 years and older with obesity by poverty status, 1971-2023 Overview Graph Detailed Trend Graphs Most Recent Estimates (2021 to 2023) Percent of adults 95% Confidence Interval 
< 200% of the federal poverty level 44.1 41.7 - 46.6 >= 200% of the federal poverty level 38.1 33.1 - 43.1 The 2021 to 2023 data point is from the NHANES August 2021-August 2023 data cycle. - By Education Level
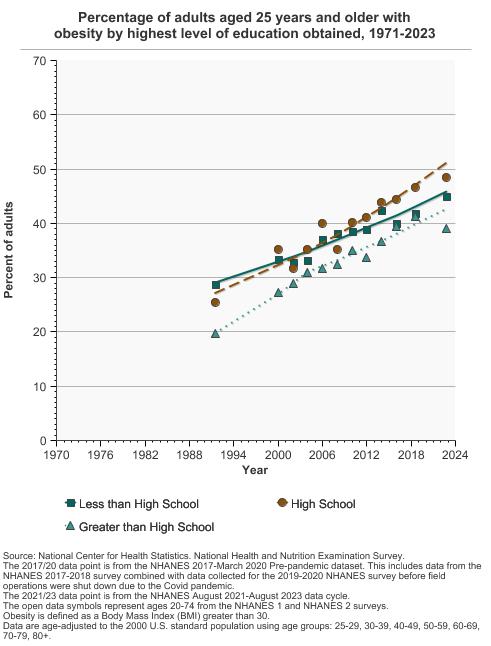
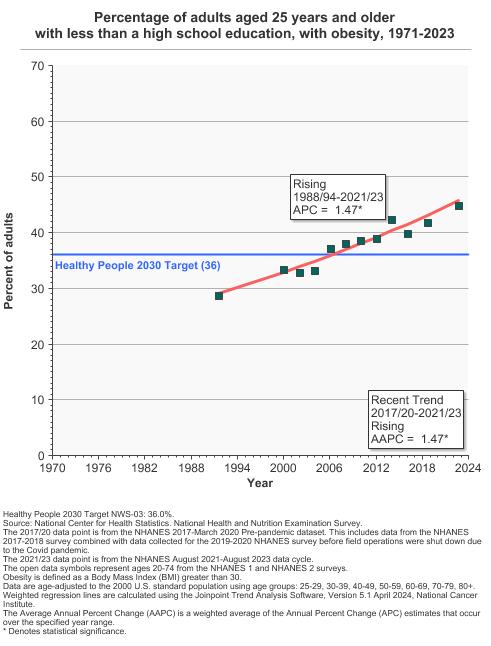
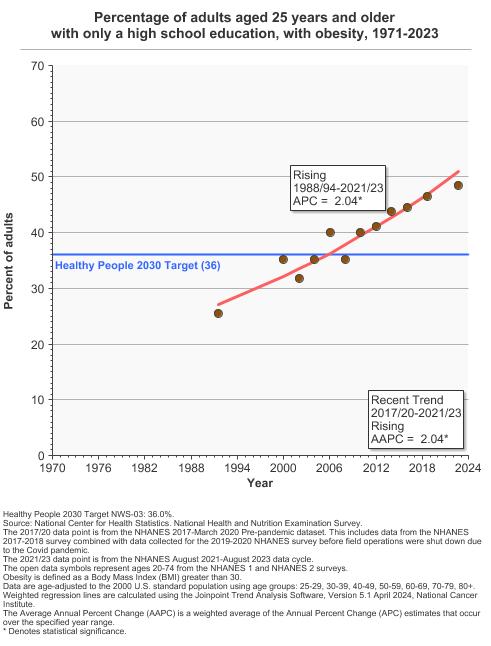
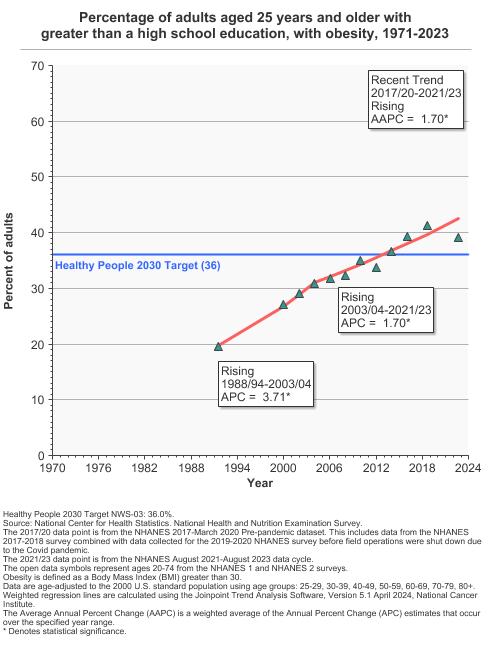
Percentage of adults aged 25 years and older with obesity by highest level of education obtained, 1971-2023 Overview Graph Detailed Trend Graphs Most Recent Estimates (2021 to 2023) Percent of adults 95% Confidence Interval 
Less than High School 44.9 37.4 - 52.5 High School 48.4 43.5 - 53.3 Greater than High School 39.1 34.5 - 43.6


Additional Information
- Obesity and Cancer. National Cancer Institute.
- ACS Guideline for Diet and Physical Activity. American Cancer Society.
- Body Weight and Cancer Risk. American Cancer Society.
- Obesity and Cancer. Centers for Disease Control and Prevention.
- Preventing Cancer. Centers for Disease Control and Prevention.
- Healthy Weight, Nutrition, and Physical Activity. Centers for Disease Control and Prevention.
- Obesity and Cancer. Centers for Disease Control and Prevention.
- Body Mass Index Table. National Heart, Lung, and Blood Institute.
- Chartbook on Healthy Living. Agency for Healthcare Research and Quality.
- Obesity Evidence-Based Programs Listing. National Cancer Institute.
- Obesity in Children and Adolescents: Screening (June 2017). U.S. Preventive Services Task Force.
- Weight Loss to Prevent Obesity-Related Morbidity and Mortality in Adults: Behavioral Interventions. U.S. Preventive Services Task Force.
- Clinical Practice Guideline for the Evaluation and Treatment of Children and Adolescents With Obesity. American Academy of Pediatrics.
- Diet, activity and cancer. World Cancer Research Fund and the American Institute for Cancer Research.
- Body fatness and weight gain. World Cancer Research Fund and American Institute for Cancer Research.
- Energy Balance and Body Fatness. World Cancer Research Fund and the American Institute for Cancer Research.
- Advancing Measurement for Childhood Obesity Workshop Series. National Collaborative on Childhood Obesity Research.
- Prevalence of Obesity and Severe Obesity Among Adults: United States, 2017–2018. Hales CM, Carroll MD, Fryar CD, Ogden CL. NCHS Data Brief, no 360. Hyattsville, MD: National Center for Health Statistics. 2020.
- Body Fatness and Cancer — Viewpoint of the IARC Working Group. Lauby-Secretan B, Scoccianti C, Loomis D, et al. N Engl J Med. 2016;375(8):794-798.
- Obesity and cancer risk: Emerging biological mechanisms and perspectives. Avgerinos KI, Spyrou N, Mantzoros CS, Dalamaga M. Metabolism. 2019; 92:121-135.
- Nutrition and physical activity cancer prevention guidelines, cancer risk, and mortality in the women’s health initiative. Thomson CA, McCullough ML, Wertheim BC, et al. Cancer Prev Res (Phila) 2014;1:42–53.
- 2018 Physical Activity Guidelines Advisory Committee Scientific Report. Part F. Chapter 5. Cardiometabolic Health and Prevention of Weight Gain. U.S. Department of Health and Human Services. F5-4 – F5-12.
- Obesity and Overweight. Centers for Disease Control and Prevention.
- Obesity Data and Statistics. Centers for Disease Control and Prevention.