On This Page:
- Background
- Measure
- Healthy People 2030 Target
- Data Source
- Trends and Most Recent Estimates
- Additional Information
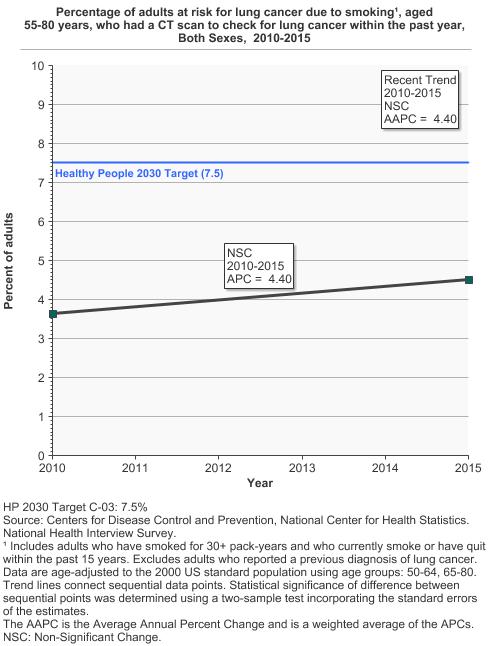
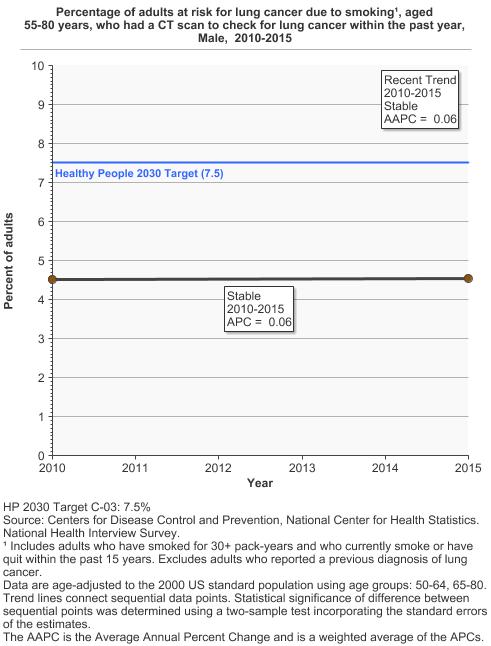
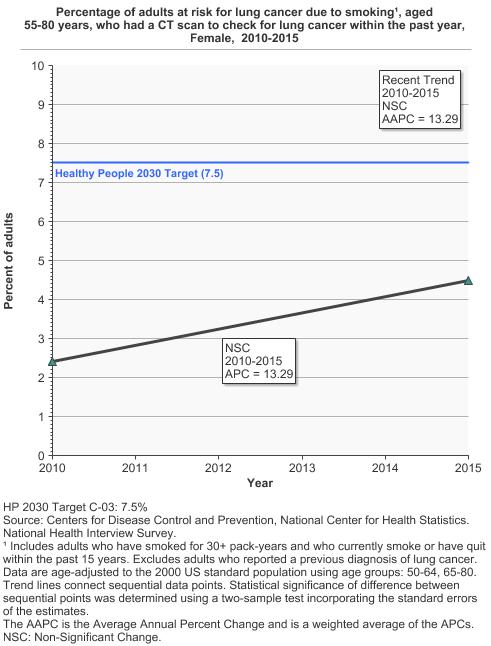
In 2015, 4.5% of adults aged 55-80 years who were at risk for lung cancer due to smoking had a CT scan to check for lung cancer within the past year.
Background
Lung cancer screening uses a type of chest computed tomography (CT), known as low radiation dose CT (LDCT), to create detailed pictures of the lungs. Doctors use lung cancer screening for early detection of disease in adults who currently or previously smoked and who do not have symptoms. Another name for LDCT is low-dose helical CT.
In 2013, the U.S. Preventive Services Task Force’s (USPSTF) recommended annual LDCT screening for lung cancer in adults aged 55 to 80 years who had a 30 pack-year smoking history or more and who currently smoked or had quit within the past 15 years. In March 2021, the USPSTF published revised guidelines and now recommends annual LDCT screening for lung cancer in adults aged 50 to 80 years who have a 20 pack-year smoking history or more and who currently smoke or have quit within the past 15 years.
Quitting smoking is the best way to reduce the risk of dying from lung cancer. Lung cancer screening is not a substitute for smoking cessation.
Measure
Percentage of adults at risk for lung cancer due to smoking, aged 55-80 years, who had a CT scan to check for lung cancer within the past year, by sex, race/ethnicity, income, education level, age, and smoking pack years.
Measurement challenges
We track lung cancer screening rates in U.S. adults using the National Health Interview Survey (NHIS), a large, national, in-person survey in which people are asked about their health behaviors and the medical care they receive (see Data Source, below). Note that the most recent estimate available through the NHIS is 2015, which is nearly a decade ago. This likely does not accurately predict current U.S. lung cancer screening rates Questions about lung cancer screening use are being asked on the 2024 NHIS, and updated findings will be available in 2025.
There are important limitations to surveys like the NHIS that impact what information we can accurately collect and how confident we can be in the findings. Studies have found that certain types of healthcare survey questions can be difficult for people to clearly understand and answer, and it is easy for some questions to be misinterpreted.
National guidelines state that only individuals with extensive cigarette smoking experience be screened for lung cancer, and this report strives to only include eligible individuals in our measures. One challenge we face is calculation of an accurate measure of lifetime smoking, which is needed to determine whether someone is eligible for screening. Cigarette smoking behaviors can vary from day to day and year to year, yet our survey does not capture such time-specific information; instead, we collect information about average lifetime smoking. In addition, it can be difficult for an individual to accurately recall how many cigarettes he or she smoked a day in years past. Furthermore, an individual may underreport amount smoked given the stigma associated with the activity.
In the case of lung cancer screening, it can be challenging to determine by self-report alone if an individual received an LDCT for the purposes of looking for asymptomatic, previously undetected cancer or precancers (i.e., for screening purposes), or to follow up on symptoms or suspicious findings from a prior test (i.e., for diagnostic purposes). Patients may not know the difference between a screening LDCT and a diagnostic LDCT. Therefore, we ask individuals whether they received an exam to check for lung cancer, and our measures include both screening and diagnostic LDCTs. Though people may have reported LDCT exams that occurred for surveillance following lung cancer diagnosis and treatment, as of 2021 we exclude individuals previously diagnosed with lung cancer from our measurement of lung cancer screening rates, thus minimizing inclusion of surveillance exams. We also exclude individuals who report having an exam to check for lung cancer but then report that they had no exams in the last three years.
The challenges noted above can lead to the overreporting and underreporting of smoking and lung cancer screening; therefore, it is difficult to know whether our measures of lung cancer screening in eligible individuals are overestimates or underestimates. We do not believe that errors are extensive, and as such, we feel that our measures provide good estimates of the true magnitude of lung cancer screening. Furthermore, these data are widely considered to be the best national data on lung cancer screening and are used frequently to track lung cancer screening rates in the U.S.
In addition to the challenges noted above, lung cancer screening is somewhat unique among cancer screening modalities because it does not apply to everyone in a specified age range, but rather only to adults in the age range who smoked heavily currently or formerly. This means that the denominator of eligible individuals is considerably smaller than that for other screening modalities. Thus the resultant estimates from NHIS of those screened among the eligible population will have considerably larger standard errors (especially relative to the size of the estimates) than for other cancer sites, and should be interpreted with caution.
Data Source
Centers for Disease Control and Prevention, National Center for Health Statistics, National Health Interview Survey, 2010–2015.
Please note that these data were collected while the 2013 USPSTF recommendations were in place. Therefore, the estimates include adults aged 55 to 80 who had a 30 pack-year smoking history or more and who currently smoked or had quit within the past 15 years.
Refer to the Data Sources page for more information about data collection years 2019+.
Healthy People 2030 Target
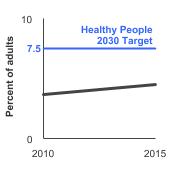
Increase to 7.5 percent the proportion of adults aged 55 to 80 years who receive lung cancer screening based on the 2013 USPSTF recommendations. Recommendations are restricted to individuals who have never had lung cancer, have smoked at least 30 pack-years, and if not currently smoking, have quit no more than 15 years ago.
Healthy People 2030 is a set of goals set forth by the Department of Health and Human Services.
Note: Goals are indicated as blue line on Detailed Trend Graphs.
Trends and Most Recent Estimates
- By Sex
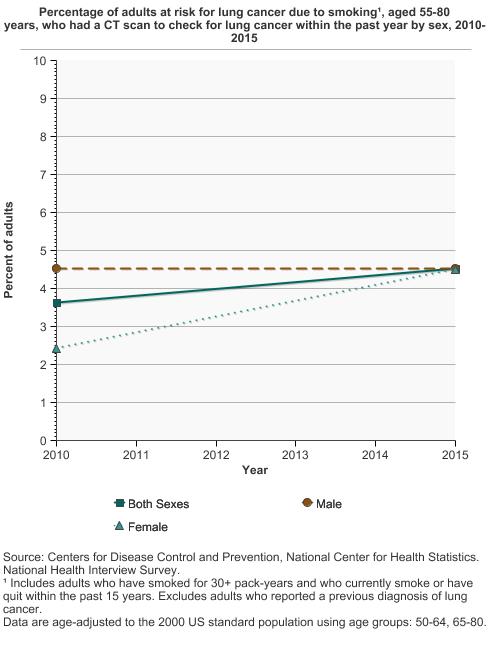
Percentage of adults at risk for lung cancer due to smoking¹, aged 55-80 years, who had a CT scan to check for lung cancer within the past year by sex, 2010-2015 Overview Graph Detailed Trend Graphs Most Recent Estimates (2015) Percent of adults 95% Confidence Interval 

Both Sexes 
4.5 2.8 - 7.2 Male 4.5 2.7 - 7.4 Female 4.5 1.8 - 10.5 ¹ Includes adults who have smoked for 30+ pack years and who currently smoke or have quit within the past 15 years. Excludes adults who reported a previous diagnosis of lung cancer. - By Race/Ethnicity
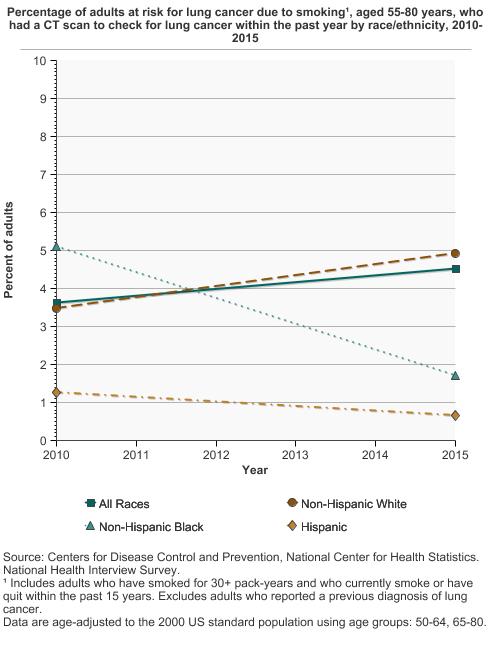
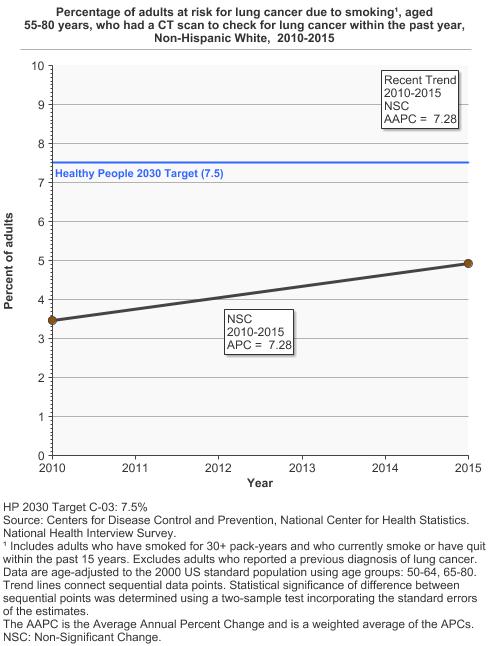
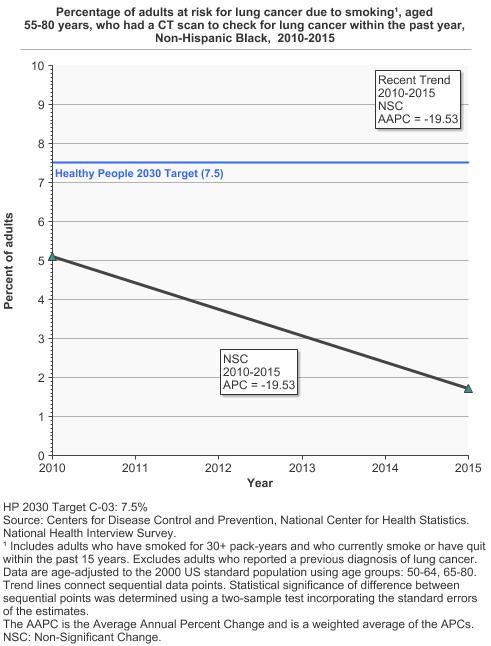
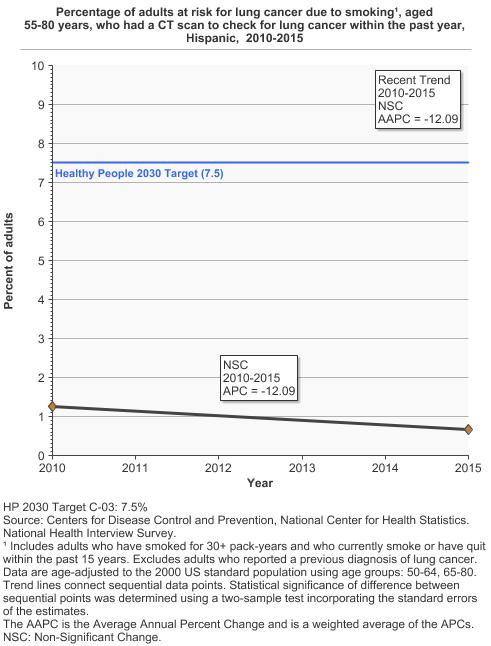
Percentage of adults at risk for lung cancer due to smoking¹, aged 55-80 years, who had a CT scan to check for lung cancer within the past year by race/ethnicity, 2010-2015 Overview Graph Detailed Trend Graphs Most Recent Estimates (2015) Percent of adults 95% Confidence Interval 
All Races 4.5 2.8 - 7.2 Non-Hispanic White 4.9 3.0 - 8.0 Non-Hispanic Black 1.7 0.6 - 5.0 Hispanic 0.7 0.1 - 4.6 ¹ Includes adults who have smoked for 30+ pack years and who currently smoke or have quit within the past 15 years. Excludes adults who reported a previous diagnosis of lung cancer. - By Poverty Income Level
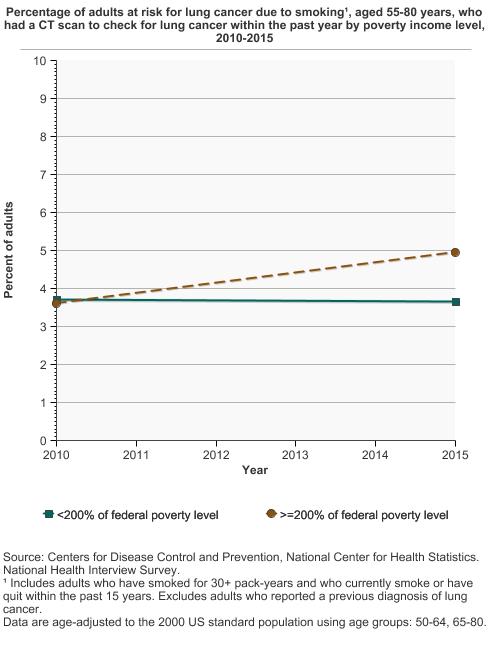
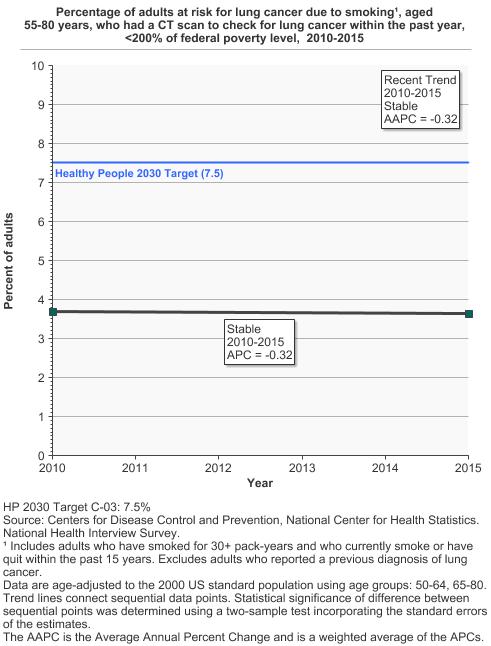
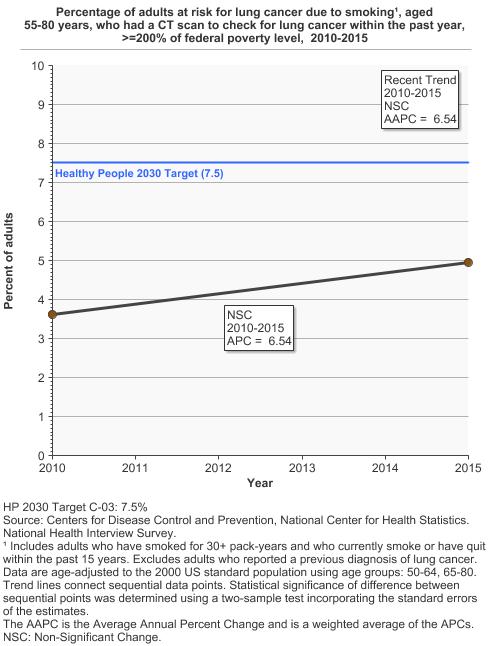
Percentage of adults at risk for lung cancer due to smoking¹, aged 55-80 years, who had a CT scan to check for lung cancer within the past year by poverty income level, 2010-2015 Overview Graph Detailed Trend Graphs Most Recent Estimates (2015) Percent of adults 95% Confidence Interval 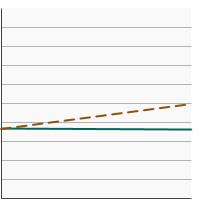
<200% of federal poverty level 3.6 2.0 - 6.5 >=200% of federal poverty level 5.0 2.7 - 9.1 ¹ Includes adults who have smoked for 30+ pack years and who currently smoke or have quit within the past 15 years. Excludes adults who reported a previous diagnosis of lung cancer. - By Education Level
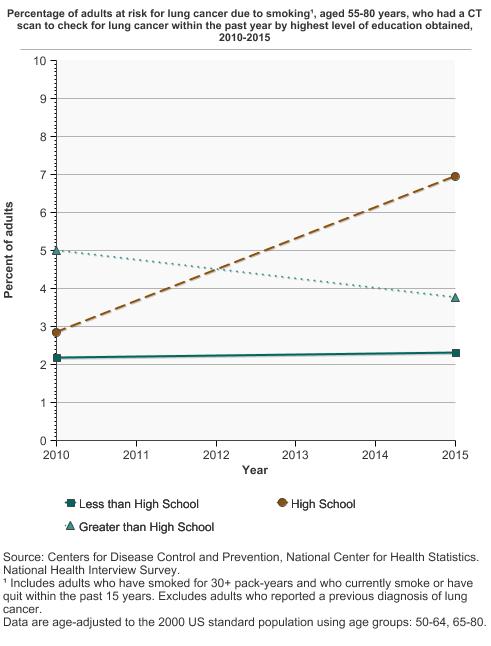
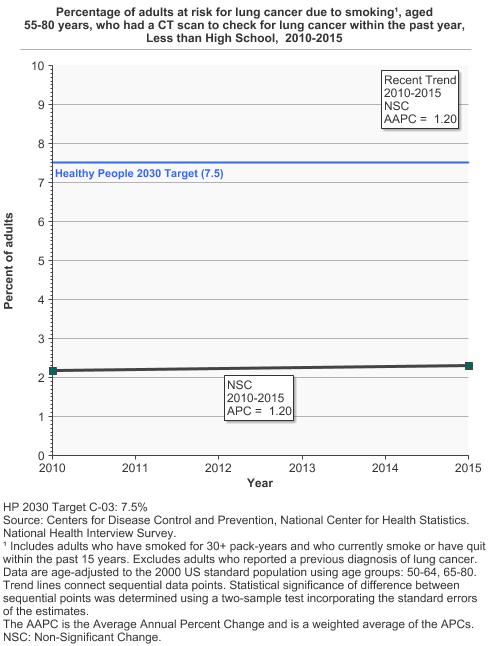
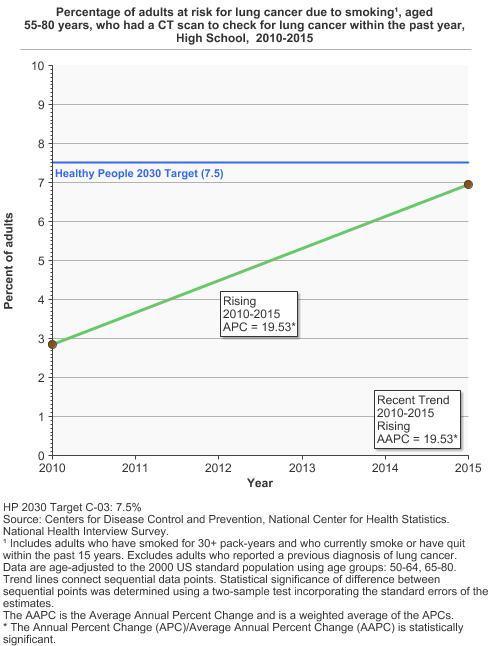
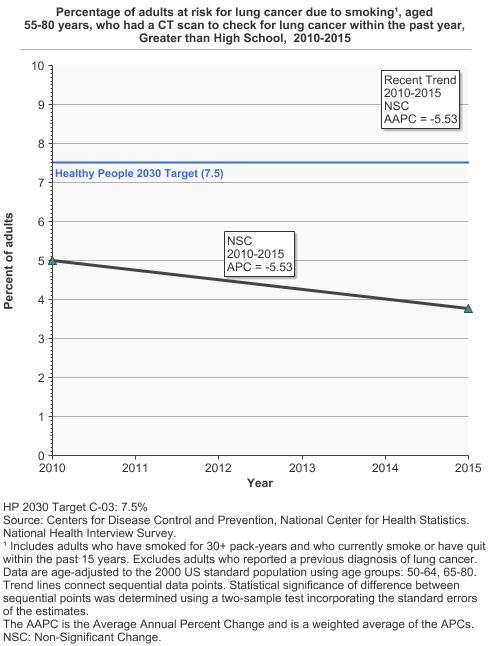
Percentage of adults at risk for lung cancer due to smoking¹, aged 55-80 years, who had a CT scan to check for lung cancer within the past year by highest level of education obtained, 2010-2015 Overview Graph Detailed Trend Graphs Most Recent Estimates (2015) Percent of adults 95% Confidence Interval 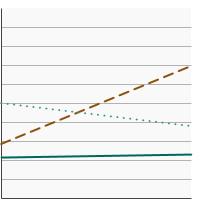
Less than High School 2.3 1.1 - 4.7 High School 7.0 4.0 - 11.8 Greater than High School 3.8 1.4 - 9.6 ¹ Includes adults who have smoked for 30+ pack years and who currently smoke or have quit within the past 15 years. Excludes adults who reported a previous diagnosis of lung cancer. - By Age
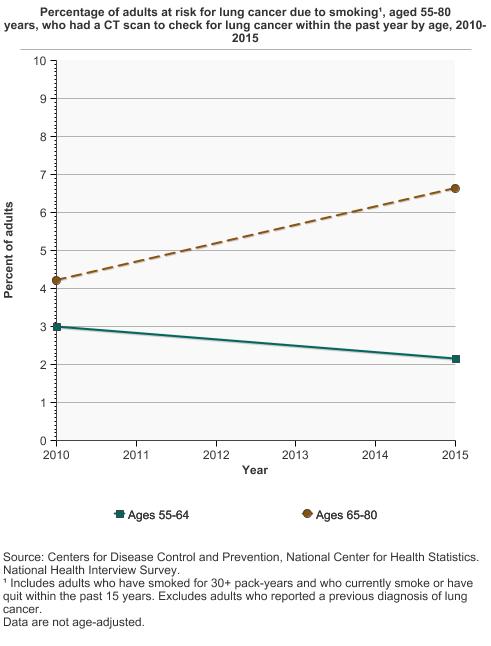
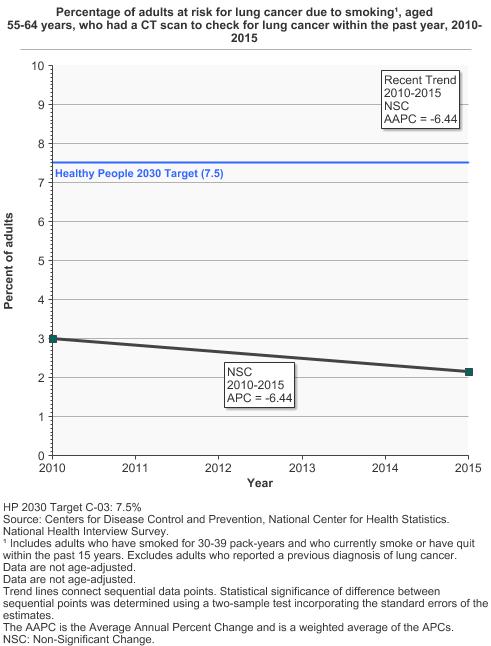
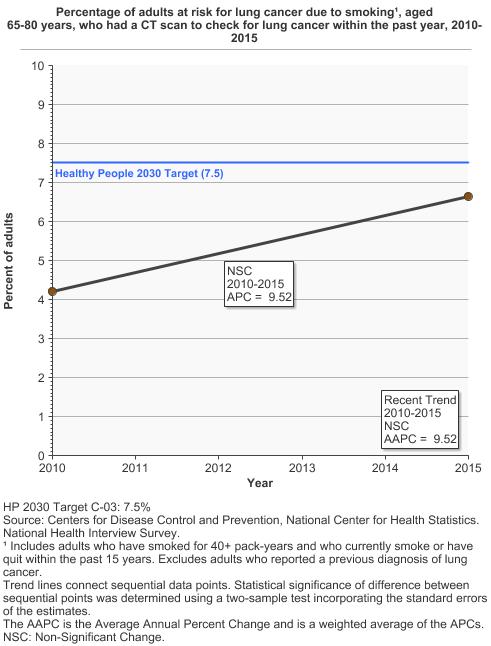
Percentage of adults at risk for lung cancer due to smoking¹, aged 55-80 years, who had a CT scan to check for lung cancer within the past year by age, 2010-2015 Overview Graph Detailed Trend Graphs Most Recent Estimates (2015) Percent of adults 95% Confidence Interval 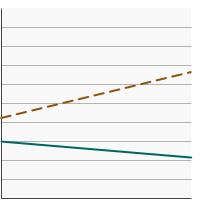
Ages 55-64 2.2 1.2 - 3.8 Ages 65-80 6.6 3.7 - 11.7 ¹ Includes adults who have smoked for 30+ pack years and who currently smoke or have quit within the past 15 years. Excludes adults who reported a previous diagnosis of lung cancer. - By Smoking Pack Years
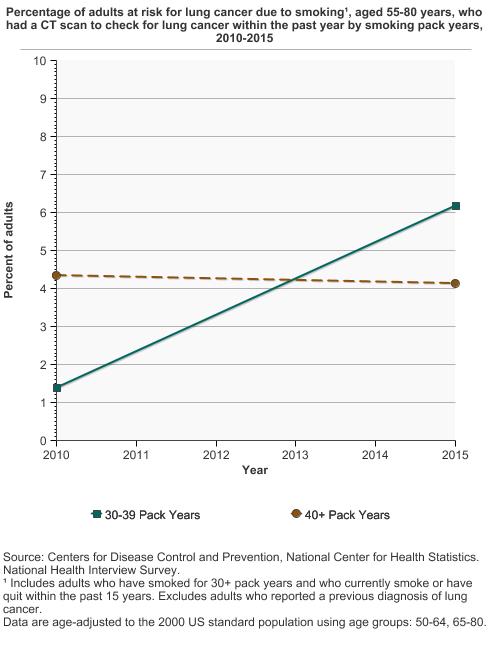
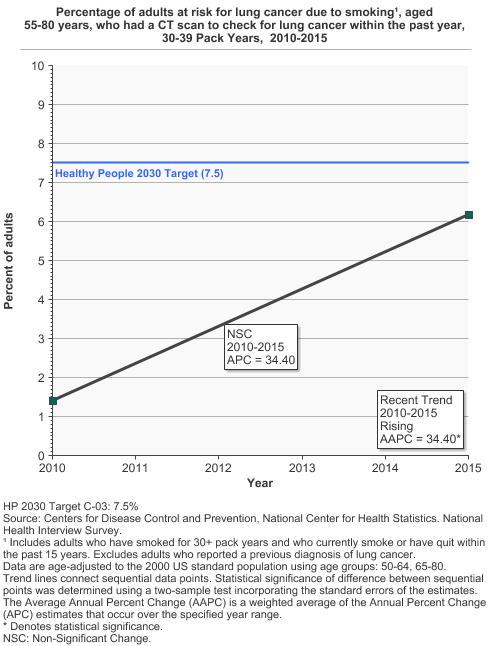
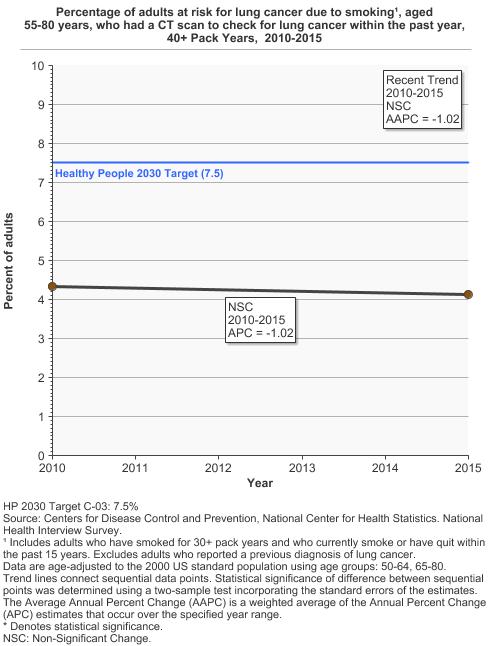
Percentage of adults at risk for lung cancer due to smoking¹, aged 55-80 years, who had a CT scan to check for lung cancer within the past year by smoking pack years, 2010-2015 Overview Graph Detailed Trend Graphs Most Recent Estimates (2015) Percent of adults 95% Confidence Interval 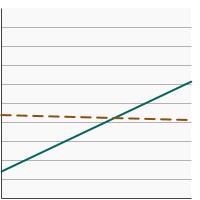
30-39 Pack Years 6.2 2.5 - 14.6 40+ Pack Years 4.1 2.3 - 7.2 ¹ Includes adults who have smoked for 30+ pack years and who currently smoke or have quit within the past 15 years. Excludes adults who reported a previous diagnosis of lung cancer.

Additional Information
- Lung Cancer. National Cancer Institute.
- Lung Cancer Screening (PDQ®)-Patient Version. National Cancer Institute.
- Smokefree.gov. National Cancer Institute.
- Is Lung Cancer Screening Right for Me?. American Lung Association.
- Lung Cancer Screening. Centers for Disease Control and Prevention.
- Tips from Former Smokers: How to Quit Smoking. Centers for Disease Control and Prevention.
- Screening for Lung Cancer with Low Dose Computed Tomography (LDCT). Centers for Medicare & Medicaid Services.
- Screening for Lung Cancer. U.S. Department of Veterans Affairs
- Lung Cancer Screening (PDQ®)-Health Professional Version. National Cancer Institute
- Quitting Smoking. National Cancer Institute.
- Help Others Quit. Smokefree.gov.
- A Practical Guide to Help Your Patients Quit Using Tobacco. Centers for Disease Control and Prevention.
- Lung Cancer: Screening. U.S. Preventive Services Task Force.
- Community-based Lung Cancer Screening Results in Relation to Patient and Radiologist Characteristics: The PROSPR Consortium. Burnett-Hartman AN, Carroll NM, Honda SA, et al. Ann Am Thorac Soc. 2022 Mar;19(3):433-441.
- Cost-Effectiveness of Smoking Cessation Interventions in the Lung Cancer Screening Setting: A Simulation Stud. Cadham CJ, Cao P, Jayasekera J, et al. J Natl Cancer Inst. 2021 Aug 2;113(8):1065-1073.
- Smoking Cessation Interventions in the Lung Cancer Screening Setting: A Randomized Clinical Trial. Cinciripini PM, Minnix JA, Kypriotakis G, et al. JAMA Intern Med. 2025 Jan 13. Reduced lung-cancer mortality with volume CT screening in a randomized trial. de Koning HJ, van der Aalst CM, de Jong PA, et al. N Engl J Med. 2020;382(6):503-513.
- The Optimizing Lung Screening Trial (WF-20817CD): Multicenter Randomized Effectiveness Implementation Trial to Increase Tobacco Use Cessation for Individuals Undergoing Lung Screening. Foley KL, Dressler EV, Weaver KE, et al. Chest. 2023 Aug;164(2):531-543.
- Optimizing Longitudinal Tobacco Cessation Treatment in Lung Cancer Screening: A Sequential, Multiple Assignment, Randomized Trial. Fu SS, Rothman AJ, Vock DM, et al. JAMA Netw Open. 2023;6(8):e2329903.
- Screening for Lung Cancer With Low-Dose Computed Tomography: Updated Evidence Report and Systematic Review for the US Preventive Services Task Force. Jonas DE, Reuland DS, Reddy SM, et al. JAMA. 2021 Mar 9;325(10):971–987.
- Lung Cancer Screening and Smoking Cessation Clinical Trials. SCALE (Smoking Cessation within the Context of Lung Cancer Screening) Collaboration. Joseph AM, Rothman AJ, Almirall D, et al. Am J Respir Crit Care Med. 2018 Jan 15;197(2):172-182.
- Smoking-related health beliefs and smoking behavior in the National Lung Screening Trial. Kaufman AR, Dwyer LA, Land SR et al. Addict Behav 2018;84:27-32.
- Impact of Joint Lung Cancer Screening and Cessation Interventions Under the New Recommendations of the U.S. Preventive Services Task Force. Meza R, Cao P, Jeon J, et al. J Thorac Oncol. 2022 Jan;17(1):160-166.
- Evaluation of the Benefits and Harms of Lung Cancer Screening With Low-Dose Computed Tomography: Modeling Study for the US Preventive Services Task Force. Meza R, Jeon J, Toumazis I, et al. JAMA. 2021 Mar 9;325(10):988–997.
- Characteristics of Persons Screened for Lung Cancer in the United States : A Cohort Study. Silverstri GA, Goldman L, Burleson L, et al. Ann Intern Med. 2022 Oct 11;175(11):1501-1505.
- A Randomized Trial of Telephone-Based Smoking Cessation Treatment in the Lung Cancer Screening Setting. Taylor KL, Williams RM, Li T, et al. J Natl Cancer Inst. 2022 Oct 6;114(10):1410-1419.
- Strategies to deliver smoking cessation interventions during targeted lung health screening - a systematic review and meta-analysis. Williams PJ, Philip KE, Alghamdi SM, et al. Chron Respir Dis. 2023 Jan-Dec;20.
- SEER Cancer Stat Facts: Lung and Bronchus Cancer. National Cancer Institute.
- Use of lung cancer screening tests in the United States: results from the 2010 National Health Interview Survey. Doria-Rose VP, White MC, Klabunde CN et al. Cancer Epidemiol Biomarkers Prev 2012;21(7):1049-59.
- Lung Cancer Screening With Low-Dose Computed Tomography in the United States-2010 to 2015. Jemal A, Fedewa SA. JAMA Oncol 2017;3(9):1278-1281.