On This Page:
- Background
- Measure
- Healthy People 2030 Target
- Data Source
- Trends and Most Recent Estimates
- Related Cancers
- Additional Information
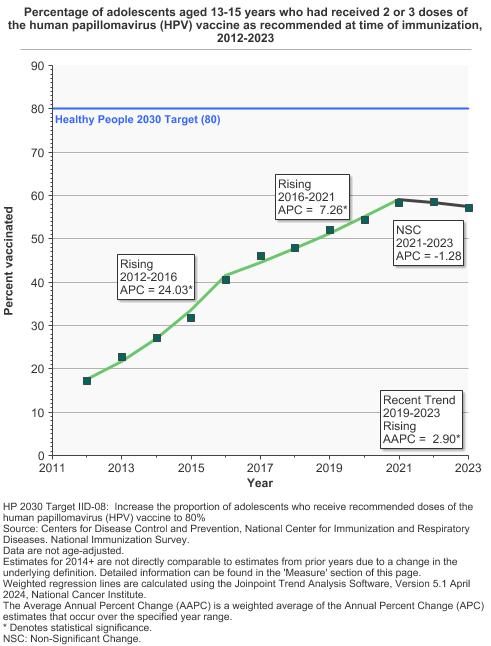
In 2023, 57.3% of adolescents aged 13-15 had received human papilloma virus vaccine as recommended (HPV).
Background
Human papillomavirus (HPV) is a common virus, some types of which spread through sexual contact. Some sexually transmitted HPVs can cause genital warts, whereas others, called high-risk or oncogenic HPVs, can cause cancer. High-risk HPVs cause virtually all cervical cancers, most anal cancers, and some vaginal, vulvar, penile, and oropharyngeal cancers. Many HPV infections go away on their own within 1 to 2 years. However, infections that last for many years increase a person’s risk of developing cancer.
HPV vaccines work like other immunizations that guard against viral infections, by creating an immune response that results in resistance to a specific disease. According to the Centers for Disease Control and Prevention (CDC), both males and females aged 11 to 12 years should get vaccinated. People aged 9 to 26 years are recommended to receive the vaccine. People aged 27 to 45 years may decide to get vaccinated after talking with their doctors about their risks for new HPV infections.
Because the vaccines do not protect against all HPV infections that cause cervical cancer, it is important for vaccinated women to continue cervical cancer screening.
Measure
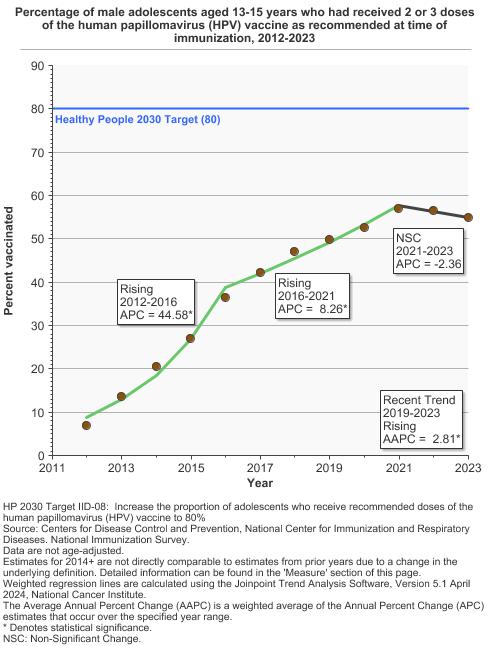
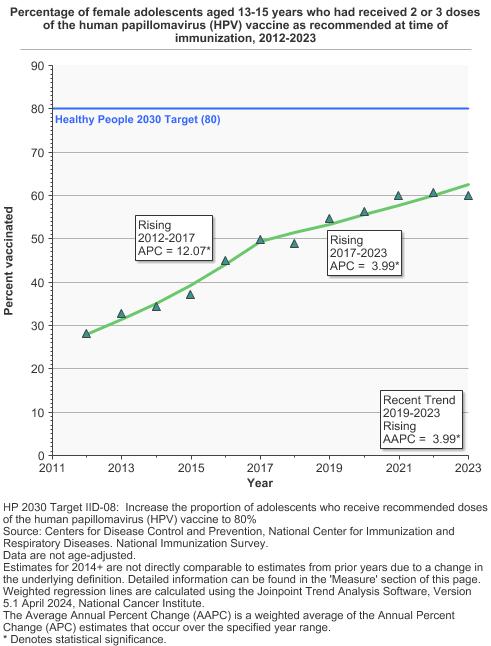
Percentage of adolescents aged 13-15 years who had received 2 or 3 doses of the human papillomavirus (HPV) vaccine as recommended at time of immunization.
From 2008-2011, the recommendation was for a 3-dose series for females only. From 2011-2016, the recommendation included both males and females, using a 3-dose series. These recommendations came from the CDC’s Advisory Committee on Immunization Practices (ACIP). Beginning in 2016, ACIP recommended males and females who begin their vaccination series before age 15 receive a 2-dose rather than a 3-dose series.
The National Immunization Survey Teen (NIS-Teen) vaccination coverage estimates are based on provider-reported vaccination histories from adolescents with adequate provider data (APD). NIS-Teen implemented a revised APD definition in 2014, thus estimates in 2014 and after are not directly comparable to those from prior years. However, the change in APD definition does not impact overall vaccination coverage trends; vaccines routinely recommended during adolescence, such as HPV, were less affected than vaccines routinely recommended in childhood. Additional information on implementation of the revised APD definition and assessment of impact on vaccine coverage estimates is available on the National Immunization Survey-Teen (NIS-Teen): Revised Definition of Adequate Provider Data (APD) website, published by the CDC.
Data Source
Centers for Disease Control and Prevention, The National Immunization Surveys (NIS), 2008-2023.
Healthy People 2030 Target
- Increase to 80 percent the proportion of adolescents who receive recommended doses of the human papillomavirus (HPV) vaccine.
Healthy People 2030 is a set of goals set forth by the Department of Health and Human Services.
Note: Goals are indicated as blue line on Detailed Trend Graphs.
Trends and Most Recent Estimates
- By Sex
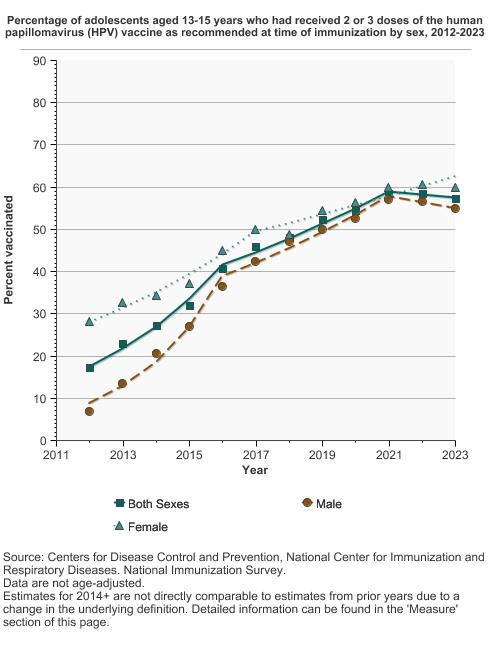
Percentage of adolescents aged 13-15 years who had received 2 or 3 doses of the human papillomavirus (HPV) vaccine as recommended at time of immunization by sex, 2012-2023 Overview Graph Detailed Trend Graphs Most Recent Estimates (2023) Percent vaccinated 95% Confidence Interval 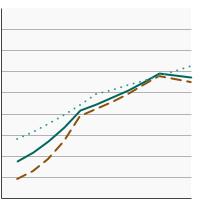

Both Sexes 
57.3 55.3 - 59.4 Male 54.9 51.9 - 57.8 Female 59.9 57.0 - 62.7 - By Race/Ethnicity
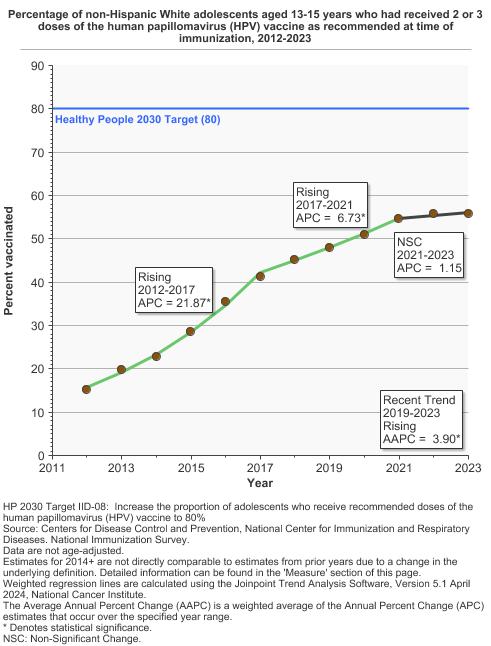
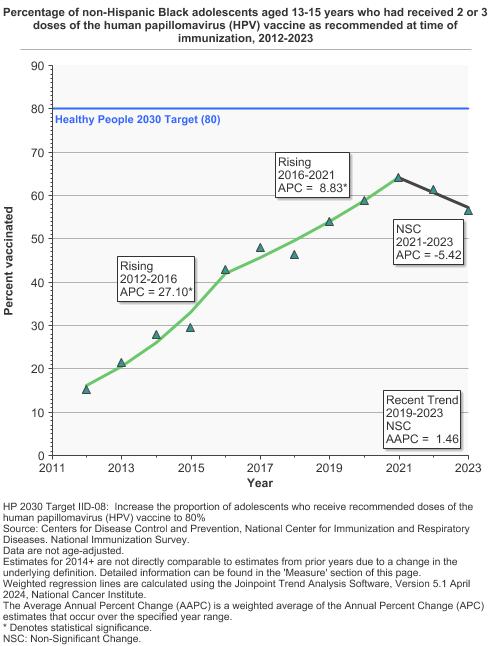
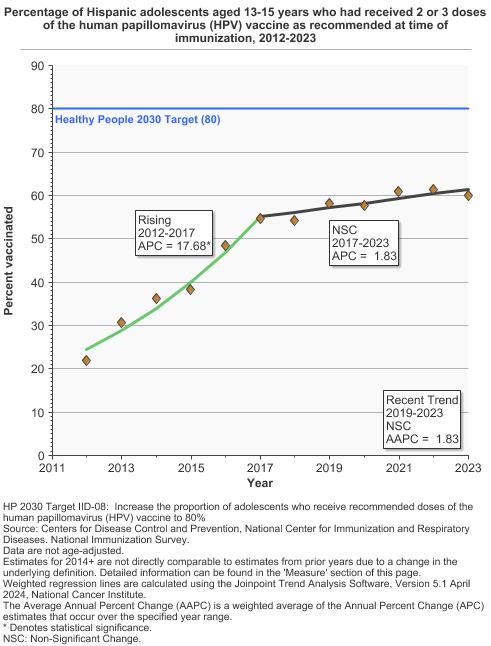
Percentage of adolescents aged 13-15 years who had received 2 or 3 doses of the human papillomavirus (HPV) vaccine as recommended at time of immunization by race/ethnicity, 2012-2023 Overview Graph Detailed Trend Graphs Most Recent Estimates (2023) Percent vaccinated 95% Confidence Interval 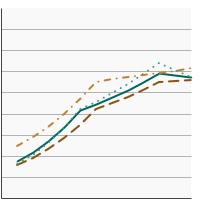
All Races 57.3 55.3 - 59.4 Non-Hispanic White 55.8 53.4 - 58.2 Non-Hispanic Black 56.7 50.8 - 62.3 Hispanic 59.9 54.7 - 64.9 - By Poverty Income Level
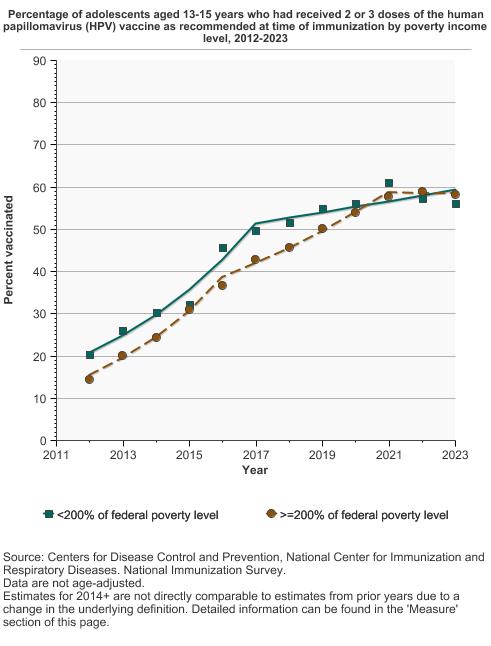
Percentage of adolescents aged 13-15 years who had received 2 or 3 doses of the human papillomavirus (HPV) vaccine as recommended at time of immunization by poverty income level, 2012-2023 Overview Graph Detailed Trend Graphs Most Recent Estimates (2023) Percent vaccinated 95% Confidence Interval 
<200% of federal poverty level 56.1 52.5 - 59.6 >=200% of federal poverty level 58.3 55.8 - 60.7


Additional Information
- HPV and Cancer. National Cancer Institute.
- Human Papillomavirus (HPV) Vaccines. National Cancer Institute.
- Human Papillomavirus (HPV) Vaccination & Cancer Prevention. Centers for Disease Control and Prevention.
- Cervical Cancer Prevention (PDQ®). National Cancer Institute.
- HPV Vaccination Evidence-Based Programs Listing. National Cancer Institute.
- What Works Fact Sheet: Increasing Appropriate Vaccination. Centers for Disease Control and Prevention.
- Human Papillomavirus Vaccination for Adults: Updated Recommendations of the Advisory Committee on Immunization Practices. Meites E, Szilagyi PG, Chesson HW, et al. MMWR. 2019;68(32);698-702.
- Use of a 2-Dose Schedule for Human Papillomavirus Vaccination — Updated Recommendations of the Advisory Committee on Immunization Practices. Meites E, Kempe A, Markowitz LE. MMWR. 2016;65(49);1405-8.
- Population-level impact and herd effects following the introduction of human papillomavirus vaccination programmes: updated systematic review and meta-analysis. Drolet M, Bénard É, Pérez N, et al. Lancet 394 (10197): 497-509, 2019.
- Immunogenicity of the 9-Valent HPV Vaccine Using 2-Dose Regimens in Girls and Boys vs a 3-Dose Regimen in Women. Iversen OE, Miranda MJ, Ulied A, et al. JAMA 316 (22): 2411-2421, 2016.
- A 9-valent HPV vaccine against infection and intraepithelial neoplasia in women. Joura EA, Giuliano AR, Iversen OE, et al. N Engl J Med 372 (8): 711-23, 2015.
- Efficacy of fewer than three doses of an HPV-16/18 AS04-adjuvanted vaccine: combined analysis of data from the Costa Rica Vaccine and PATRICIA trials. Kreimer AR, Struyf F, Del Rosario-Raymundo MR, et al. Lancet Oncol 16 (7): 775-86, 2015
- HPV Vaccination and the Risk of Invasive Cervical Cancer. Lei J, Ploner A, Elfström KM, et al. N Engl J Med 383 (14): 1340-1348, 2020
- National, Regional, State, and Selected Local Area Vaccination Coverage Among Adolescents Aged 13-17 Years – United States, 2018. Walker TY, Elam-Evans LD, Yankey D, et al. Centers for Disease Control and Prevention. MMWR 2019;68(33):718–723.
- Health Information National Trends Survey. National Cancer Institute.
- Behavioral Risk Factor Surveillance System: Prevalence Data & Data Analysis Tools. Centers for Disease Control and Prevention, National Center for Chronic Disease Prevention and Health Promotion.
- National Health Interview Survey. Centers for Disease Control and Prevention, National Center for Health Statistics.