On This Page:
- Background
- Measure
- Healthy People 2030 Target
- Data Source
- Trends and Most Recent Estimates
- Additional Information
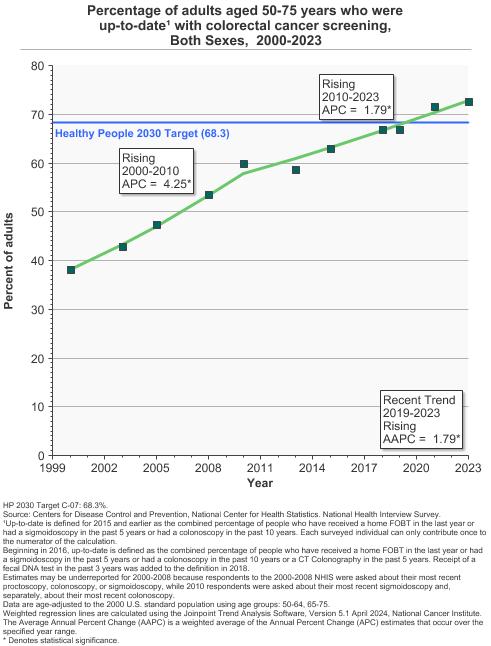
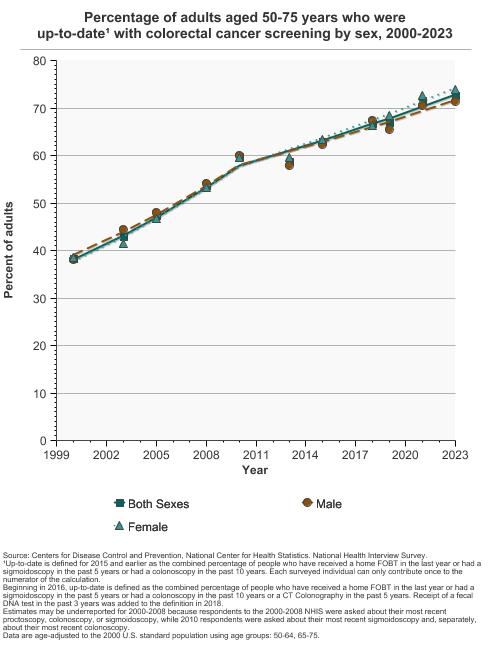
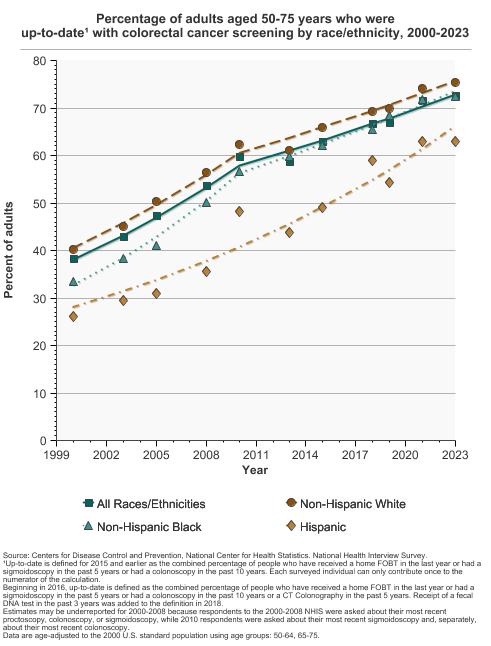
In 2023, 72.6% of adults aged 50-75 had received colorectal cancer screening based on the most recent guidelines.
Background
There are multiple approaches used to screen for colorectal cancer. They can be divided into stool-based tests (fecal occult blood testing [FOBT], fecal immunochemical testing [FIT], stool DNA testing [FIT-DNA]) and optical or visualization tests (sigmoidoscopy, colonoscopy, virtual colonoscopy [CT-colonography]). These screening tests can detect colorectal cancer prior to symptoms, which, when followed by timely treatment, can reduce deaths due to the disease.
In 2016, the U.S. Preventive Services Task Force (USPSTF) recommended screening for colorectal cancer for adults aged 50 to 75 years, and that adults aged 76 to 85 years should make an individual decision about screening. In May 2021, the USPSTF updated their guidance to lower the recommended screening start age to 45 years. This was based on evidence indicating a trend for increasing risk of colorectal cancer in adult birth cohorts younger than 50 years and statistical modeling suggesting that starting at age 45 years may increase life years gained compared to 50 years.
Measure
Optical or visualization screening tests
Colonoscopy - A procedure where a doctor looks into the rectum and the entire colon using a flexible narrow tube to identify colorectal cancer or precancerous polyps. Used not only as a screening test, colonoscopies are also used as a diagnostic procedure to follow up after positive results from a fecal occult blood test (FOBT) or fecal immunochemical test (FIT), fecal DNA test, sigmoidoscopy, or CT colonography. The USPSTF suggests a screening colonoscopy once every 10 years.
Computed tomography (CT) colonography (otherwise known as a virtual colonoscopy) - Produces a three-dimensional image of the colon which your doctor examines for colorectal cancer and precancerous polyps. The USPSTF suggests CT colonography once every 5 years.
Sigmoidoscopy - A procedure where a doctor looks into the rectum and part of the colon using a flexible narrow tube to identify colorectal cancer or precancerous polyps. The USPSTF suggests sigmoidoscopy once every 5 years, or once every 10 years when conducted along with FIT every year.
Stool-based screening tests
Fecal occult blood test (FOBT) and fecal immunochemical test (FIT) - These tests identify hidden blood in the stool, which can be a sign of cancer. The USPSTF suggests FOBT or FIT annually, using a home-based kit.
Fecal DNA test – In addition to checking for hidden blood in the stool like a FIT, this test also looks for abnormal genetic material that may be a sign of colorectal cancer. The USPSTF suggests fecal DNA testing at least every 3 years.
Measurement challenges
We track colorectal cancer screening rates in the U.S. using a large, national, in-person survey in which people are asked about their health behaviors and the medical care they receive (see Data Source, below). There are important limitations to this method that impact what information we can accurately collect and how confident we can be in the findings. Studies have found that certain types of healthcare survey questions can be difficult for people to clearly understand and answer, and it is easy for some questions to be misinterpreted.
In the case of colorectal screening, it may be challenging to determine by self-report alone if a colonoscopy was received for screening purposes, i.e., to look for asymptomatic, previously undetected cancer, or for diagnostic purposes, i.e., as a follow up on symptoms or suspicious findings from a prior test. It can also be difficult to determine by self-report alone which type of colorectal cancer screening test a person received, as several testing options appear similar to the person experiencing them. People may also not always accurately recall the specific time they received a particular test. Additionally, cancer screening is looking for cancer before a person has symptoms, when they are not known to have had that specific cancer type before. Looking for new or recurrent asymptomatic cancer in a person previously diagnosed and treated for that cancer type represents a different type of testing known as surveillance testing.
Options for colorectal cancer screening have increased over time, which results in a greater likelihood for missing or incomplete self-reported information about the screening tests people received. Different approaches by researchers for handling this missing information can result in somewhat varied estimates presented for up-to-date colorectal cancer screening status, depending on publication.
Our measure captures general receipt of a colorectal cancer screening test (yes/no) more accurately than its underlying purpose or the specific screening test received, and the population may include those with a prior diagnosis of colorectal cancer. This serves as a reasonable approximation of the true U.S. colorectal cancer screening rate, but the measure is not perfectly comparing the actual frequency of people’s use of colorectal cancer screening to national recommendations.
Even though the National Health Interview Survey colorectal cancer screening measures have limitations, it is the best nationally representative data we have available to assess colorectal cancer screening rates. It is frequently used by governmental and other organizations to track screening use over time in the US.
Data Source
Centers for Disease Control and Prevention, National Center for Health Statistics, National Health Interview Survey, 1987–2023.
Please note that these data were collected while the 2016 USPSTF recommendations were in place. Therefore, the estimates include adults aged 50 to 75 years.
Refer to the Data Sources page for more information about data collection years 2019+.
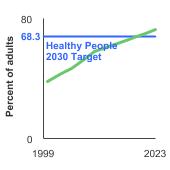
Healthy People 2030 Target
- Increase to 74.4 percent the proportion of adults aged 50 to 75 years who have received a colorectal screening test based on the most recent guidelines.
Healthy People 2030 is a set of goals set forth by the Department of Health and Human Services.
Note: Goals are indicated as blue line on Detailed Trend Graphs.
Trends and Most Recent Estimates
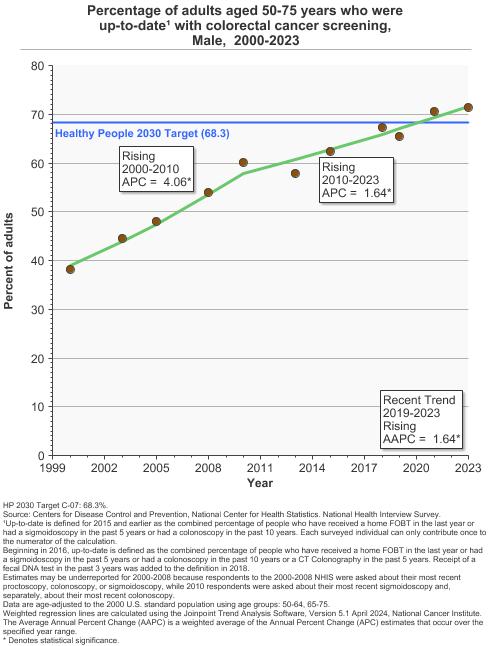
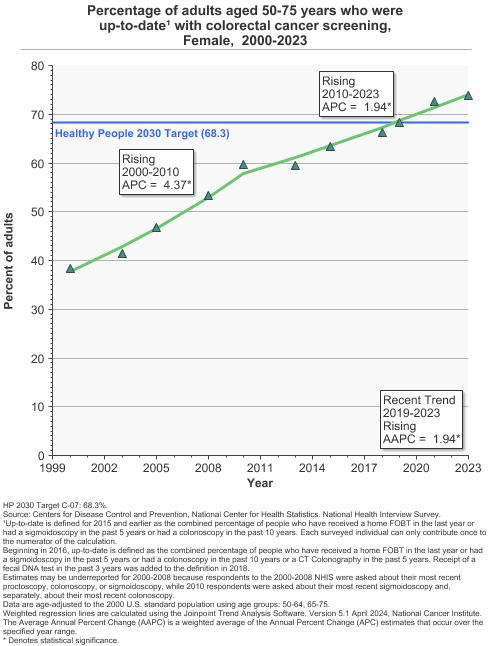
- By Sex
Percentage of adults aged 50-75 years who were up-to-date¹ with colorectal cancer screening by sex, 2000-2023 Overview Graph Detailed Trend Graphs Most Recent Estimates (2023) Percent of adults 95% Confidence Interval 

Both Sexes 
72.6 71.6 - 73.7 Male 71.3 69.9 - 72.7 Female 73.9 72.6 - 75.2 - By Race/Ethnicity
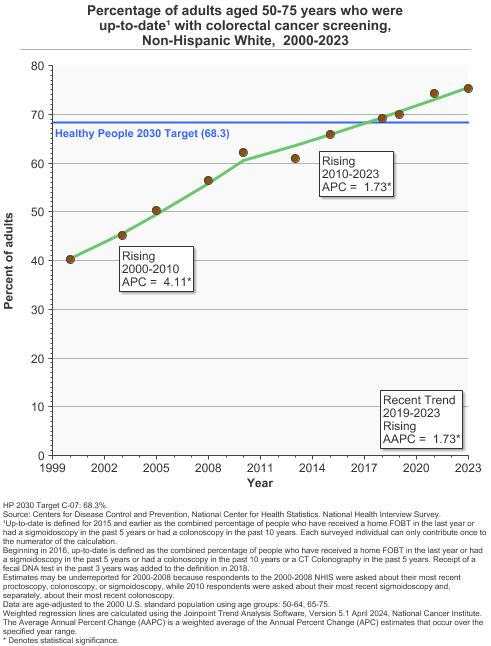
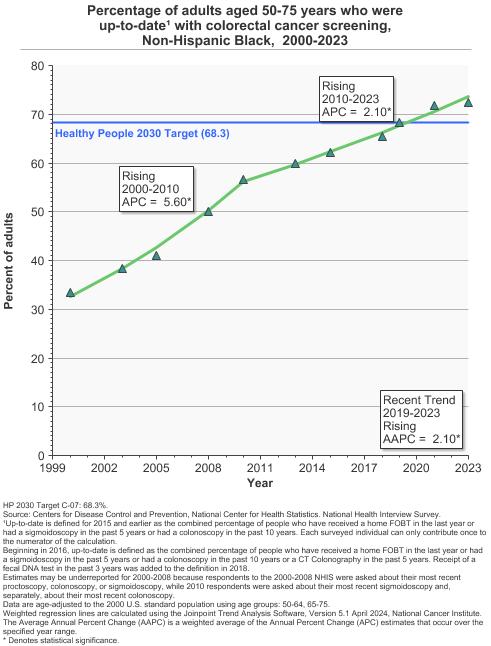
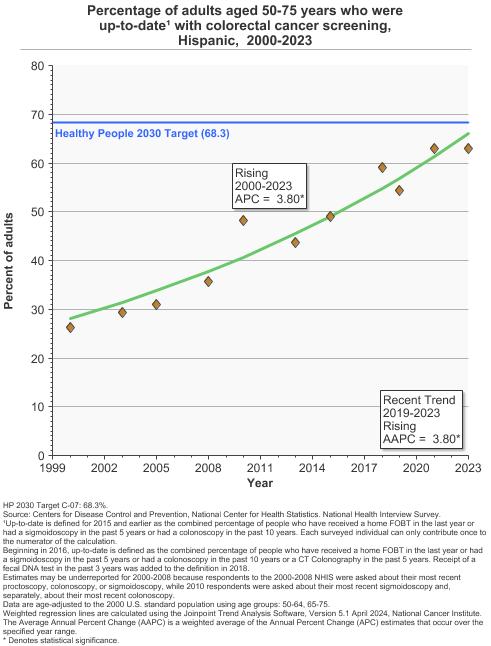
Percentage of adults aged 50-75 years who were up-to-date¹ with colorectal cancer screening by race/ethnicity, 2000-2023 Overview Graph Detailed Trend Graphs Most Recent Estimates (2023) Percent of adults 95% Confidence Interval 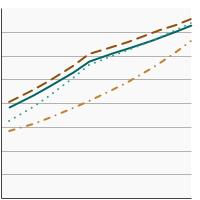
All Races/Ethnicities 72.6 71.6 - 73.7 Non-Hispanic White 75.3 74.2 - 76.4 Non-Hispanic Black 72.5 69.5 - 75.2 Hispanic 62.9 59.6 - 66.1 - By Poverty Income Level
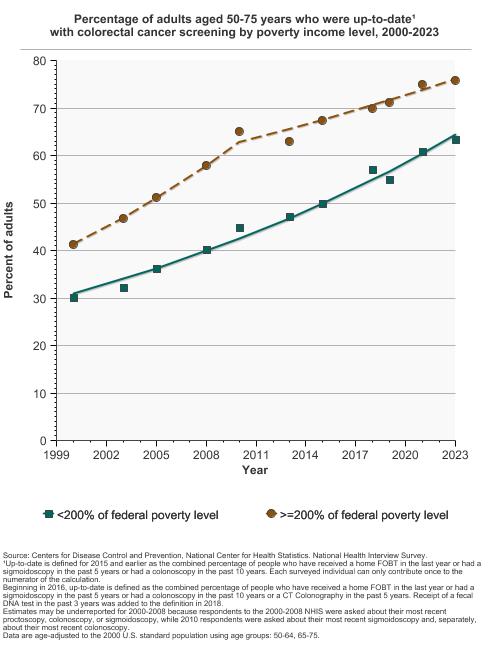
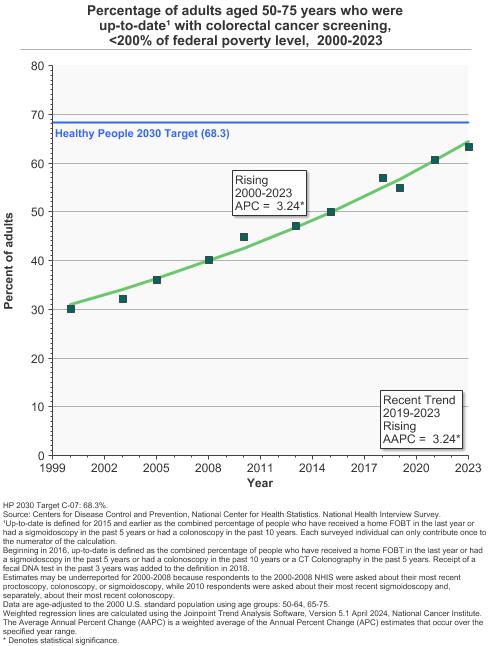
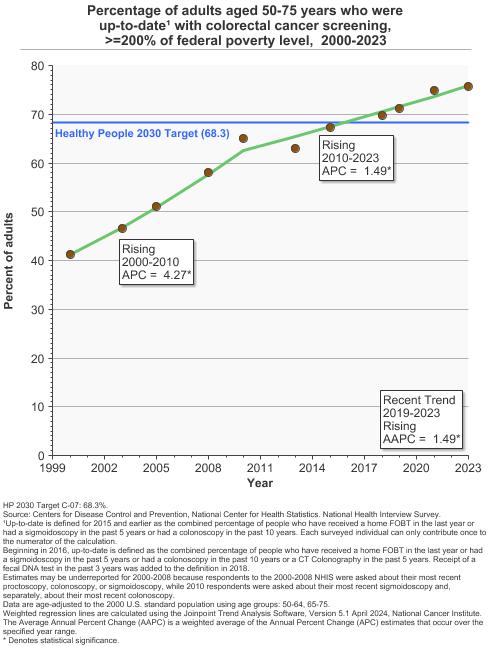
Percentage of adults aged 50-75 years who were up-to-date¹ with colorectal cancer screening by poverty income level, 2000-2023 Overview Graph Detailed Trend Graphs Most Recent Estimates (2023) Percent of adults 95% Confidence Interval 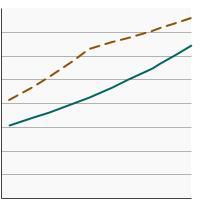
<200% of federal poverty level 63.3 61.1 - 65.4 >=200% of federal poverty level 75.7 74.6 - 76.8 - By Education Level
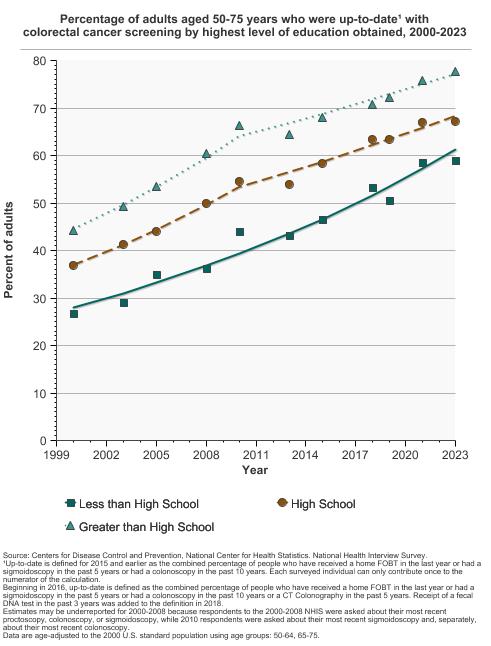
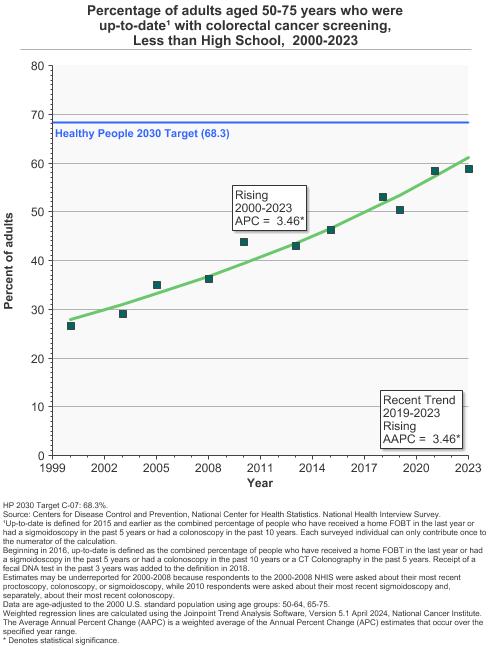
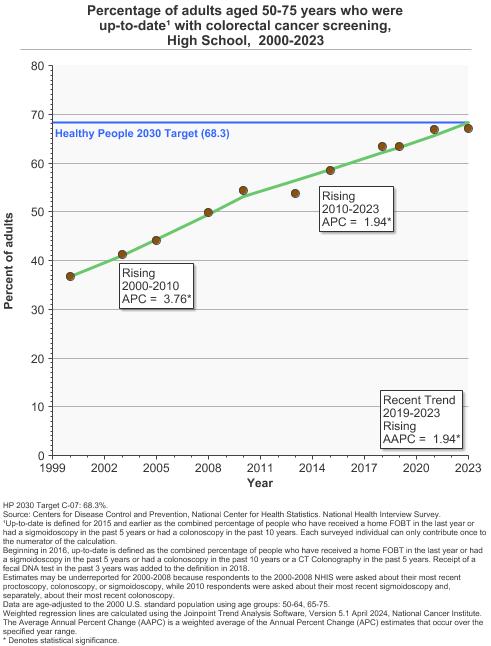
Percentage of adults aged 50-75 years who were up-to-date¹ with colorectal cancer screening by highest level of education obtained, 2000-2023 Overview Graph Detailed Trend Graphs Most Recent Estimates (2023) Percent of adults 95% Confidence Interval 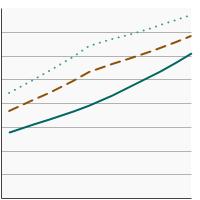
Less than High School 58.8 55.0 - 62.5 High School 67.1 65.2 - 69.1 Greater than High School 77.7 76.6 - 78.8 - By Screening Location
Breakdown of colorectal screening tests received by adults aged 50-75 years by screening location, 2000-2023 Overview Graph Detailed Trend Graphs Most Recent Estimates (2023) Percent of adults 95% Confidence Interval 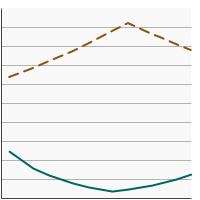
Home-Based Testing 12.8 11.9 - 13.7 Visualization Testing 75.6 74.4 - 76.8 - By Contributing Test Type
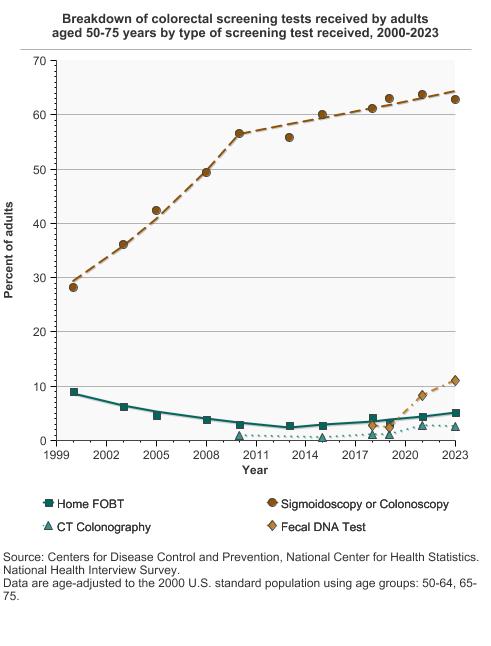
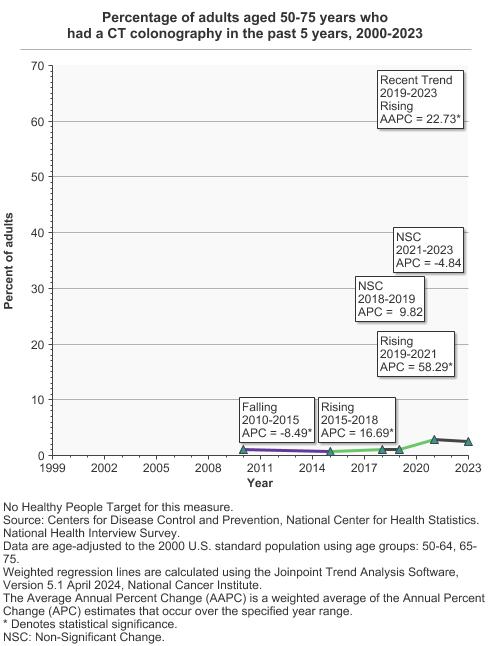
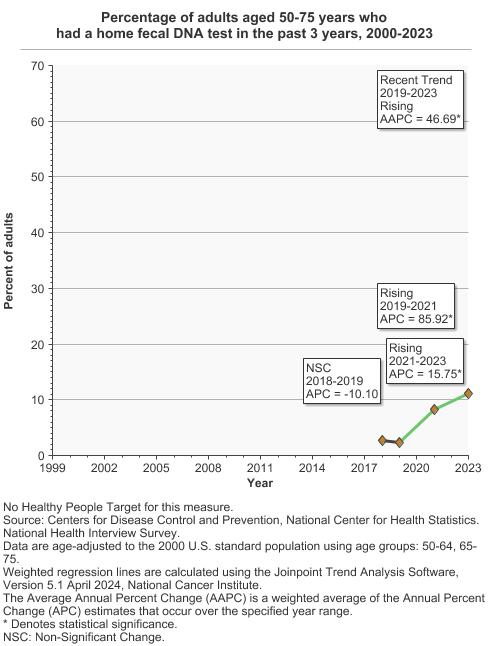
Breakdown of colorectal screening tests received by adults aged 50-75 years by type of screening test received, 2000-2023 Overview Graph Detailed Trend Graphs Most Recent Estimates (2023) Percent of adults 95% Confidence Interval 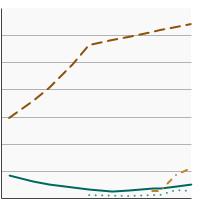
Home FOBT 5.1 4.6 - 5.6 Sigmoidoscopy or Colonoscopy 62.8 61.7 - 63.9 CT Colonography 2.5 2.2 - 2.9 Fecal DNA Test 11.1 10.5 - 11.8


Additional Information
- Colorectal Cancer Screening (PDQ®)-Patient Version. National Cancer Institute.
- Tests to Detect Colorectal Cancer and Polyps. National Cancer Institute.
- Medicare Coverage for Cancer Prevention and Early Detection. American Cancer Society.
- Colorectal Cancer. Centers for Disease Control and Prevention.
- Colorectal Cancer Screening (PDQ®)-Health Professional Version. National Cancer Institute.
- Colorectal Cancer: Screening. U.S. Preventive Services Task Force.
- Effect of Colonoscopy Screening on Risks of Colorectal Cancer and Related Death. Bretthauer M, Loberg M, Wieszczy, et al. N Engl J Med. 2022 Oct 27;387(17):1547-1556.
- Guaiac-based faecal occult blood tests versus faecal immunochemical tests for colorectal cancer screening in average-risk individuals. Grobbee EJ, Wisse PH, Schreuders EH, et al. Cochrane Database Syst Rev. 2022 Jun 6;6(6):CD009276.
- 15-Year Benefits of Sigmoidoscopy Screening on Colorectal Cancer Incidence and Mortality : A Pooled Analysis of Randomized Trials. Juul FE, Cross AJ, Schoen RE, et al. Ann Intern Med 175 (11): 1525-1533, 2022.
- Long-term Risk of Colorectal Cancer and Related Death After Adenoma Removal in a Large, Community-based Population. Lee JK, Jensen CD, Levin TR, et al. Gastroenterology. 2020;158(4):884-94.e5.
- Screening for Colorectal Cancer: Updated Evidence Report and Systematic Review for the US Preventive Services Task Force. Lin JS, Perdue LA, Henrikson, et al. JAMA. 2021; 325(19):1978-98.
- SEER Cancer Stat Facts: Colorectal Cancer. National Cancer Institute.
- Behavioral Risk Factor Surveillance System: Prevalence Data & Data Analysis Tools. Centers for Disease Control and Prevention, National Center for Chronic Disease Prevention and Health Promotion.