On This Page:
- Background
- Measure
- Healthy People 2030 Target
- Data Source
- Trends and Most Recent Estimates
- Additional Information
Background
Prostate-specific antigen, or PSA, is a protein produced by normal, as well as malignant, cells of the prostate gland. The PSA test measures the level of PSA in a man’s blood. For this test, a blood sample is sent to a laboratory for analysis.
In 2012 the U.S. Preventive Services Task Force (USPSTF) recommended against prostate cancer screening. In May 2018, the USPSTF published a final recommendation statement to update PSA screening guidelines for two subsets of the population:
- for men age 70 years and older, the USPSTF recommends against PSA-based screening for prostate cancer, and
- for men ages 55 to 69 years, the USPSTF recommends that clinicians inform them about the potential benefits and harms of PSA-based screening for prostate cancer, stating that the decision about whether to be screened for prostate cancer should be an individual one.
Measure
The percentage of men aged 55 to 69 years who reported having had a PSA test within the past year, by race/ethnicity, income, education level, and age. This provides information about the use of PSA testing in the population.
Measurement challenges
We track prostate cancer screening rates in the U.S. using a large, national, in-person survey in which male respondents were asked whether they had ever had a PSA test and, if so, the time of their most recent test and the main reason for undergoing it (see Data Source, below). There are important limitations to this method that impact what information we can accurately collect and how confident we can be in the findings. Studies have found that certain types of healthcare survey questions can be difficult for people to clearly understand and answer.
In the case of PSA screening, it may be challenging to determine by self-report alone if a PSA test was received for screening purposes, i.e., to look for asymptomatic, previously undetected cancer, or as a follow-up on symptoms or suspicious findings from a prior test. Additionally, looking for new or recurrent asymptomatic cancer in a person previously diagnosed and treated for that cancer type represents a third type of testing known as surveillance testing. In some cases, because PSA testing is a blood test, it may be bundled by a clinician with other tests, and a man may be unaware he even had the test. Finally, men may also not always accurately recall the specific time they received a particular test. As such, our measure captures any type of PSA test received by a man, and the population may include those with a prior diagnosis of prostate cancer. This serves as a reasonable approximation, although an overestimate, of the true U.S. prostate cancer screening rate.
Even though the National Health Interview Survey prostate cancer screening measures have limitations, it is the best nationally representative data we have available.
Data Source
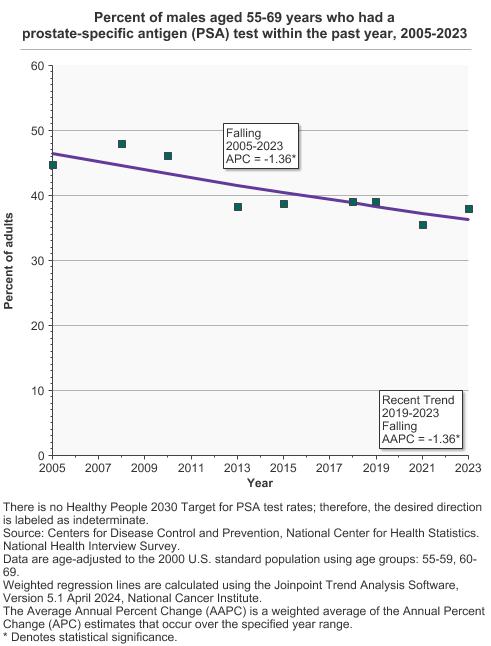
Centers for Disease Control and Prevention, National Center for Health Statistics, National Health Interview Survey, 2005-2023.
Refer to the Data Sources page for more information about data collection years 2019+.
Healthy People 2030 Target
There is no Healthy People 2030 target related to being screened for prostate cancer. There is a target goal to increase the proportion of men who have discussed the advantages and disadvantages of the PSA test to screen for prostate cancer with their health care provider.
Healthy People 2030 is a set of goals set forth by the Department of Health and Human Services.
Trends and Most Recent Estimates
- By Race/Ethnicity
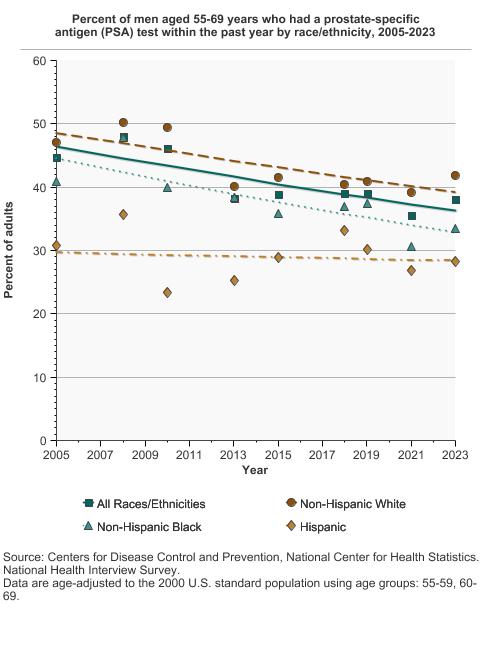
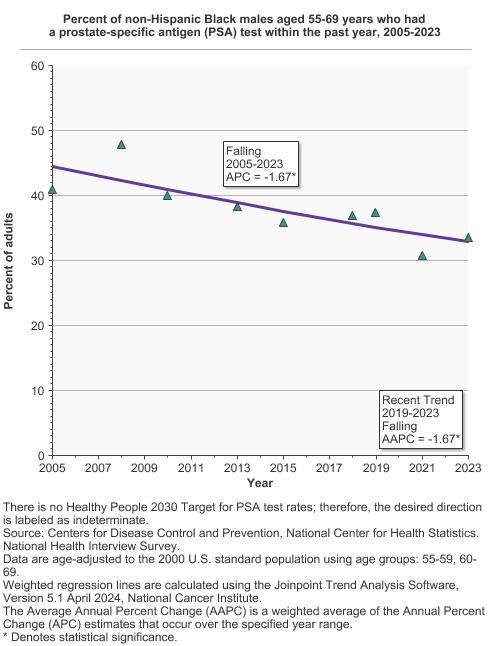
Percent of men aged 55-69 years who had a prostate-specific antigen (PSA) test within the past year by race/ethnicity, 2005-2023 Overview Graph Detailed Trend Graphs Most Recent Estimates (2023) Percent of adults 95% Confidence Interval 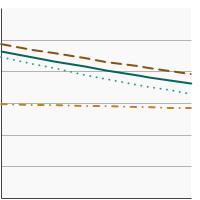

All Races/Ethnicities 
38.0 36.1 - 40.0 Non-Hispanic White 41.8 39.5 - 44.1 Non-Hispanic Black 33.5 27.6 - 39.9 Hispanic 28.2 23.1 - 34.0 - By Poverty Income Level
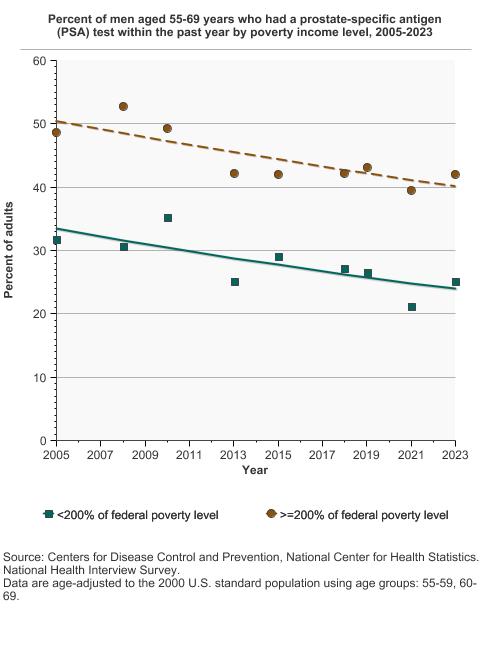
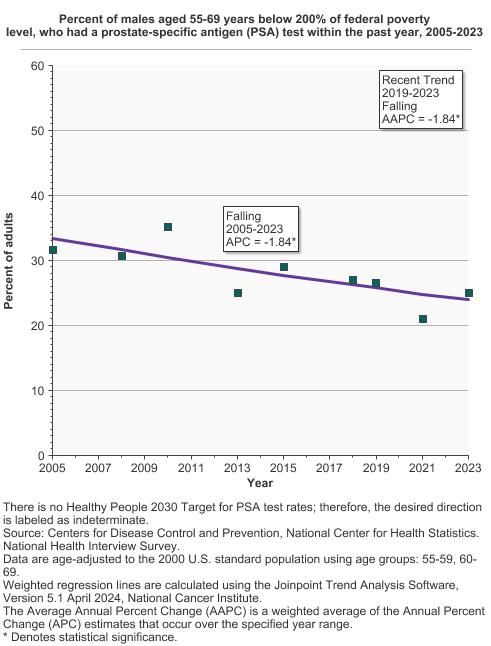
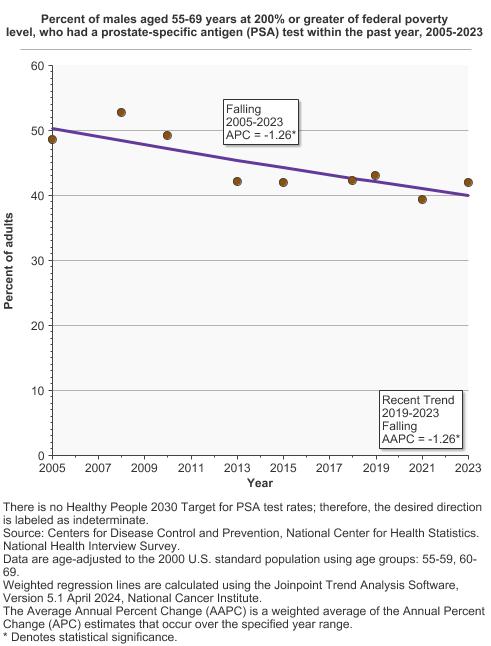
Percent of men aged 55-69 years who had a prostate-specific antigen (PSA) test within the past year by poverty income level, 2005-2023 Overview Graph Detailed Trend Graphs Most Recent Estimates (2023) Percent of adults 95% Confidence Interval 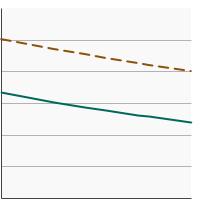
<200% of federal poverty level 25.1 21.8 - 28.6 >=200% of federal poverty level 42.0 39.7 - 44.2 - By Education Level
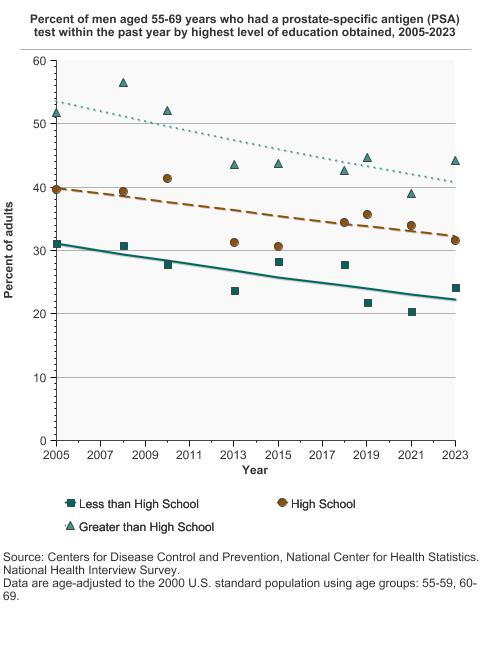
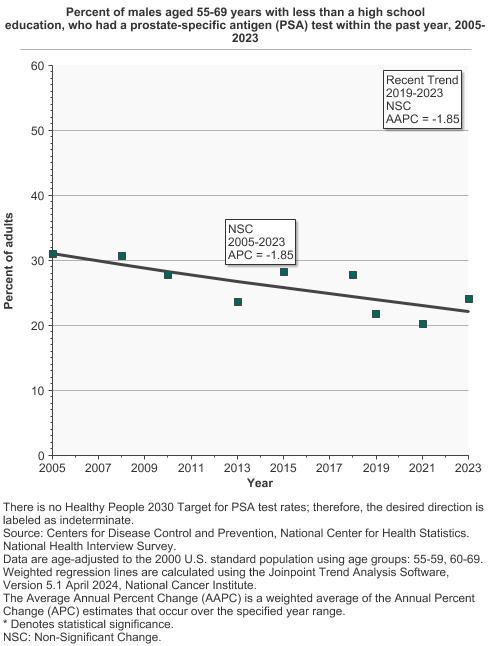
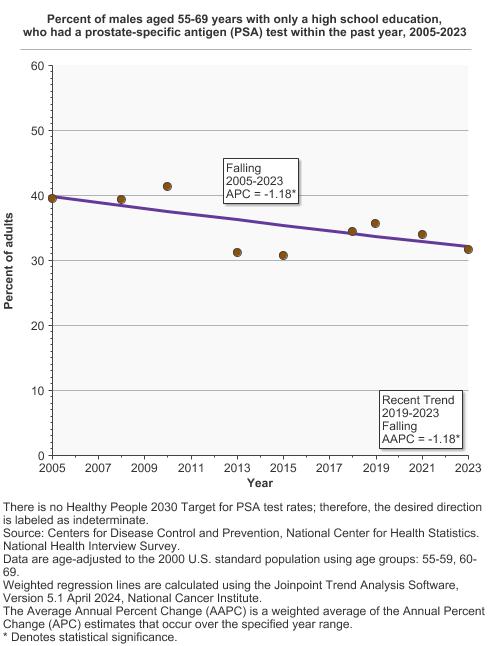
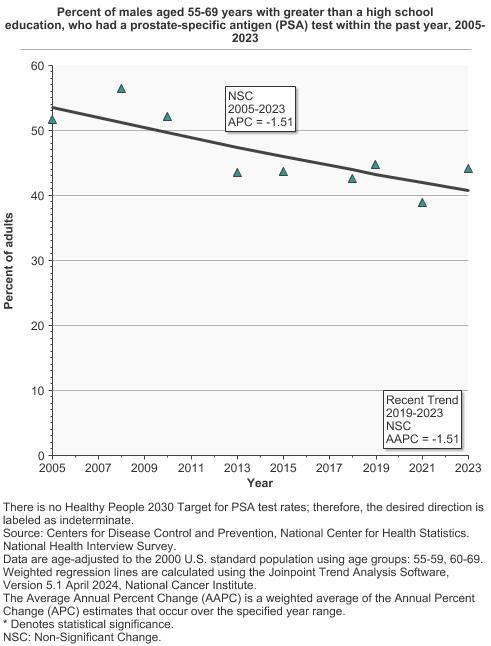
Percent of men aged 55-69 years who had a prostate-specific antigen (PSA) test within the past year by highest level of education obtained, 2005-2023 Overview Graph Detailed Trend Graphs Most Recent Estimates (2023) Percent of adults 95% Confidence Interval 
Less than High School 24.2 18.3 - 31.3 High School 31.6 28.3 - 35.2 Greater than High School 44.2 41.7 - 46.7 - By Age
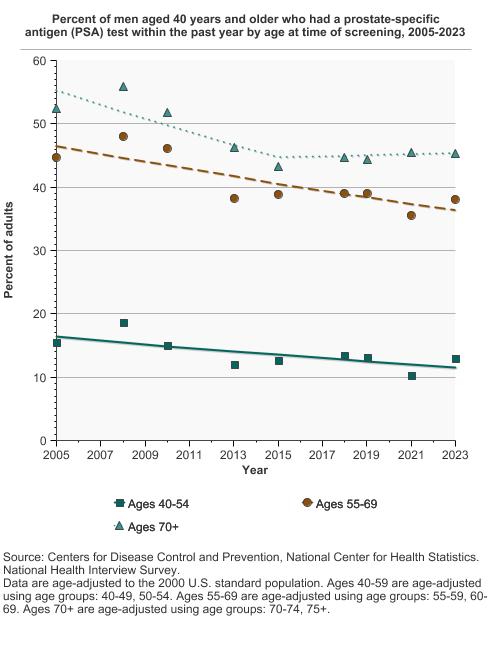
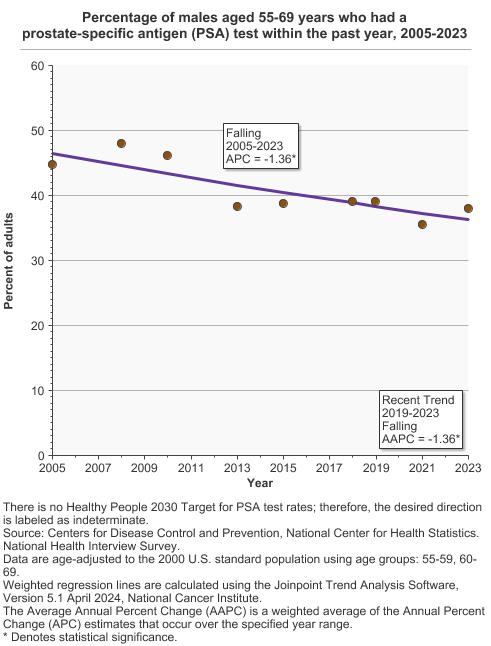
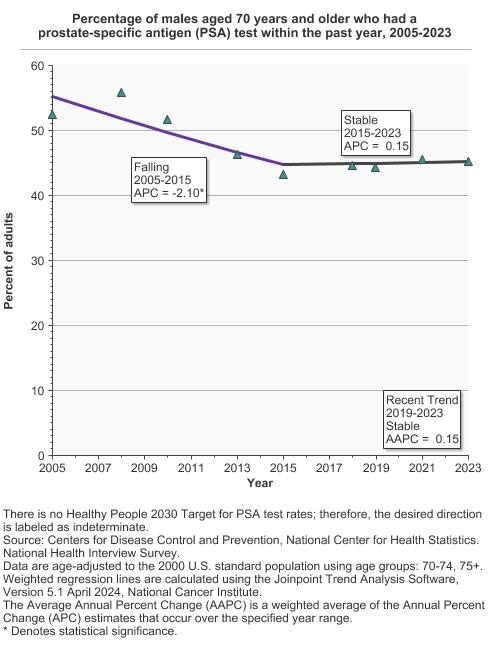
Percent of men aged 40 years and older who had a prostate-specific antigen (PSA) test within the past year by age at time of screening, 2005-2023 Overview Graph Detailed Trend Graphs Most Recent Estimates (2023) Percent of adults 95% Confidence Interval 
Ages 40-54 12.9 11.6 - 14.4 Ages 55-69 38.0 36.1 - 40.0 Ages 70+ 45.3 43.0 - 47.6


Additional Information
- Prostate Cancer Screening (PDQ)-Patient Version. National Cancer Institute.
- Prostate-Specific Antigen (PSA) Test. National Cancer Institute.
- Prostate Cancer. Centers for Disease Control and Prevention.
- Prostate Cancer Screening (PDQ®)-Health Professional Version. National Cancer Institute.
- Prostate Cancer: Screening. U.S. Preventive Services Task Force.
- Prostate-Specific Antigen–Based Screening for Prostate Cancer Evidence Report and Systematic Review for the US Preventive Services Task Force. Fenton JJ, Weyrich MS, Durbin S, et al. JAMA 2018;319(18):1914-1931. doi:10.1001/jama.2018.3712
- Prostate-Specific Antigen Screening and 15-Year Prostate Cancer Mortality: A Secondary Analysis of the CAP Randomized Clinical Trial. Martin RM, Turner EL, Young GJ, et al. JAMA 331(17):1460-1470, 2024.
- Prostate cancer screening using a combination of risk-prediction, MRI, and targeted prostate biopsies (STHLM3-MRI): a prospective, population-based, randomised, open-label, non-inferiority trial. Nordström T, Discacciati A, Bergman M, et al. Lancet Oncol 22 (9): 1240-1249, 2021.
- SEER Cancer Stat Facts: Prostate Cancer. National Cancer Institute.
- Behavioral Risk Factor Surveillance System: Prevalence Data & Data Analysis Tools. Centers for Disease Control and Prevention, National Center for Chronic Disease Prevention and Health Promotion.