On This Page:
- Background
- Measure
- Healthy People 2030 Target
- Data Source
- Trends and Most Recent Estimates
- Additional Information
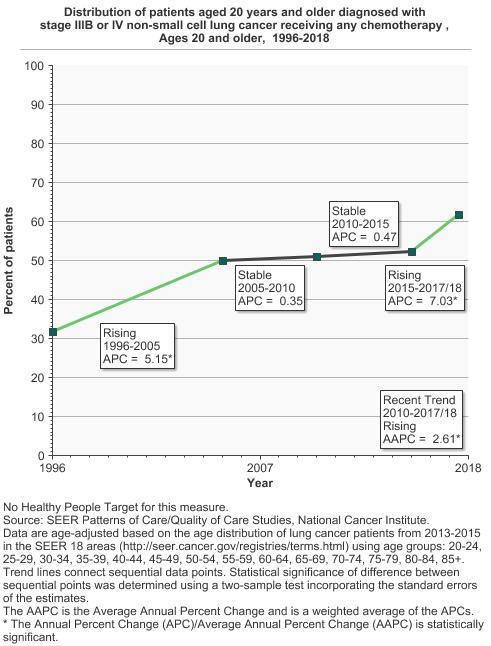
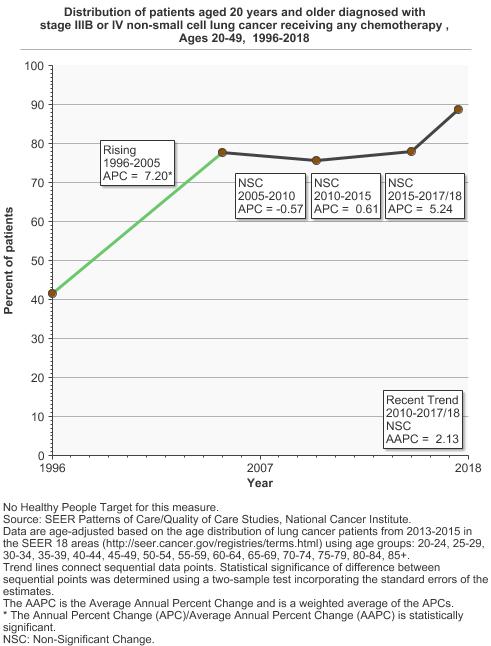
In 2017/2018, 61.9% of stage IIIB or IV non-small cell lung cancer patients aged 20 years and older received chemotherapy.
Background
Lung cancer forms in tissues of the lung, usually in the cells that line air passages. The two main types of lung cancer are small cell lung cancer and non-small cell lung cancer (NSCLC), which is the most common. About 85 percent of lung cancers are NSCLCs.
Primary treatment options for people with NSCLC include surgery, radiation therapy, other local treatments, chemotherapy, immunotherapy, and targeted therapies. In many cases, more than one of these treatments is used.
Surgery to remove the tumor presents the greatest chance of curing NSCLC, and is commonly used to treat stages I and II and some stage III cancers but is rarely used to treat stage IV cancers. Postoperative chemotherapy may provide an additional benefit to patients who have undergone surgical removal of NSCLC. Radiation therapy combined with chemotherapy can effectively treat a small number of patients and can provide palliation in most patients.
Measure
Chemotherapy following the diagnosis of non-small cell lung cancer stages IIIB or IV.
Data Source
SEER Patterns of Care/Quality of Care Studies, National Cancer Institute, 1996-2018.
Healthy People 2030 Target
- There are no Healthy People 2030 targets for cancer treatment, including lung cancer treatment.
Healthy People 2030 is a set of goals set forth by the Department of Health and Human Services.
Trends and Most Recent Estimates
- Chemotherapy
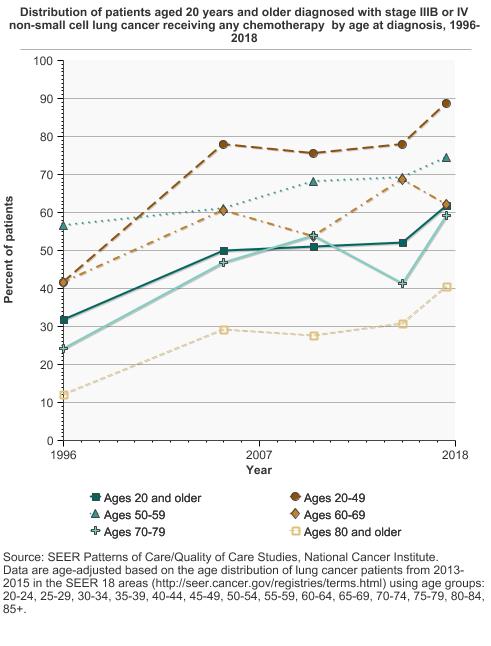
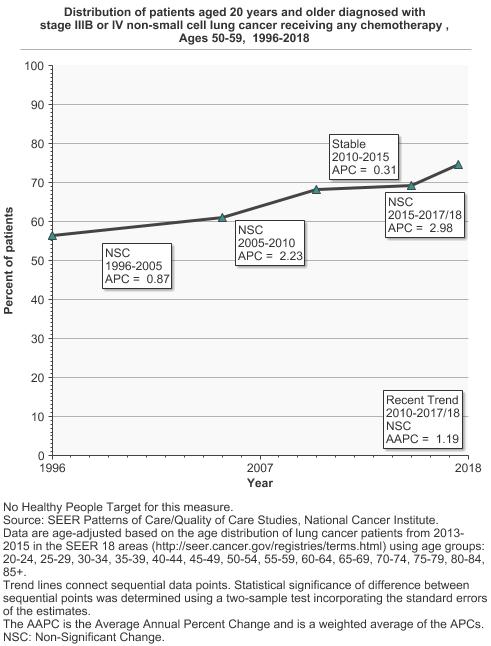
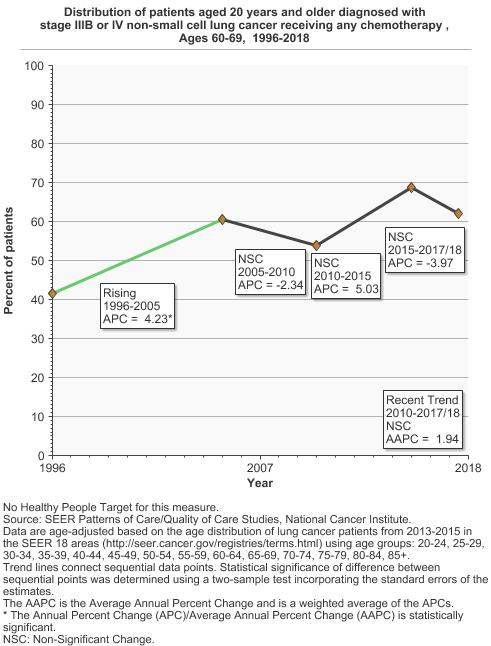
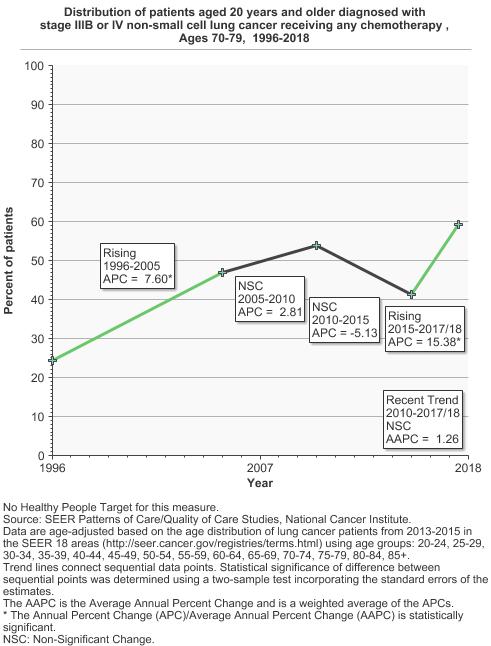
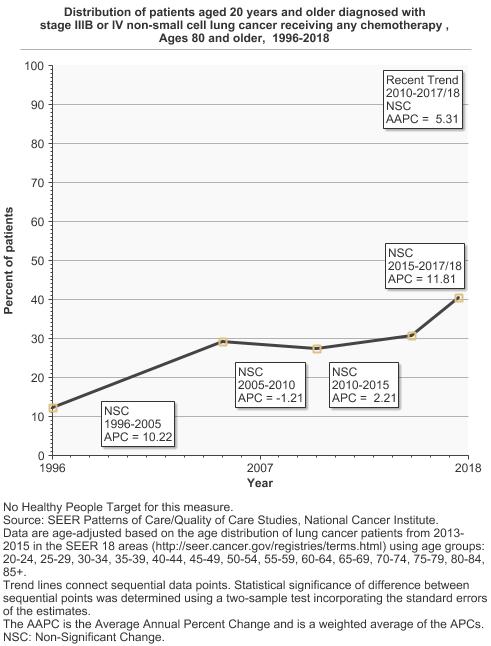
Distribution of patients aged 20 years and older diagnosed with stage IIIB or IV non-small cell lung cancer receiving any chemotherapy by age at diagnosis, 1996-2018 Overview Graph Detailed Trend Graphs Most Recent Estimates (2017/2018) Percent of patients 95% Confidence Interval 

Ages 20 and older 
61.9 59.9 - 63.8 Ages 20-49 88.6 83.4 - 93.8 Ages 50-59 74.6 70.4 - 78.7 Ages 60-69 62.1 58.7 - 65.4 Ages 70-79 59.2 55.5 - 62.9 Ages 80 and older 40.6 35.4 - 45.9
Additional Information
Additional Information on Lung Cancer Treatment
- Lung Cancer. National Cancer Institute.
- Non-Small Cell Lung Cancer Treatment (PDQ®)-Patient Version. National Cancer Institute.
- Small Cell Lung Cancer Treatment (PDQ®)-Patient Version. National Cancer Institute.
- Treating Non-small Cell Lung Cancer. American Cancer Society.
- Treating Small Cell Lung Cancer. American Cancer Society.
- Non-Small Cell Lung Cancer (NCCN Guidelines for Patients®). National Comprehensive Cancer Network.
Quitting Resources
- Smokefree.gov. National Cancer Institute.
- Tobacco. National Cancer Institute.
- Stay Away from Tobacco. American Cancer Society.
- Advances in Lung Cancer Research. National Cancer Institute.
- Non-Small Cell Lung Cancer Treatment (PDQ®)-Health Professional Version. National Cancer Institute.
- Small Cell Lung Cancer Treatment (PDQ®)-Patient Version. National Cancer Institute.
- SEER Cancer Stat Facts: Lung and Bronchus Cancer. National Cancer Institute.
- SEER-Medicare Linked Database. National Cancer Institute.
- SEER Patterns of Care/Quality of Care Studies. National Cancer Institute.