On This Page:
- Background
- Measure
- Healthy People 2030 Target
- Data Source
- Trends and Most Recent Estimates
- Additional Information
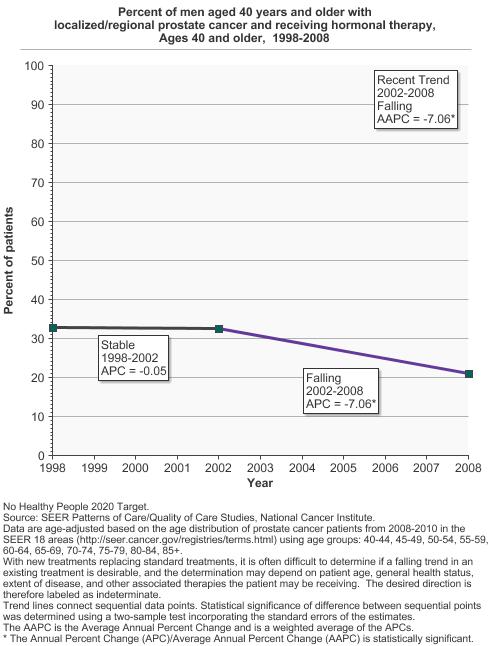
In 2008, 21.1% of localized/regional prostate cancer patients aged 40 years and older were given hormonal therapy.
Background
Prostate cancer forms in tissues of the prostate (a gland in the male reproductive system found below the bladder and in front of the rectum). This disease, which usually occurs in older men and grows relatively slowly, is the most common cancer among men (after skin cancer), but can often be treated successfully.
Standard treatment options may include active surveillance, surgery, radiation therapy, hormonal therapy, chemotherapy, biologic therapy, and targeted therapy. These treatments are generally used one at a time, although in some cases they may be combined.
Hormonal therapy is also called androgen deprivation therapy or androgen suppression therapy. Its goal is to reduce levels of male hormones, called androgens, in the body, and to block them from affecting prostate cancer cells. This type of therapy can slow prostate cancer cell growth, which is stimulated by androgens.
The use of hormonal therapy for prostate cancer typically increases with the age of the patient, and it is currently also recommended for men with a high risk of recurrence. It may also be used for men who are not able to have surgery or radiation, and for men who can’t be cured by these treatments because the cancer has already spread beyond the prostate gland. It is increasingly being used before, during, and after local treatment as well.
Measure
Hormonal therapy following the diagnosis of prostate cancer.
Data Source
SEER Patterns of Care/Quality of Care Studies, National Cancer Institute, 1998-2008.
Healthy People 2030 Target
- There are no Healthy People 2030 targets for cancer treatment, including prostate cancer treatment.
Healthy People 2030 is a set of goals set forth by the Department of Health and Human Services.
Trends and Most Recent Estimates
- Hormonal Therapy
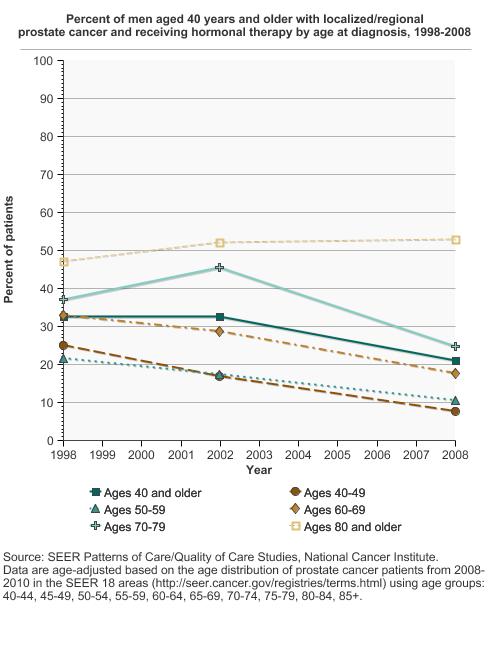
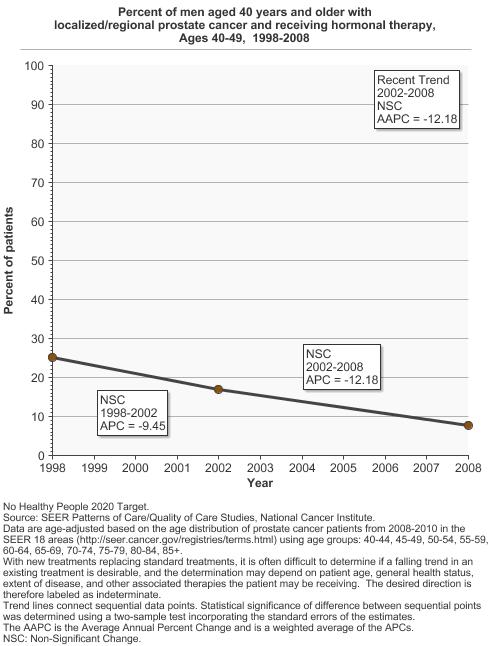
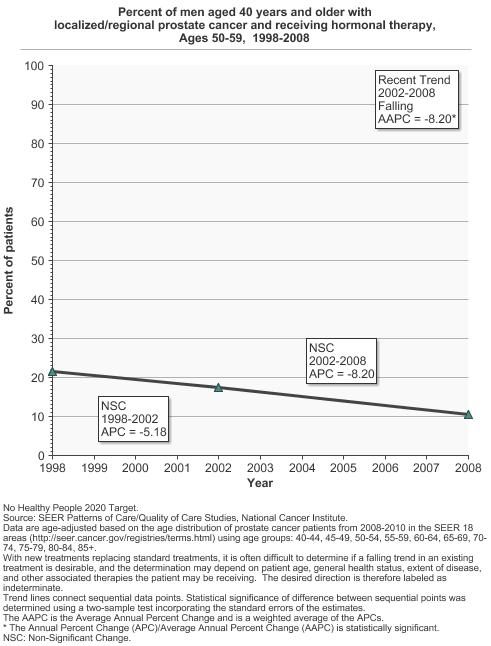
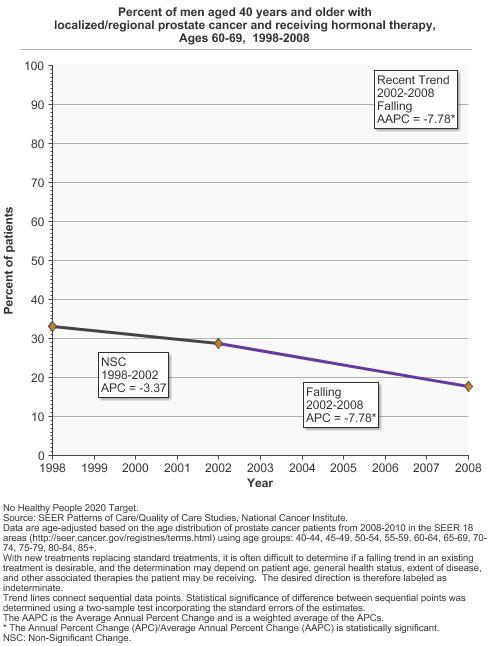
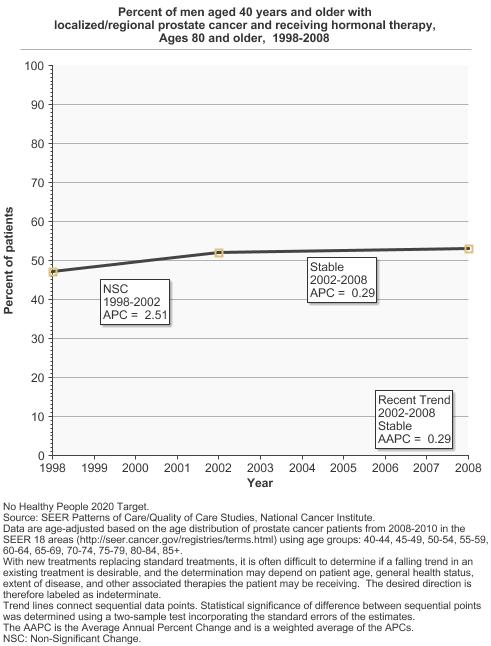
Percent of men aged 40 years and older with localized/regional prostate cancer and receiving hormonal therapy by age at diagnosis, 1998-2008 Overview Graph Detailed Trend Graphs Most Recent Estimates (2008) Percent of patients 95% Confidence Interval 

Ages 40 and older 
21.1 17.6 - 24.5 Ages 40-49 7.7 3.4 - 12.1 Ages 50-59 10.4 6.9 - 13.9 Ages 60-69 17.7 10.9 - 24.5 Ages 70-79 24.7 18.1 - 31.3 Ages 80 and older 53.0 43.1 - 63.0

Additional Information
- Hormone Therapy for Prostate Cancer. National Cancer Institute.
- Prostate Cancer. National Cancer Institute.
- Prostate Cancer Treatment (PDQ®) - Patient Version. National Cancer Institute.
- Treating Prostate Cancer. American Cancer Society.
- Prostate Cancer (NCCN Guidelines for Patients®). National Comprehensive Cancer Network.
- Prostate Cancer Treatment. Prostate Cancer Foundation.
- Treatment Options. Us TOO International Prostate Cancer Education & Support Network.
- Advances in Prostate Cancer Research. National Cancer Institute.
- Prostate Cancer Treatment (PDQ®)-Health Professional Version. National Cancer Institute.
- NIH-funded study shows increased survival in men with metastatic prostate cancer who receive chemotherapy when starting hormone therapy. National Cancer Institute. June 2014.
- Initial hormonal management of androgen-sensitive metastatic, recurrent, or progressive prostate cancer: 2006 update of an American Society of Clinical Oncology practice guideline. Loblaw DA, Virgo KS, Nam R, et al. Journal of Clinical Oncology 2004;22(20):4109–4118.
- Immediate versus deferred hormonal treatment for patients with prostate cancer who are not suitable for curative local treatment: results of the randomized trial SAKK 08/88. Studer UE, Hauri D, Hanselmann S, et al. Journal of Clinical Oncology 2004;22(20):4109–4118.
- Immediate or deferred androgen deprivation for patients with prostate cancer not suitable for local treatment with curative intent: European Organization for Research and Treatment of Cancer Trial 30891. Studer UE, Whelan P, Albrecht W, et al. Journal of Clinical Oncology 2006;24(12):1868–1876.
- SEER Cancer Stat Facts: Prostate Cancer. National Cancer Institute.
- SEER-Medicare Linked Database. National Cancer Institute.
- SEER Patterns of Care/Quality of Care Studies. National Cancer Institute.