The Cancer Trends Progress Report contains trend data for key measures of cancer control (Prevention, Early Detection, Diagnosis, Treatment, Life after Cancer, and End of Life). Data can be accessed within the Trends and Most Recent Estimates section of each measure page.
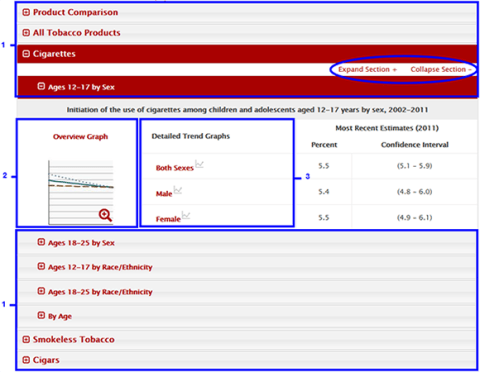
- The accordion menu is made up of collapsible panels that toggle opened and closed by clicking on the section titles. When a panel is toggled it changes color. Open panels are red. Closed panels are gray. Only one section can be opened at any time.
Sections can have multiple subsections depending on what data are available for a measure. When there are multiple subsections, the Expand Section+ and Collapse Section- links become available to toggle. The open subsections have an Overview Graph (see 2), Detailed Trend Graphs (see 3), and Percent and Confidence Intervals for the Most Recent Estimates. - Click on the Overview Graph to open a graph in a pop-up window that dispIays the variables listed within the Detailed Trend Graphs (see 3). There are two links under the title of the graph, Download Image (JPEG) and Download Data (CSV). When you click on Download Image (JPEG), a JPEG file of the graph opens and can be saved to your device. When you click on the Download Data (CSV) link, a CSV file is downloaded which can be opened in Microsoft Excel and other applications.
- The Detailed Trend Graphs are separate graphs showing each of the variables that appeared in the Overview Graph. Click on the name of the variable to open that variable’s graph in a pop-up. There are two links under the title of the graph, Download Image (JPEG) and Download Data (CSV). When you click on Download Image (JPEG) a JPEG file of the graph opens and can be saved to your device. When you click on the Download Data (CSV) link, a CSV file is downloaded which can be opened in Microsoft Excel and other applications.