On This Page:
- Background
- Measure
- Healthy People 2030 Target
- Data Source
- Trends and Most Recent Estimates
- Related Cancers
- Additional Information

Background
Drinking alcohol increases the risk of cancers of the mouth, esophagus, pharynx, larynx, liver, colon, and rectum in men and women and of breast cancer in women. The risk of developing cancer increases with the amount of alcohol consumed and with the length of time over which alcohol is consumed regularly. Even one drink per day can increase the risk of breast and head and neck cancers. For colon and rectum cancer, risk consistently increases beginning at about two drinks per day and risk of liver cancer begins increasing at about three drinks per day. A drink is defined as 12 ounces of regular beer, 5 ounces of wine, or 1.5 ounces of 80-proof liquor.
The International Agency for Research on Cancer (IARC) classifies alcohol as a Group 1 carcinogen, meaning it is carcinogenic to humans. Furthermore, co-use of alcohol and combustible tobacco such as cigarettes or cigars can greatly increase the risk of head and neck cancers. Alcoholic beverage intake is not recommended in the Dietary Guidelines for Americans. If alcohol is consumed, it should be in moderation. Overall, drinking less is better for your health than drinking more. There are people who should not drink at all, including people who are pregnant or might be pregnant, are younger than 21, have certain medical conditions, are taking certain medications, can’t control the amount they drink, or are recovering from alcohol use disorder.
Measure
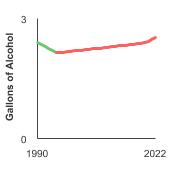
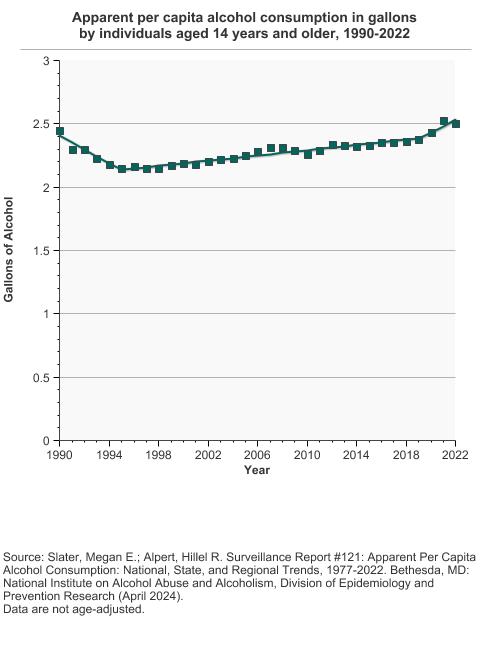
Per capita alcohol consumption: The estimated number of gallons of pure alcohol consumed per person (aged 14 years and older), per year. This measure accounts for the varying alcohol content of wine, beer, and liquor. People as young as 14 are included because a large number of adolescents begin drinking at an early age.
Data Source
National Institute on Alcohol Abuse and Alcoholism. Surveillance report #121 – Apparent per capita alcohol consumption: national, state, and regional trends, 1977–2022. April 2024.
Healthy People 2030 Target
- There are no Healthy People 2030 targets regarding per capita alcohol consumption, but there are other goals related to reducing the misuse of alcohol and reducing alcohol addiction.
Healthy People 2030 is a set of goals set forth by the Department of Health and Human Services.
Trends and Most Recent Estimates
- Alcohol Consumption
Apparent per capita alcohol consumption in gallons by individuals aged 14 years and older, 1990-2022 Overview Graph Detailed Trend Graphs Most Recent Estimates (2022) Gallons of Alcohol 95% Confidence Interval 

All Types of Alcoholic Beverages 
2.5 Not available
Additional Information
- Alcohol and Cancer Risk. National Cancer Institute.
- Alcohol Use and Cancer. American Cancer Society.
- Alcohol’s Effects on Health. National Institute on Alcohol Abuse and Alcoholism.
- Unhealthy Alcohol Use in Adolescents and Adults: Screening and Behavioral Counseling Interventions. U.S. Preventive Services Task Force.
- 2020-2025 Dietary Guidelines for Americans. U.S. Department of Agriculture and U.S. Department of Health and Human Services.
- Canada’s Guidance on Alcohol and Health: Final Report. Canadian Centre on Substance Use and Addiction.
- IARC monographs on the evaluation of carcinogenic risks to humans: Alcohol drinking. World Health Organization.
- Global Cancer Update Programme. World Cancer Research Fund International.
- Diet, Nutrition, Physical Activity, and Cancer: a Global Perspective. World Cancer Research Fund and the American Institute for Cancer Research.
- Alcohol abuse in cancer patients: a shadow side in the oncological field and research. Glasdam S, Oye C. Med Health Care Philos. 2013;17(3):437-46.
- American Cancer Society guideline for diet and physical activity for cancer prevention. Rock CL, Thomson C, Gansler T, et. al. CA Cancer J Clin. 2020; 70(4): 245-271.
- Reducing Alcohol Use to Prevent Cancer Deaths: Estimated Effects Among U.S. Adults. Esser MB, Sherk A, Liu Y, Henley SJ, Naimi TS. Am J Prev Med. Apr 2024;66(4):725-729.
- Food Intakes, U.S. Population, 2007-10: Usual Daily Intake of Alcoholic Drinks. National Cancer Institute.