On This Page:
- Background
- Measure
- Healthy People 2030 Target
- Data Source
- Trends and Most Recent Estimates
- Related Cancers
- Additional Information
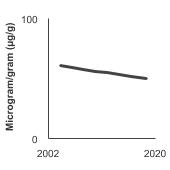
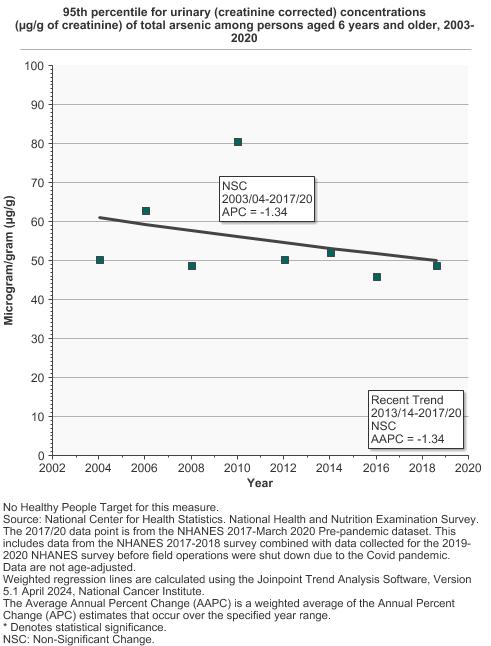
From 2017 to 2020, the 95th percentile for urinary (creatinine corrected) concentration of arsenic among persons aged 6 years and older was 48.7 µg/g.

Background
Arsenic is a tasteless, odorless element in the environment that can be found naturally in rocks and soil, water, air, plants, and animals. It can also be released into the environment from some agricultural and industrial sources.
Arsenic is usually part of chemical compounds, including inorganic compounds (combined with oxygen, iron, chlorine, and sulfur), and organic compounds (combined with carbon and other atoms).
Inorganic arsenic compounds are found in industry, in building products (in some “pressure-treated” woods), and in arsenic-contaminated water. Soil and water contamination also can occur as a result of mining and smelting activities. Past use of arsenic-containing herbicides has resulted in soil contamination, and some food crops grown in these soils take up the arsenic. Inorganic arsenic compounds are more toxic than organic arsenic compounds, and inorganic arsenic has been strongly linked to cancer of the bladder, lungs, and skin. Additionally, inorganic arsenic has been linked to liver cancer, intrahepatic bile duct cancer, prostate cancer, and some types of kidney cancers.
We typically take in small amounts of inorganic arsenic in the food we eat (in particular, rice and fish), the water we drink, and the air we breathe. Arsenic is also present in tobacco smoke. People may be exposed to higher levels of arsenic at work in certain industries, but such exposures are now rare in the United States. People may also be exposed to greater amounts of arsenic if they live near current or former industrial or agricultural sources of arsenic, live in areas where arsenic is naturally high in drinking water, or eat a lot of seafood (although the organic form predominantly found in seafood is likely to be much less harmful). Major dietary sources of inorganic arsenic include rice and rice products.
Both short- and long-term exposure to arsenic can cause health problems. Breathing in high levels of arsenic may cause a sore throat and irritated lungs. Swallowing high levels of arsenic can be fatal. Exposure to lower levels of arsenic over longer periods of time can result in liver and kidney damage. Moreover, arsenic and cigarette smoking exposure act synergistically to increase the incidence of lung cancer.
Measure
We present exposure data on the 95th percentile of the population, representing people with the greatest exposure. The 95th percentile level means that 95% of the population has concentrations below that level. Public health officials use such reference values to determine whether groups of people are experiencing an exposure that is unusual compared with an exposure experienced by the rest of the population. For more information, see the National Report on Human Exposure to Environmental Chemicals, published by the Centers for Disease Control and Prevention.
To calculate whether the differences between 95th percentiles for two different time points are statistically significant, we used a different statistical methodology than that used by the National Center for Environmental Health, which publishes the National Report on Human Exposure to Environmental Chemicals from which our data are derived. Our estimates may differ slightly from those in the original report due to differences in statistical procedures used. [Methodology]
Because arsenic is measured from urine, the concentration of arsenic may be affected by urine diluteness. Analyte concentrations within urine also may vary with time, due to changes in the water concentration within urine. We use creatinine as a reference analyte to adjust for urine concentration and obtain measures of arsenic that are comparable, whether they are from concentrated or dilute urine samples.
Data Source
Centers for Disease Control and Prevention, National Center for Health Statistics, National Health and Nutrition Examination Survey (NHANES).
The NHANES 2017-2018 data point was replaced with the NHANES 2017-March 2020 Pre-pandemic data point. More information is available at NHANES Questionnaires, Datasets, and Related Documentation.
Healthy People 2030 Target
There are no Healthy People 2030 targets regarding urinary concentration of arsenic.
Healthy People 2030 is a set of goals set forth by the Department of Health and Human Services.
Trends and Most Recent Estimates
- Total Arsenic Exposure
- By Sex
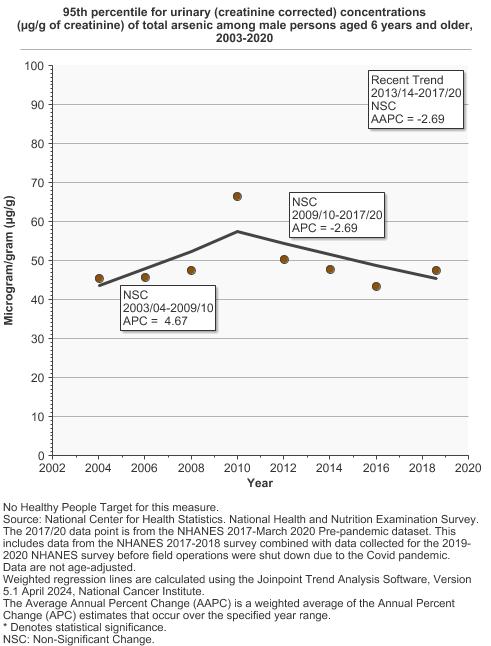
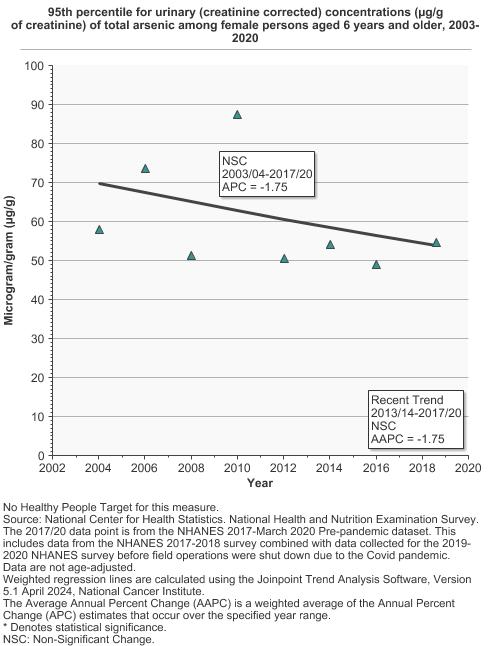
95th percentile for urinary (creatinine corrected) concentrations (µg/g of creatinine) of total arsenic among persons aged 6 years and older by sex, 2003-2020 Overview Graph Detailed Trend Graphs Most Recent Estimates (2017 to 2020) Dependent Variable 95% Confidence Interval 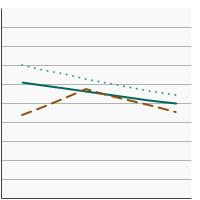

Both Sexes 
48.7 42.5 - 57.4 Male 47.4 39.8 - 55.5 Female 54.6 39.1 - 72.5 The 2017 to 2020 data point is from the NHANES 2017-March 2020 Pre-pandemic dataset. This includes data from the NHANES 2017-2018 survey combined with data collected for the 2019-2020 NHANES survey before field operations were shut down due to the Covid pandemic. - By Race/Ethnicity
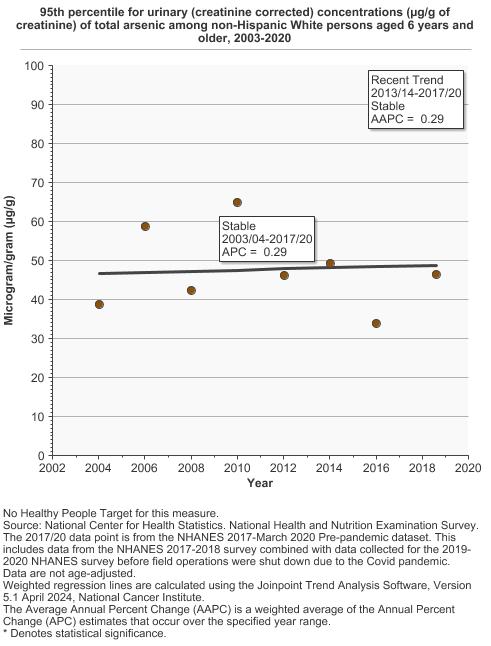
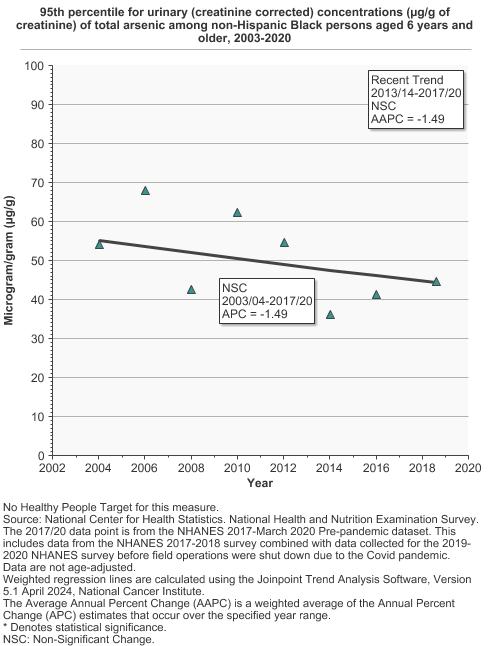
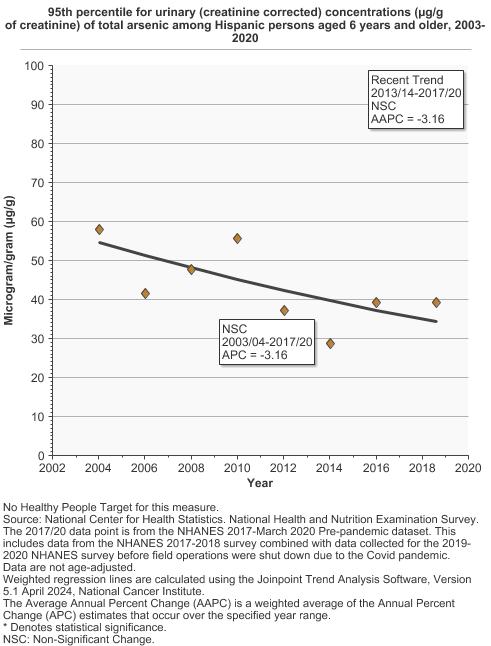
95th percentile for urinary (creatinine corrected) concentrations (µg/g of creatinine) of total arsenic among persons aged 6 years and older by race/ethnicity, 2003-2020 Overview Graph Detailed Trend Graphs Most Recent Estimates (2017 to 2020) Dependent Variable 95% Confidence Interval 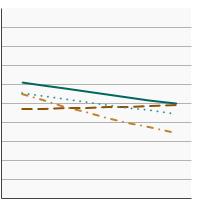
All Races 48.7 42.5 - 57.4 Non-Hispanic White 46.4 34.6 - 54.7 Non-Hispanic Black 44.7 39.8 - 49.4 Hispanic 39.2 32.6 - 68.0 The 2017 to 2020 data point is from the NHANES 2017-March 2020 Pre-pandemic dataset. This includes data from the NHANES 2017-2018 survey combined with data collected for the 2019-2020 NHANES survey before field operations were shut down due to the Covid pandemic. - By Age
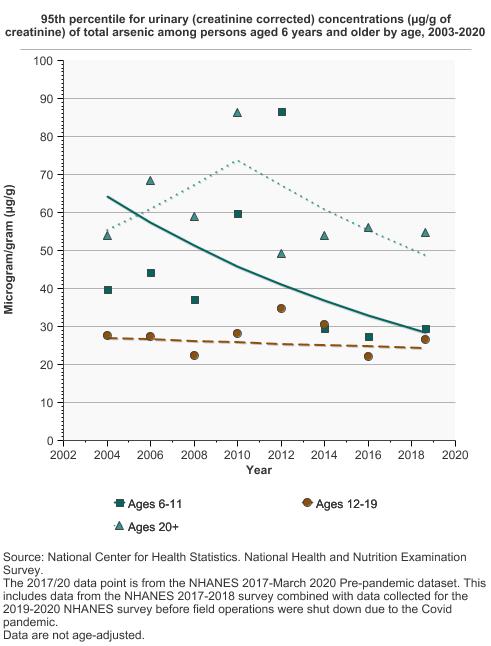
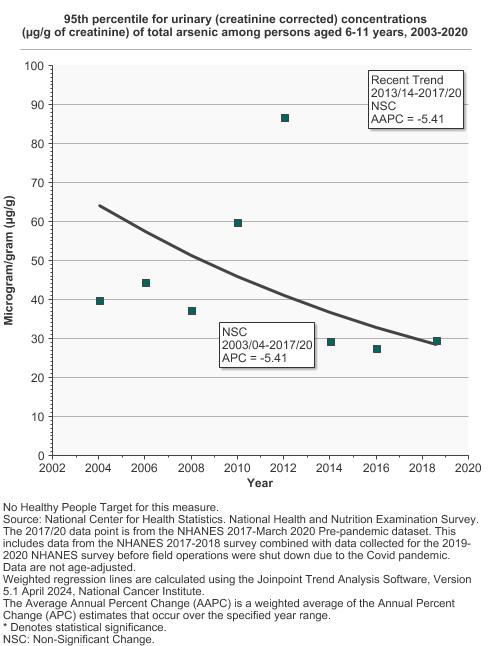
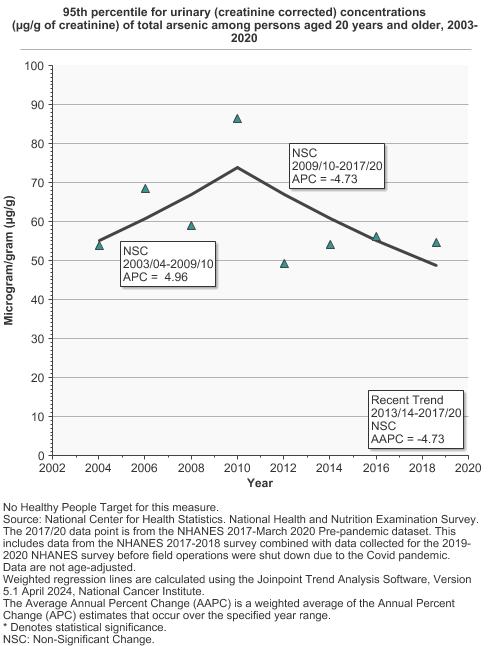
95th percentile for urinary (creatinine corrected) concentrations (µg/g of creatinine) of total arsenic among persons aged 6 years and older by age, 2003-2020 Overview Graph Detailed Trend Graphs Most Recent Estimates (2017 to 2020) Dependent Variable 95% Confidence Interval 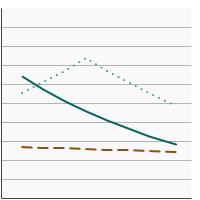
Ages 6-11 29.6 22.9 - 42.8 Ages 12-19 26.5 17.1 - 43.1 Ages 20+ 54.6 45.6 - 69.6 The 2017 to 2020 data point is from the NHANES 2017-March 2020 Pre-pandemic dataset. This includes data from the NHANES 2017-2018 survey combined with data collected for the 2019-2020 NHANES survey before field operations were shut down due to the Covid pandemic. - By Poverty Income Level
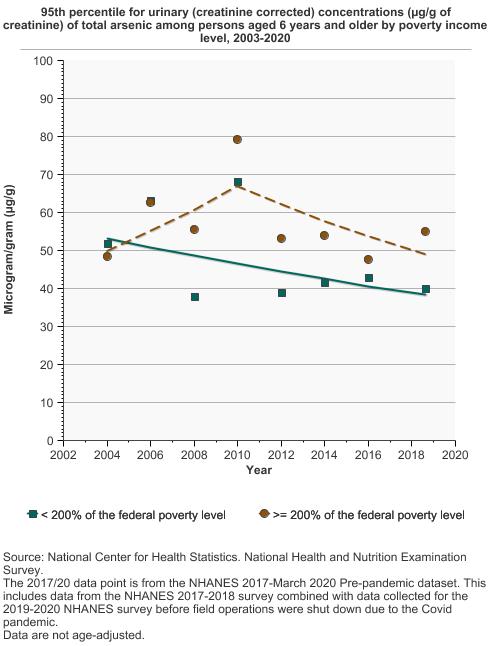
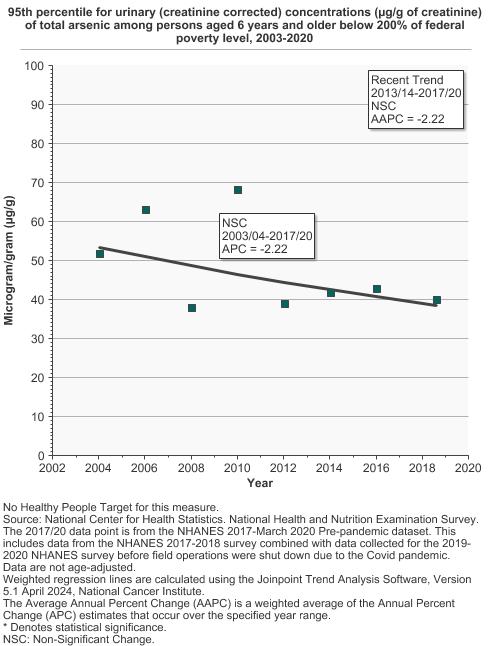
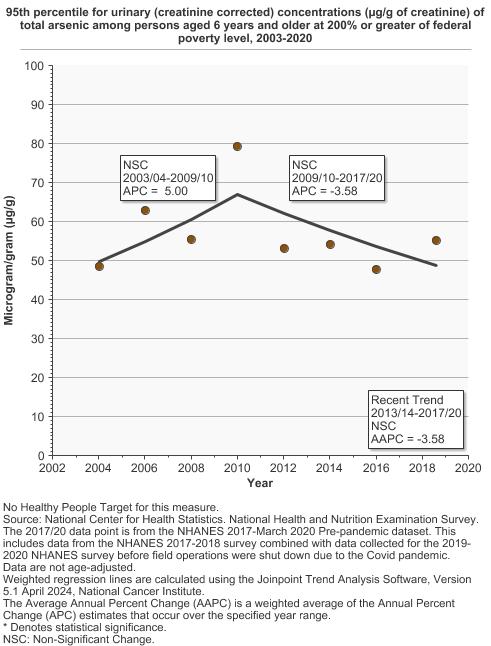
95th percentile for urinary (creatinine corrected) concentrations (µg/g of creatinine) of total arsenic among persons aged 6 years and older by poverty income level, 2003-2020 Overview Graph Detailed Trend Graphs Most Recent Estimates (2017 to 2020) Dependent Variable 95% Confidence Interval 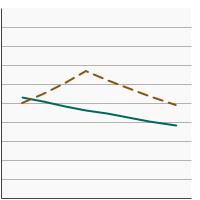
< 200% of the federal poverty level 40.0 31.6 - 51.0 >= 200% of the federal poverty level 55.1 39.6 - 72.3 The 2017 to 2020 data point is from the NHANES 2017-March 2020 Pre-pandemic dataset. This includes data from the NHANES 2017-2018 survey combined with data collected for the 2019-2020 NHANES survey before field operations were shut down due to the Covid pandemic. - By Education Level
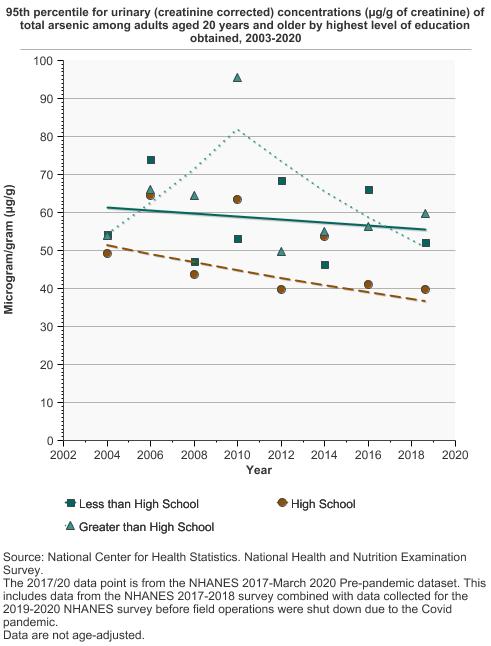
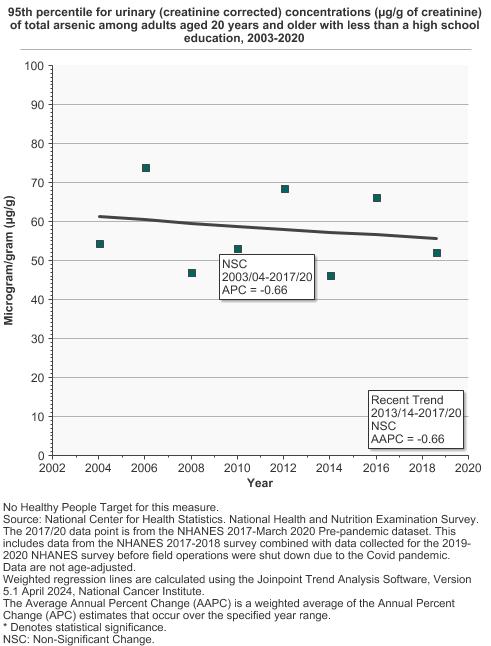
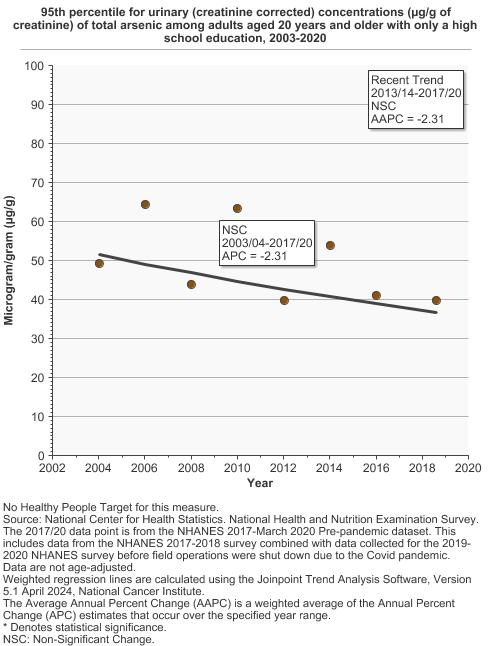
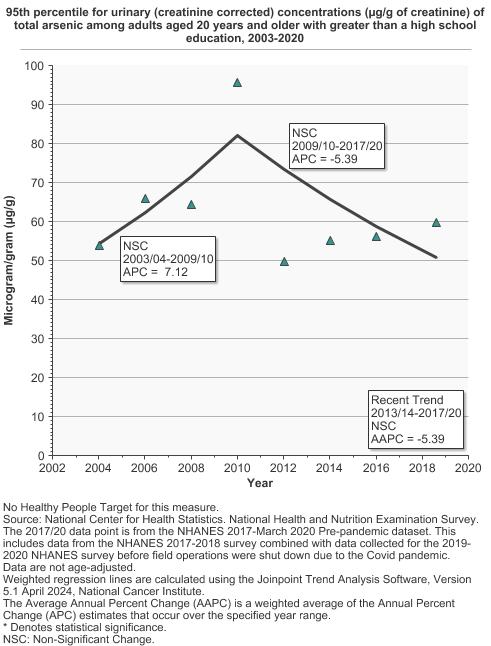
95th percentile for urinary (creatinine corrected) concentrations (µg/g of creatinine) of total arsenic among adults aged 20 years and older by highest level of education obtained, 2003-2020 Overview Graph Detailed Trend Graphs Most Recent Estimates (2017 to 2020) Dependent Variable 95% Confidence Interval 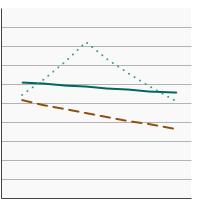
Less than High School 52.2 38.1 - 87.3 High School 39.8 24.7 - 81.1 Greater than High School 59.8 46.9 - 74.7 The 2017 to 2020 data point is from the NHANES 2017-March 2020 Pre-pandemic dataset. This includes data from the NHANES 2017-2018 survey combined with data collected for the 2019-2020 NHANES survey before field operations were shut down due to the Covid pandemic. - By Smoking Status
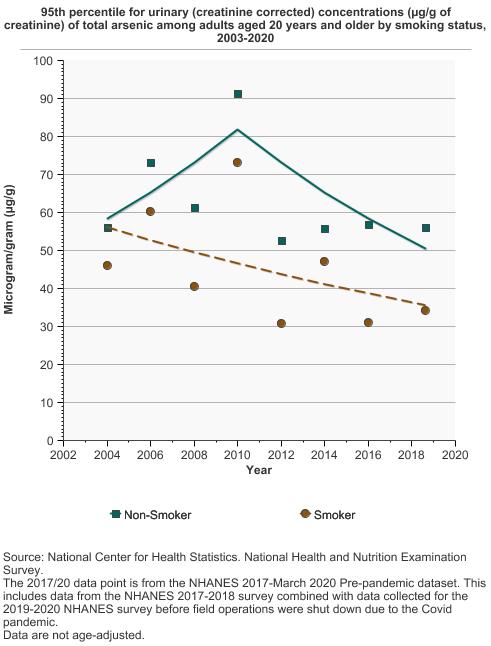
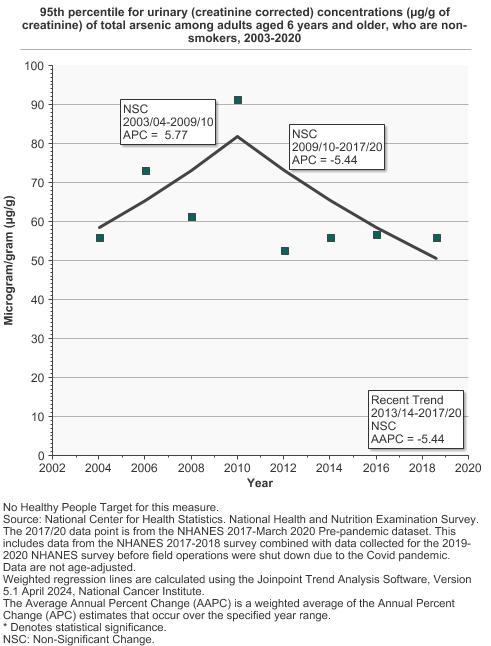
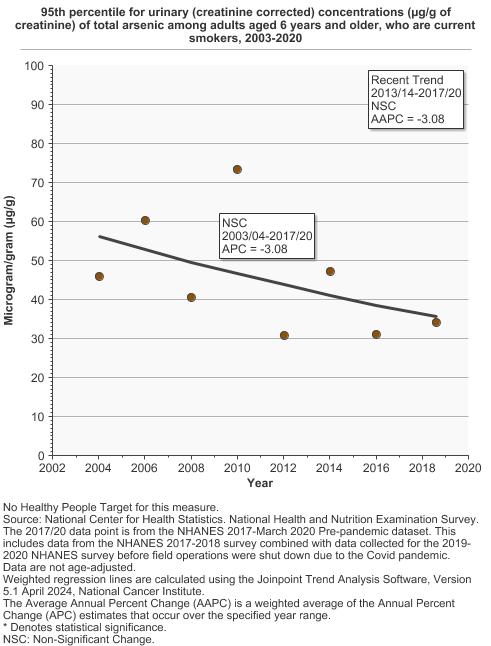
95th percentile for urinary (creatinine corrected) concentrations (µg/g of creatinine) of total arsenic among adults aged 20 years and older by smoking status, 2003-2020 Overview Graph Detailed Trend Graphs Most Recent Estimates (2017 to 2020) Dependent Variable 95% Confidence Interval 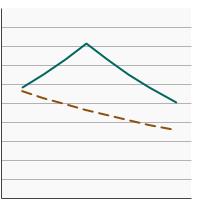
Non-Smoker 56.0 46.7 - 71.4 Smoker 34.2 22.5 - 49.7 The 2017 to 2020 data point is from the NHANES 2017-March 2020 Pre-pandemic dataset. This includes data from the NHANES 2017-2018 survey combined with data collected for the 2019-2020 NHANES survey before field operations were shut down due to the Covid pandemic.
- Inorganic Arsenic Exposure
- By Sex
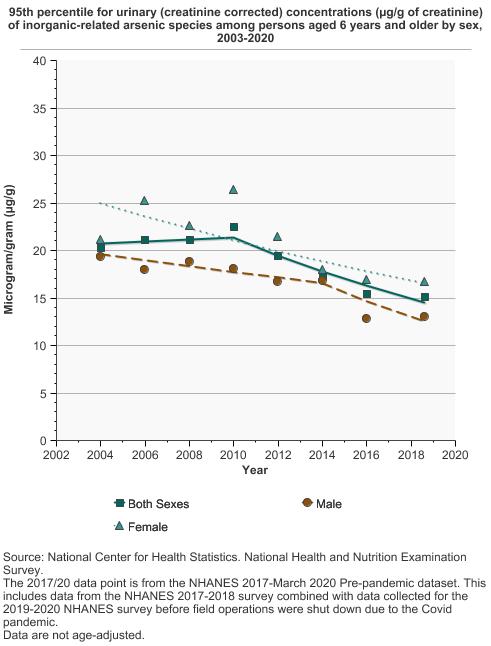
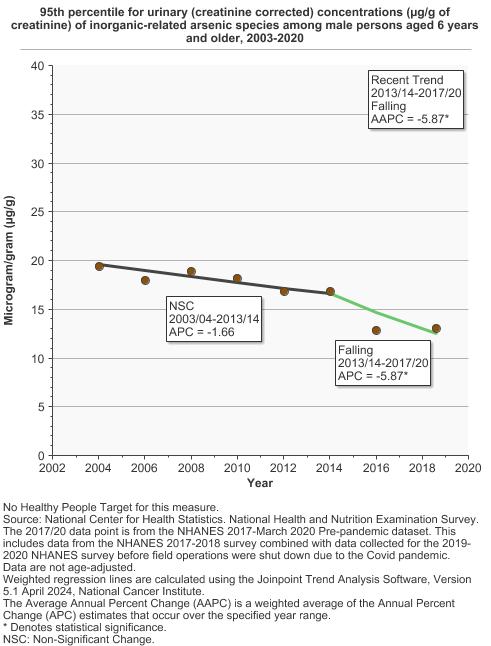
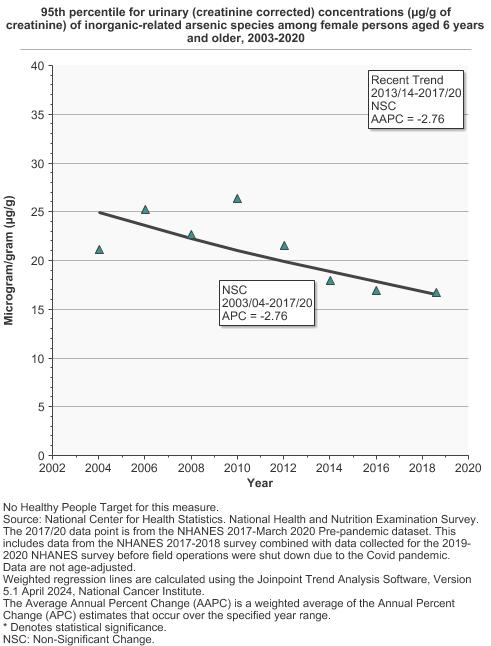
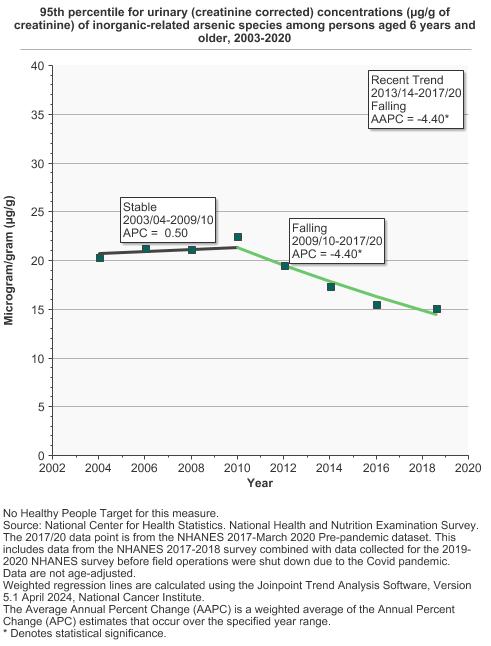
95th percentile for urinary (creatinine corrected) concentrations (µg/g of creatinine) of inorganic-related arsenic species among persons aged 6 years and older by sex, 2003-2020 Overview Graph Detailed Trend Graphs Most Recent Estimates (2017 to 2020) Dependent Variable 95% Confidence Interval 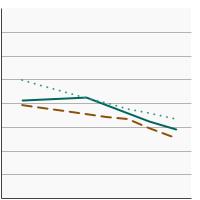
Both Sexes 15.1 13.5 - 16.9 Male 13.1 10.7 - 15.1 Female 16.7 15.0 - 20.4 The 2017 to 2020 data point is from the NHANES 2017-March 2020 Pre-pandemic dataset. This includes data from the NHANES 2017-2018 survey combined with data collected for the 2019-2020 NHANES survey before field operations were shut down due to the Covid pandemic. - By Race/Ethnicity
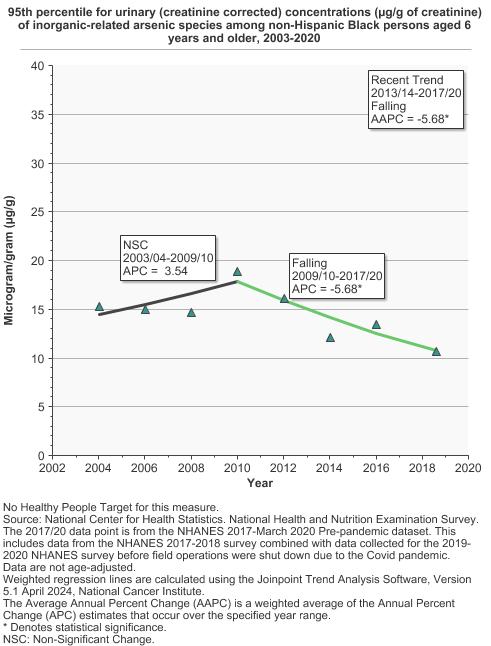
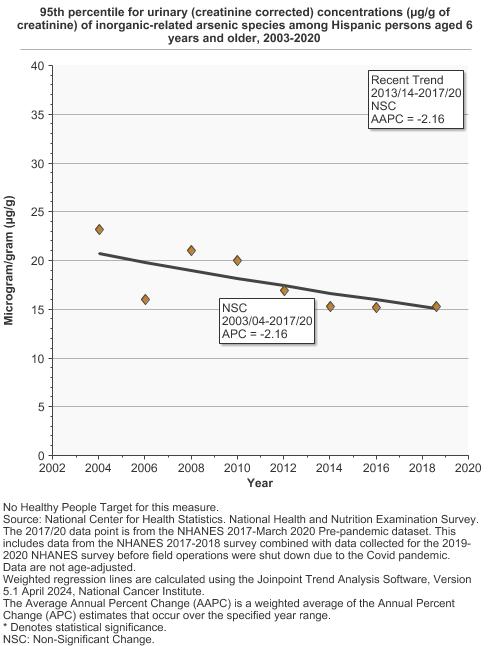
95th percentile for urinary (creatinine corrected) concentrations (µg/g of creatinine) of inorganic-related arsenic species among persons aged 6 years and older by race/ethnicity, 2003-2020 Overview Graph Detailed Trend Graphs Most Recent Estimates (2017 to 2020) Dependent Variable 95% Confidence Interval 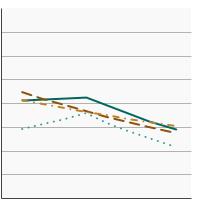
All Races 15.1 13.5 - 16.9 Non-Hispanic White 13.6 12.6 - 14.8 Non-Hispanic Black 10.7 9.2 - 13.8 Hispanic 15.3 12.8 - 18.7 The 2017 to 2020 data point is from the NHANES 2017-March 2020 Pre-pandemic dataset. This includes data from the NHANES 2017-2018 survey combined with data collected for the 2019-2020 NHANES survey before field operations were shut down due to the Covid pandemic.


Additional Information
- Arsenic. National Cancer Institute.
- Toxic Substances Portal – Arsenic: Public Health Statement for Arsenic. Agency for Toxic Substances and Disease Registry.
- Toxic Substances Portal – Arsenic: ToxFAQs™ for Arsenic. Agency for Toxic Substances and Disease Registry.
- Arsenic and Cancer Risk. American Cancer Society.
- Known and Probable Human Carcinogens. American Cancer Society.
- Fourth National Report on Human Exposure to Environmental Chemicals: Updated Tables, March 2018, Volume One. Centers for Disease Control and Prevention.
- Fourth National Report on Human Exposure to Environmental Chemicals: Updated Tables, March 2018, Volume Two. Centers for Disease Control and Prevention.
- Fact Sheet on Arsenic. Centers for Disease Control and Prevention.
- Occupational Cancer. Centers for Disease Control and Prevention.
- Drinking Water Requirements for States and Public Water Systems: Chemical Contaminant Rules. Environmental Protection Agency.
- Arsenic in Drinking Water. U.S. Geological Survey, National Water-Quality Assessment Program, Trace Elements National Synthesis Project.
- Environmental Health and Medicine Education – Arsenic Toxicity. Agency for Toxic Substances and Disease Registry.
- Arsenic, Cadmium, Chromium, Lead. Agency for Toxic Substances and Disease Registry.
- Minimal Risk Levels (MRLs) for Hazardous Substances. Agency for Toxic Substances and Disease Registry.
- Toxic Substances Portal – Arsenic. Agency for Toxic Substances and Disease Registry.
- Toxic Substances Portal – Arsenic: Toxicological Profile for Arsenic. Agency for Toxic Substances and Disease Registry.
- Arsenic, inorganic. Environmental Protection Agency, Integrated Risk Information System.
- New England Bladder Cancer Study. National Cancer Institute, Division of Cancer Epidemiology & Genetics.
- Bladder cancer mortality and private well use in New England: an ecological study. Ayotte JD, Baris D, Cantor KP, et al. J Epidemiol Community Health 2006;60:168–172.
- Ingested arsenic, cigarette smoking, and lung cancer risk: a follow-up study in arseniasis-endemic areas in Taiwan. Chen CL, Hsu LI, Chiou HY, et al. JAMA 2004;292:2984–90.
- Dietary sources of methylated arsenic species in urine of the United States population, NHANES 2003-2010. deCastro BR, Caldwell KL, Jones RL, et al. PLoS One 2014;9(9):e108098.
- Arsenic, Metals, Fibres, and Dusts. International Agency for Research on Cancer. IARC Monographs on the Evaluation of Carcinogenic Risks to Humans 2012;100(c):41–93.
- Some Drinking-Water Disinfectants and Contaminants, including Arsenic. International Agency for Research on Cancer. IARC Monographs on the Evaluation of Carcinogenic Risks to Humans 2004;84:41–267.
- Estimating water supply arsenic levels in the New England bladder cancer study. Nuckols JR, Freeman LEB, Lubin JH, et al. Environ Health Perspect 2011;119(9):1279–1285.
- The Chemical Composition of Tobacco and Tobacco Smoke. Rodgman A, Perfetti TA. CRC Press; Boca Raton, FL, USA: 2009.
- Arsenic and Inorganic Arsenic Compounds. U.S. Department of Health and Human Services, National Toxicology Program. Report on Carcinogens, Fourteenth Edition 2016.