On This Page:
- Background
- Measure
- Healthy People 2030 Target
- Data Source
- Trends and Most Recent Estimates
- Related Cancers
- Additional Information
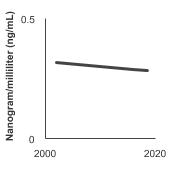
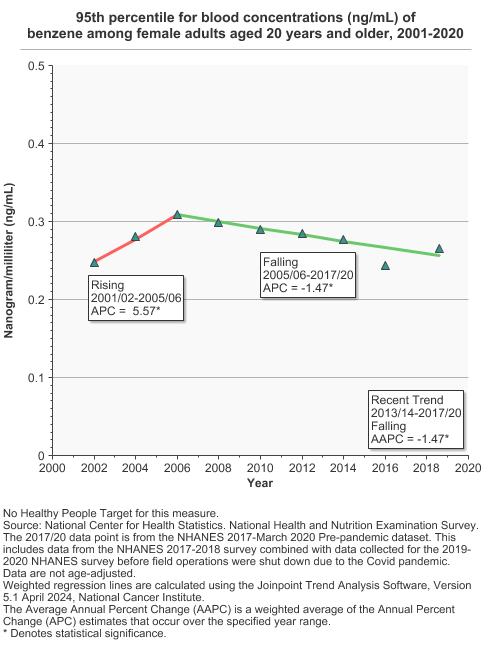
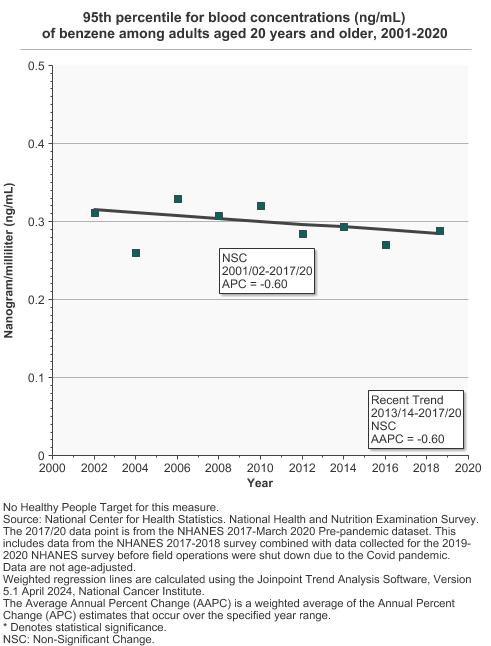
From 2017 to 2020, the 95th percentile for blood concentration of benzene among persons aged 20 years and older was 0.3 ng/mL.

Background
Benzene is an organic chemical that is colorless and has a sweet odor. It is highly flammable, and evaporates quickly when exposed to air. Benzene is formed through natural processes such as volcanoes and forest fires, and is present in crude oil, gasoline, and cigarette smoke. Most exposure to benzene results from human activities. Benzene use in materials and to adjust fuel octane levels has been minimized, resulting in reduced benzene exposure among non-smokers. Cigarette smoking has been shown to be the primary exposure source of benzene blood levels in the U.S., with some benzene exposure in non-smokers attributable to secondhand smoke exposure. The chemical is widely used as a component of plastics, rubber, resins, and synthetic fabrics; an additive in motor fuels; a solvent in printing, paints, and dry cleaning; and for other purposes. Benzene is also used in the manufacture of detergents, explosives, pharmaceuticals, and dyestuffs.
Benzene has been identified as a cause of acute non-lymphocytic leukemia, including acute myeloid leukemia (AML) in adults. An article published in The Lancet Oncology, provides evidence that benzene might be related to other myeloid and certain lymphoid malignancies.
The main way people are exposed is by breathing in air containing benzene—in emissions from burning coal and oil, motor vehicle exhaust, evaporation from gasoline tanks and service stations, and in industrial solvents. It is estimated that about half of the exposure to benzene in the United States results from smoking tobacco or from exposure to tobacco smoke. It can also be absorbed through the skin during contact with a source such as gasoline, but because liquid benzene evaporates quickly, this is less common.
Measure
We present exposure data on the 95th percentile of the population, representing people with the greatest exposure. The 95th percentile level means that 95% of the population has concentrations below that level. Public health officials use such reference values to determine whether groups of people are experiencing an exposure that is unusual compared with an exposure experienced by the rest of the population. For more information, see the National Report on Human Exposure to Environmental Chemicals, published by the Centers for Disease Control and Prevention.
To calculate whether the differences between 95th percentiles for two different time points are statistically significant, we used a different statistical methodology than that used by the National Center for Environmental Health, which publishes the National Report on Human Exposure to Environmental Chemicals, from which our data are derived. Our estimates may differ slightly from those in the original report due to differences in statistical procedures used. [Methodology]
Data Source
Centers for Disease Control and Prevention, National Center for Health Statistics, National Health and Nutrition Examination Survey (NHANES).
The NHANES 2017-2018 data point was replaced with the NHANES 2017-March 2020 Pre-pandemic data point. More information is available at NHANES Questionnaires, Datasets, and Related Documentation.
Healthy People 2030 Target
There are no Healthy People 2030 targets regarding blood concentration of benzene.
Healthy People 2030 is a set of goals set forth by the Department of Health and Human Services.
Trends and Most Recent Estimates
- By Sex
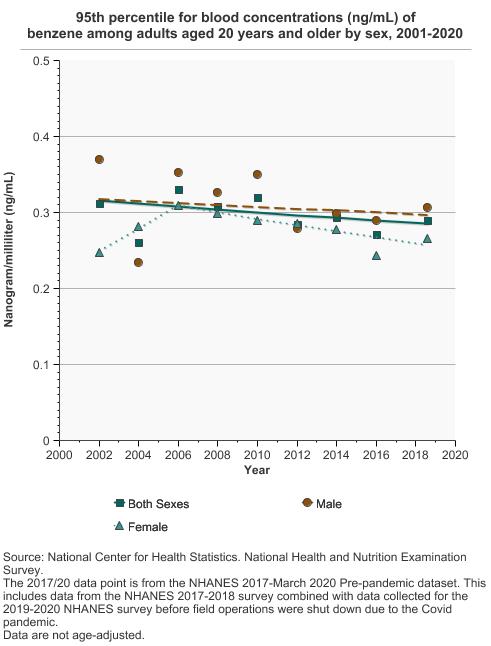
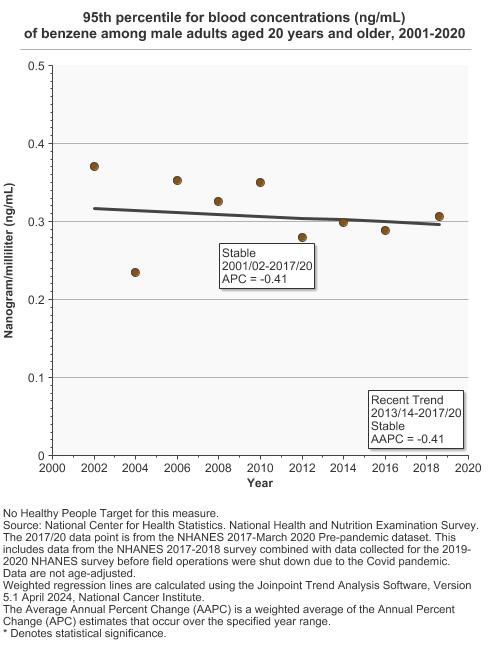
95th percentile for blood concentrations (ng/mL) of benzene among adults aged 20 years and older by sex, 2001-2020 Overview Graph Detailed Trend Graphs Most Recent Estimates (2017 to 2020) Dependent Variable 95% Confidence Interval 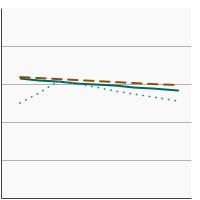

Both Sexes 
0.3 0.2 - 0.3 Male 0.3 0.3 - 0.4 Female 0.3 0.2 - 0.4 The 2017 to 2020 data point is from the NHANES 2017-March 2020 Pre-pandemic dataset. This includes data from the NHANES 2017-2018 survey combined with data collected for the 2019-2020 NHANES survey before field operations were shut down due to the Covid pandemic. - By Race/Ethnicity
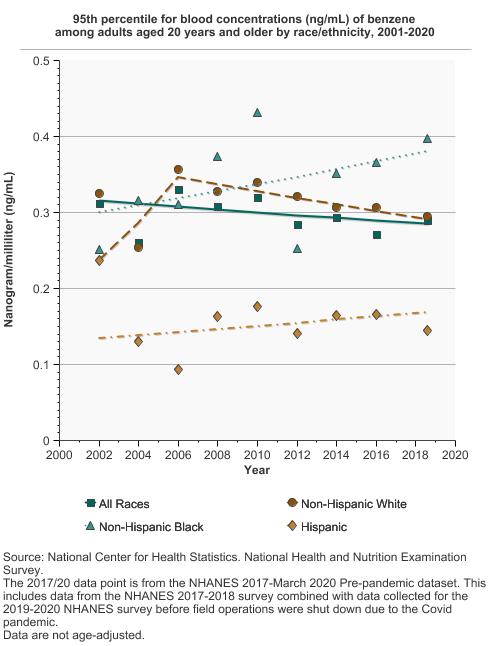
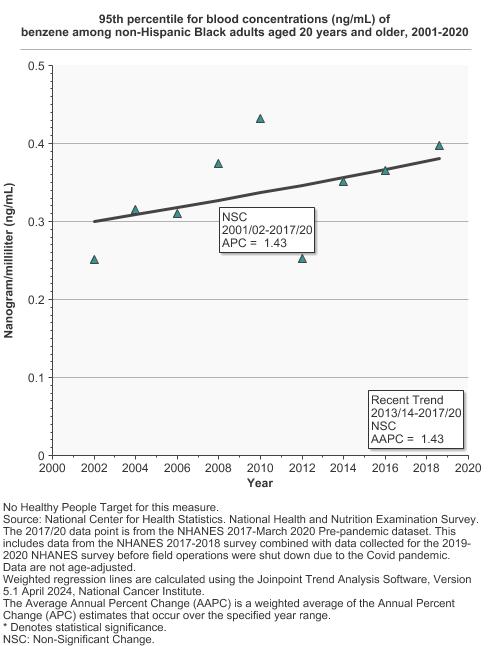
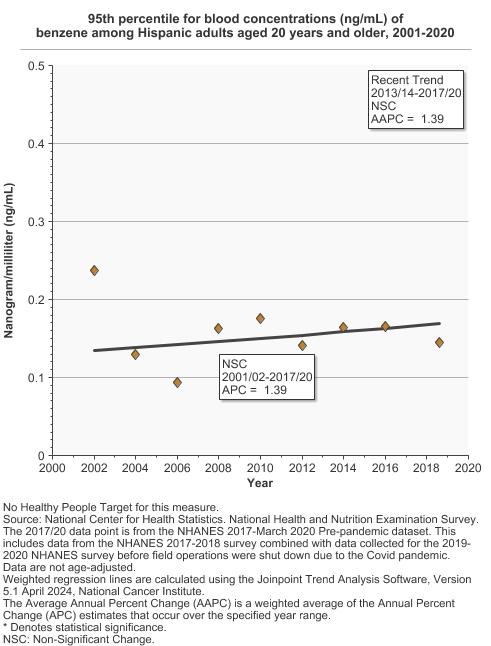
95th percentile for blood concentrations (ng/mL) of benzene among adults aged 20 years and older by race/ethnicity, 2001-2020 Overview Graph Detailed Trend Graphs Most Recent Estimates (2017 to 2020) Dependent Variable 95% Confidence Interval 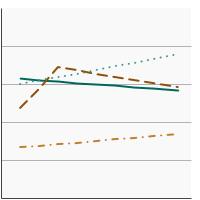
All Races 0.3 0.2 - 0.3 Non-Hispanic White 0.3 0.2 - 0.4 Non-Hispanic Black 0.4 0.3 - 0.5 Hispanic 0.1 0.1 - 0.2 The 2017 to 2020 data point is from the NHANES 2017-March 2020 Pre-pandemic dataset. This includes data from the NHANES 2017-2018 survey combined with data collected for the 2019-2020 NHANES survey before field operations were shut down due to the Covid pandemic. - By Poverty Income Level
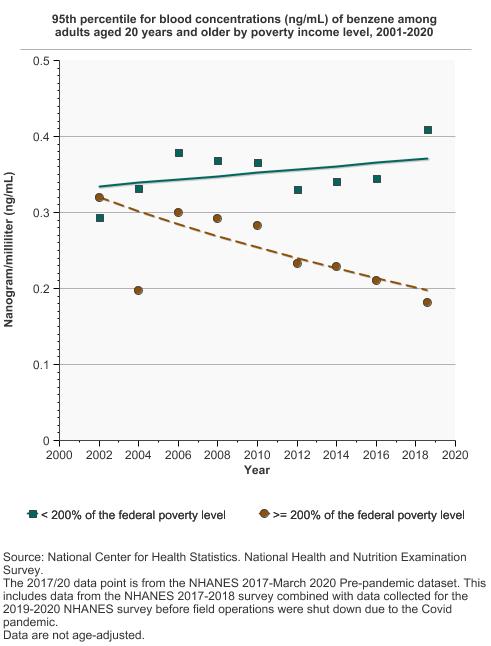
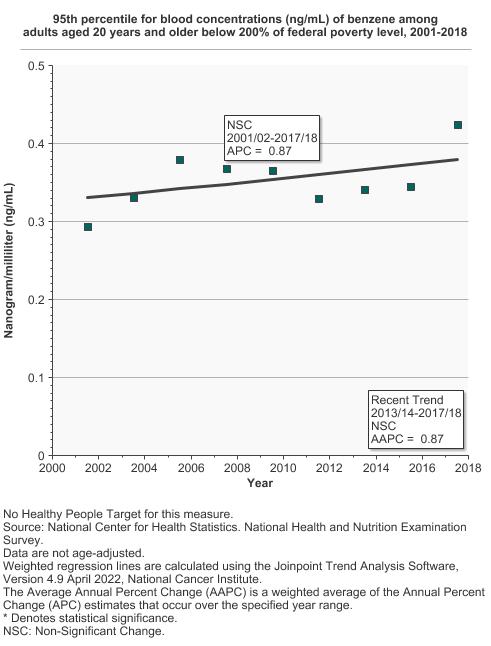
95th percentile for blood concentrations (ng/mL) of benzene among adults aged 20 years and older by poverty income level, 2001-2020 Overview Graph Detailed Trend Graphs Most Recent Estimates (2017 to 2020) Dependent Variable 95% Confidence Interval 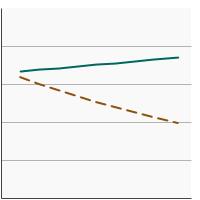
< 200% of the federal poverty level 0.4 0.3 - 0.5 >= 200% of the federal poverty level 0.2 0.1 - 0.2 The 2017 to 2020 data point is from the NHANES 2017-March 2020 Pre-pandemic dataset. This includes data from the NHANES 2017-2018 survey combined with data collected for the 2019-2020 NHANES survey before field operations were shut down due to the Covid pandemic. - By Education Level
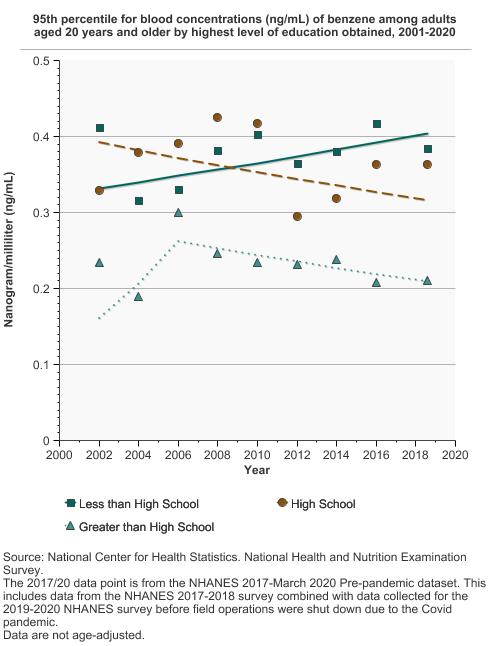
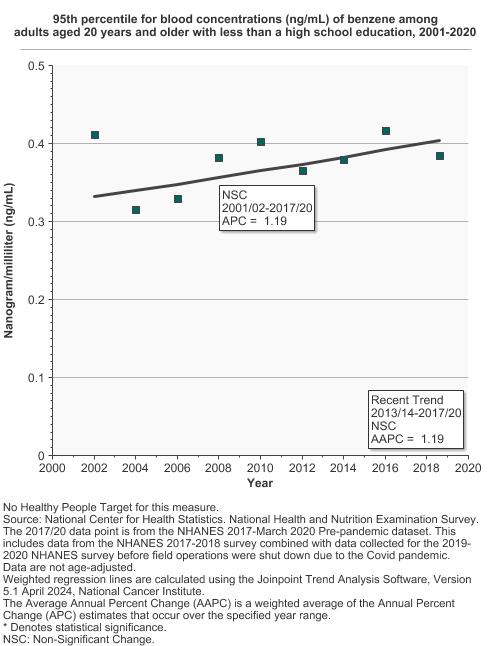
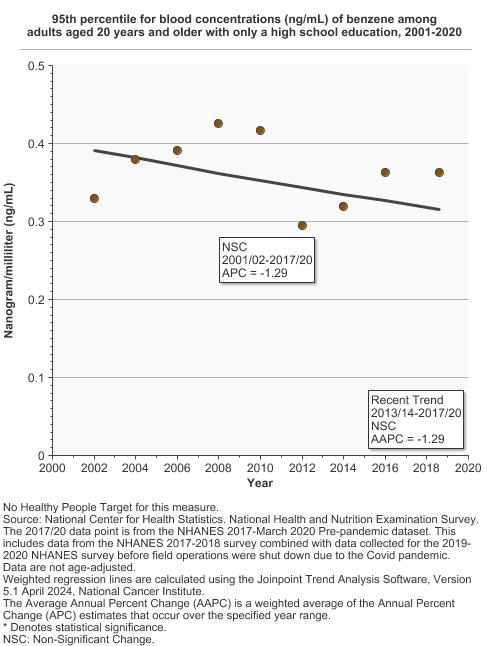
95th percentile for blood concentrations (ng/mL) of benzene among adults aged 20 years and older by highest level of education obtained, 2001-2020 Overview Graph Detailed Trend Graphs Most Recent Estimates (2017 to 2020) Dependent Variable 95% Confidence Interval 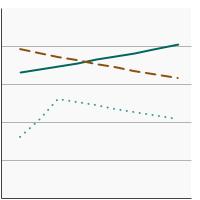
Less than High School 0.4 0.3 - 0.5 High School 0.4 0.3 - 0.4 Greater than High School 0.2 0.2 - 0.3 The 2017 to 2020 data point is from the NHANES 2017-March 2020 Pre-pandemic dataset. This includes data from the NHANES 2017-2018 survey combined with data collected for the 2019-2020 NHANES survey before field operations were shut down due to the Covid pandemic. - By Smoking Status
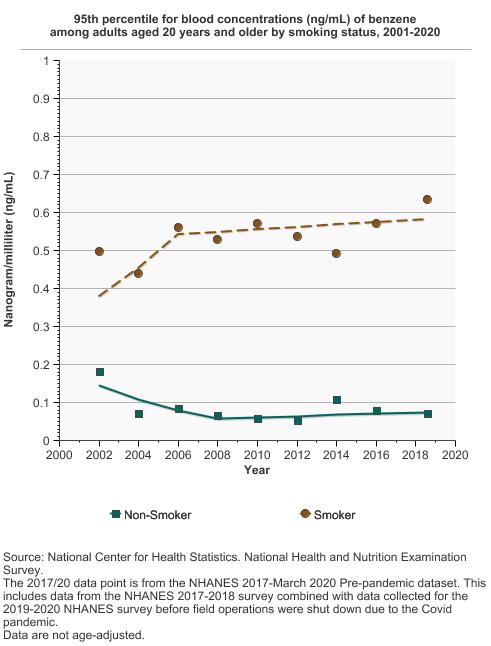
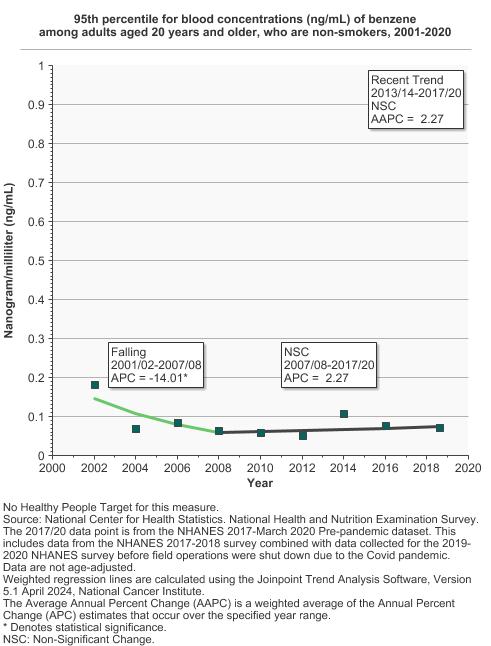
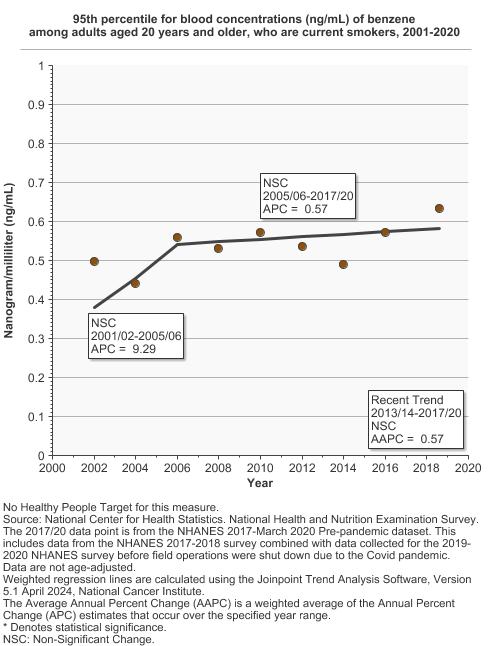
95th percentile for blood concentrations (ng/mL) of benzene among adults aged 20 years and older by smoking status, 2001-2020 Overview Graph Detailed Trend Graphs Most Recent Estimates (2017 to 2020) Dependent Variable 95% Confidence Interval 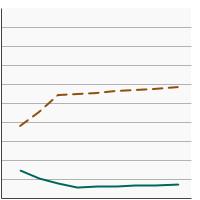
Non-Smoker 0.1 0.1 - 0.1 Smoker 0.6 0.5 - 0.7 The 2017 to 2020 data point is from the NHANES 2017-March 2020 Pre-pandemic dataset. This includes data from the NHANES 2017-2018 survey combined with data collected for the 2019-2020 NHANES survey before field operations were shut down due to the Covid pandemic.


Additional Information
- Toxic Substances Portal – Toxicological Profile for Benzene. Agency for Toxic Substances & Disease Registry.
- Benzene and Cancer Risk. American Cancer Society.
- Known and Probable Human Carcinogens. American Cancer Society.
- Facts about Benzene. Centers for Disease Control and Prevention.
- Fourth National Report on Human Exposure to Environmental Chemicals: Updated Tables, March 2018, Volume One. Centers for Disease Control and Prevention.
- Fourth National Report on Human Exposure to Environmental Chemicals: Updated Tables, March 2018, Volume Two. Centers for Disease Control and Prevention.
- Drinking Water Requirements for States and Public Water Systems: Chemical Contaminant Rules. Environmental Protection Agency.
- Benzene. Environmental Protection Agency.
- Benzene. National Library of Medicine.
- Benzene. U.S. Department of Labor, Occupational Safety & Health Administration.
- Minimal Risk Levels (MRLs) for Hazardous Substances. Agency for Toxic Substances & Disease Registry.
- Benzene. Environmental Protection Agency, Integrated Risk Information System.
- Benzene-associated hematoxity and carcinogenicity. National Cancer Institute, Division of Cancer Epidemiology & Genetics.
- Benzene-exposed workers in China. National Cancer Institute, Occupational and Environmental Epidemiology Branch.
- Toxicological Profile for Benzene. Agency for Toxic Substances & Disease Registry.
- Impact of Cigarette Smoking on Volatile Organic Compound (VOC) Blood Levels in the U.S. Population: NHANES 2003-2004. Chambers D, Ocariz JM, McGuirk M, Blount BC. Environ Int. 2011 Nov;37(8):1321-8.
- Chemical Agents and Related Occupations. International Agency for Research on Cancer. IARC Monographs on the Evaluation of Carcinogenic Risks to Humans 2012;100f:249-294.
- Carcinogenicity of benzene. Loomis D, Guyton KZ, Grosse Y, et al. Lancet Oncol. 2017;18(12):1574-1575.