On This Page:
- Background
- Measure
- Healthy People 2030 Target
- Data Source
- Trends and Most Recent Estimates
- Related Cancers
- Additional Information
From 2017 to 2020, the 95th percentile for blood concentration of serum perfluorooctanoic acid (PFOA) among persons aged 12 years and older was 3.6 ng/mL.

Background
Per- and poly-fluorylaklyl substances (PFAS) are a group of manufactured compounds that consist of carbon-fluoride bonds that make PFAS highly stable and resistant to degradation by metabolic or environmental means. First developed in the 1940s, PFAS became widely popular and are used in a number of commercial, industrial, and consumer applications and products. Some current examples include pesticides, firefighting foams, flame retardants, additives in coatings and paints for buildings, textile products such as repellent coatings, personal care products such as cosmetics and makeup, home products such as non-stick coatings for pans, and the development of electronic and semiconductor products.
With its unique chemical and physical properties, PFAS have been designated as “forever chemicals.” Biomonitoring studies have shown that PFAS are ubiquitous in soil and water, and detected in humans. In both occupational and non-occupational settings, the routes of exposures are ingestion of contaminated food and drinking water, inhalation via air or dust particulate, or dermal contact. PFAS exposure has been reported to be associated with hepatic, cardiovascular, immune, reproductive, and developmental effects in humans and animals. Perfluorooctanoic acid (PFOA), one of the most well-studied PFAS chemicals, is associated with kidney and testicular cancers.
However, much of the scientific knowledge of the risk to humans from PFAS exposure is limited by the nature of how previous studies have been conducted. For example, some human studies did not collect any information on historical exposure. Among those that may have historical exposures, collected biological specimens such as blood, and/or have information of specific outcomes of interest, many were cross-sectional in design and thus were only able to evaluate the associations at one specific point in time. These aspects limit the ability to assess any potential relationships between PFAS exposure and health outcomes in terms of establishing causality. Despite this, the growing evidence and awareness of PFAS and detrimental health effects have motivated physicians, scientists, and public health officials about the importance of additional research and regulatory measures on PFAS.
Measure
Over the years, many epidemiologic studies have primarily examined specific PFAS compounds such as PFOA and perfluorooctane sulfonate (PFOS) due to their early discovery and past industrial usage. While other PFAS compounds exist, we focus on PFOA and PFOS due to the existing assessment within the National Health and Nutritional Examination Survey.
We present exposure data on the 95th percentile of the population, representing people with the greatest exposure. The 95th percentile level means that 95% of the population has concentrations below that level. Public health officials use such reference values to determine whether groups of people are experiencing an exposure that is unusual compared with an exposure experienced by the rest of the population. For more information, see the National Report on Human Exposure to Environmental Chemicals, published by the Centers for Disease Control and Prevention.
To calculate whether the differences between 95th percentiles for two different time points are statistically significant, we used a different statistical methodology than that used by the National Center for Environmental Health, which publishes the National Report on Human Exposure to Environmental Chemicals, from which our data are derived. Our estimates may differ slightly from those in the original report due to differences in statistical procedures used. [Methodology]
Data Source
Centers for Disease Control and Prevention, National Center for Health Statistics, National Health and Nutrition Examination Survey (NHANES).
The NHANES 2017-2018 data point was replaced with the NHANES 2017-March 2020 Pre-pandemic data point. More information is available at NHANES Questionnaires, Datasets, and Related Documentation.
Healthy People 2030 Target
There are no Healthy People 2030 targets regarding PFAS as a whole or specific PFAS compounds.
Healthy People 2030 is a set of goals set forth by the Department of Health and Human Services.
Trends and Most Recent Estimates
- Serum Perfluorooctanoic Acid (PFOA)
- By Sex
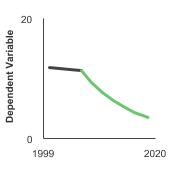
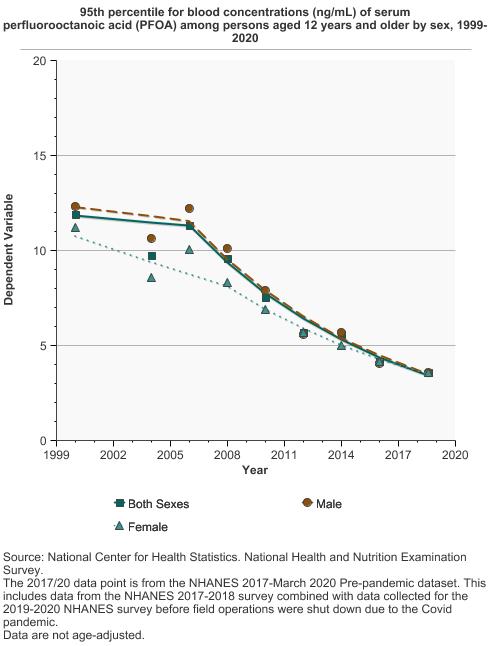
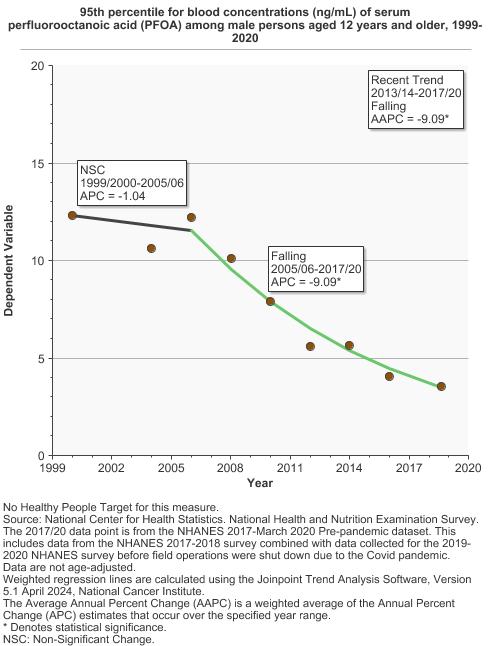
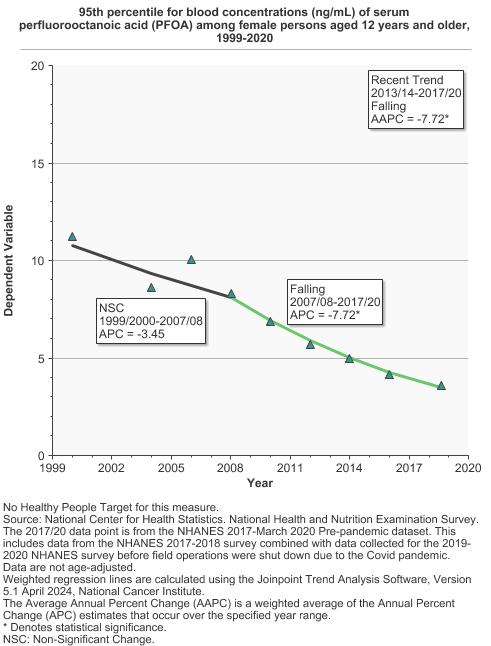
95th percentile for blood concentrations (ng/mL) of serum perfluorooctanoic acid (PFOA) among persons aged 12 years and older by sex, 1999-2020 Overview Graph Detailed Trend Graphs Most Recent Estimates (2017 to 2020) Dependent Variable 95% Confidence Interval 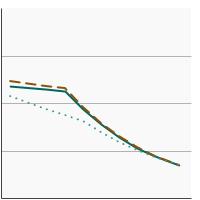

Both Sexes 
3.6 3.4 - 3.9 Male 3.6 3.4 - 3.9 Female 3.6 3.2 - 4.3 The 2017 to 2020 data point is from the NHANES 2017-March 2020 Pre-pandemic dataset. This includes data from the NHANES 2017-2018 survey combined with data collected for the 2019-2020 NHANES survey before field operations were shut down due to the Covid pandemic. - By Race/Ethnicity
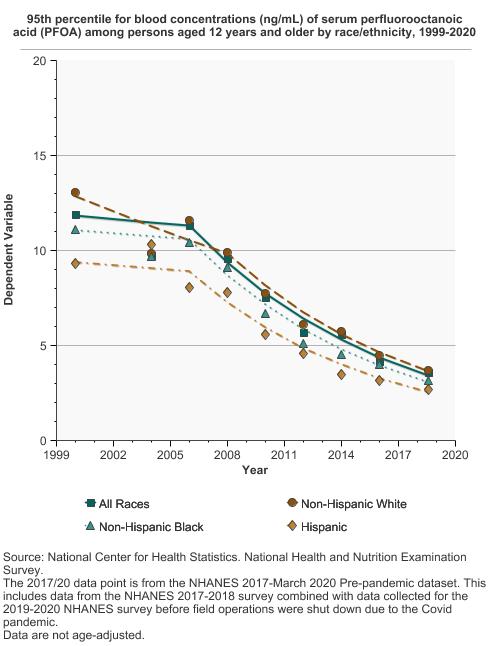
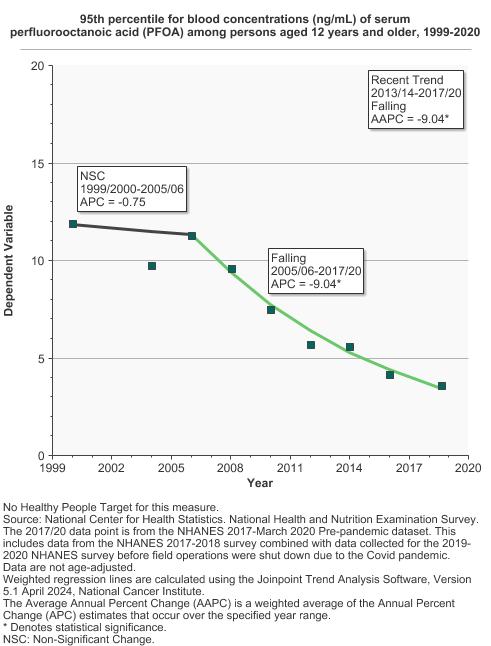
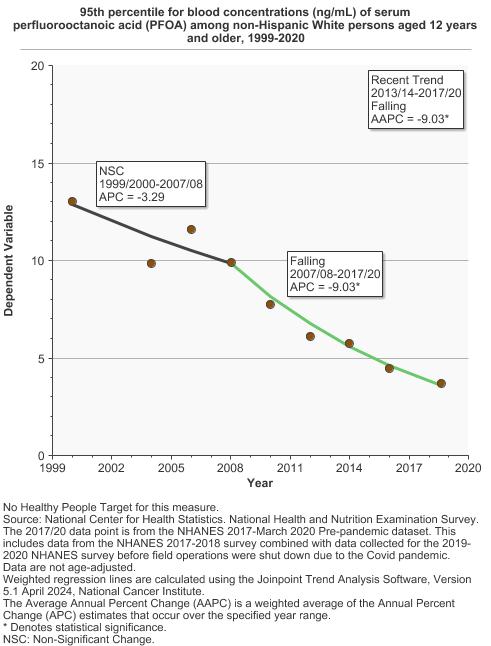
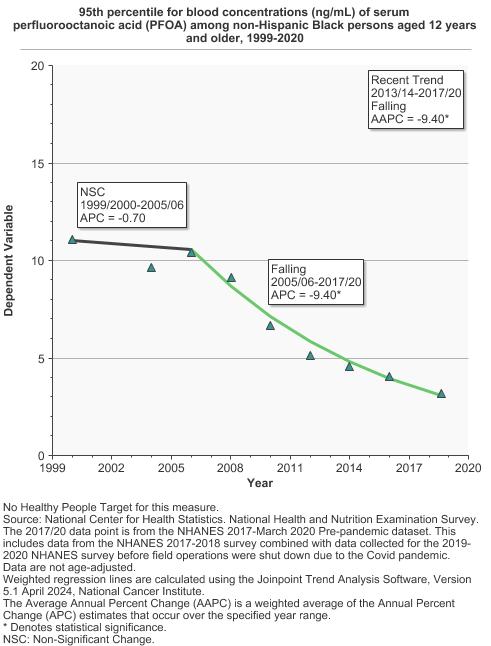
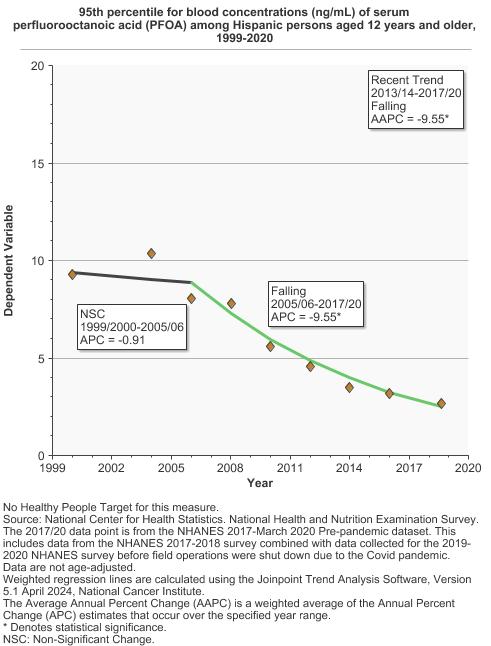
95th percentile for blood concentrations (ng/mL) of serum perfluorooctanoic acid (PFOA) among persons aged 12 years and older by race/ethnicity, 1999-2020 Overview Graph Detailed Trend Graphs Most Recent Estimates (2017 to 2020) Dependent Variable 95% Confidence Interval 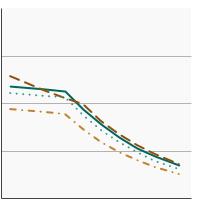
All Races 3.6 3.4 - 3.9 Non-Hispanic White 3.7 3.4 - 4.2 Non-Hispanic Black 3.2 2.8 - 3.5 Hispanic 2.7 2.5 - 3.0 The 2017 to 2020 data point is from the NHANES 2017-March 2020 Pre-pandemic dataset. This includes data from the NHANES 2017-2018 survey combined with data collected for the 2019-2020 NHANES survey before field operations were shut down due to the Covid pandemic. - By Poverty Income Level
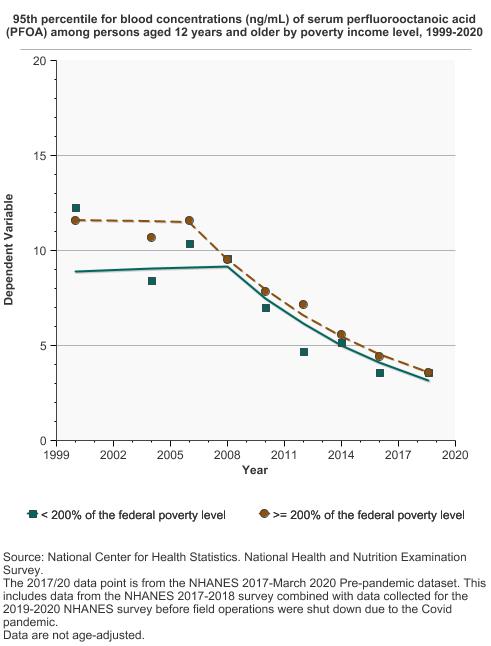
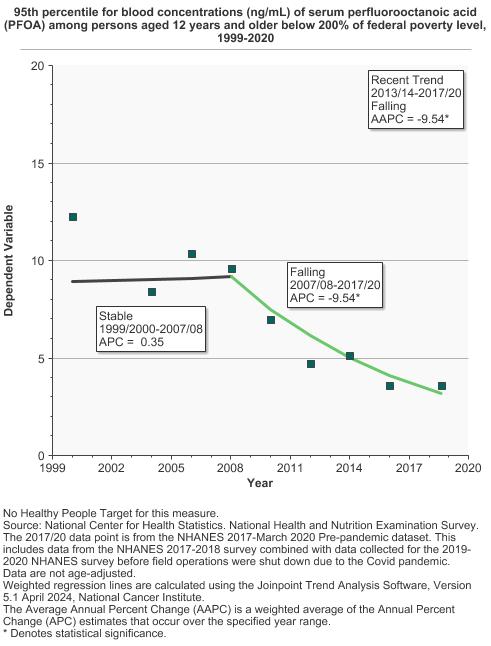
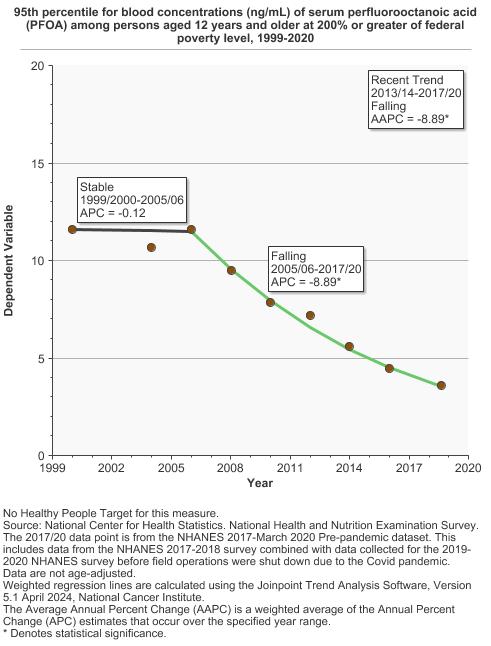
95th percentile for blood concentrations (ng/mL) of serum perfluorooctanoic acid (PFOA) among persons aged 12 years and older by poverty income level, 1999-2020 Overview Graph Detailed Trend Graphs Most Recent Estimates (2017 to 2020) Dependent Variable 95% Confidence Interval 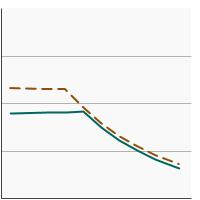
< 200% of the federal poverty level 3.6 3.0 - 4.0 >= 200% of the federal poverty level 3.6 3.3 - 4.1 The 2017 to 2020 data point is from the NHANES 2017-March 2020 Pre-pandemic dataset. This includes data from the NHANES 2017-2018 survey combined with data collected for the 2019-2020 NHANES survey before field operations were shut down due to the Covid pandemic. - By Education Level
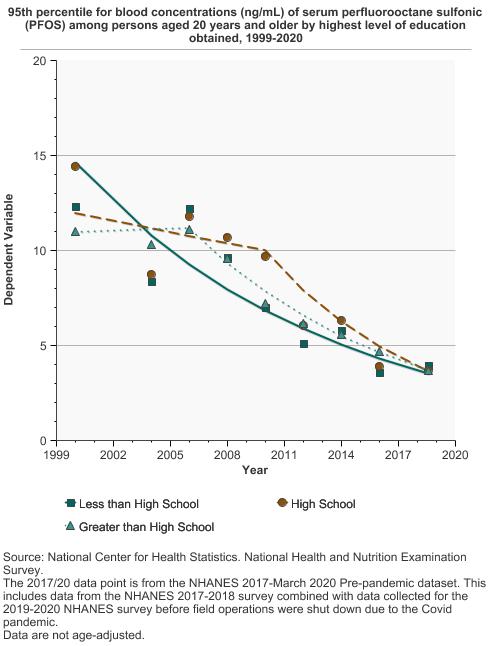
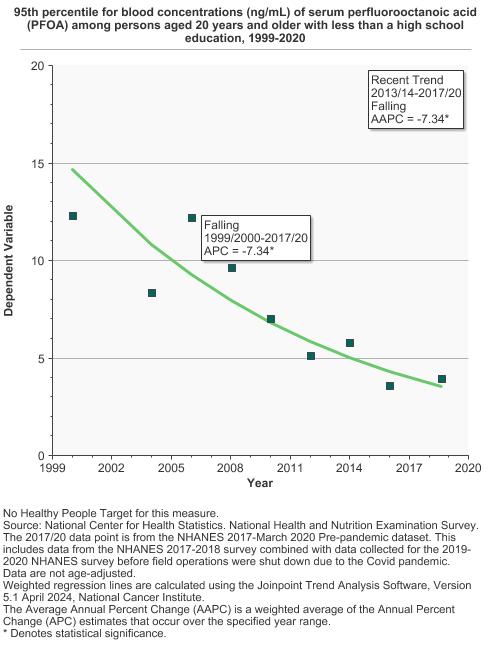
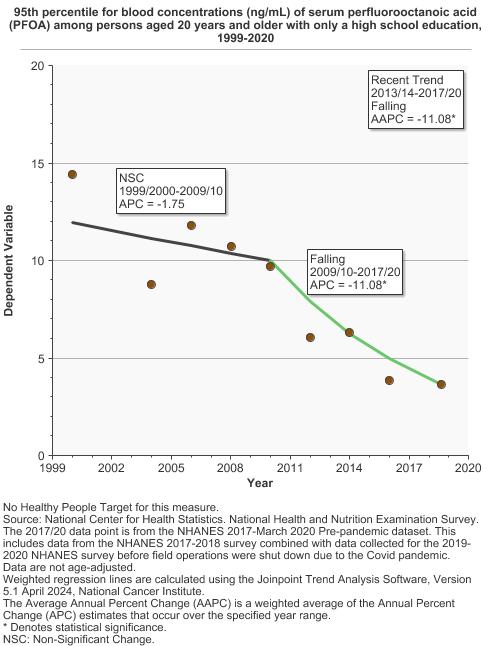
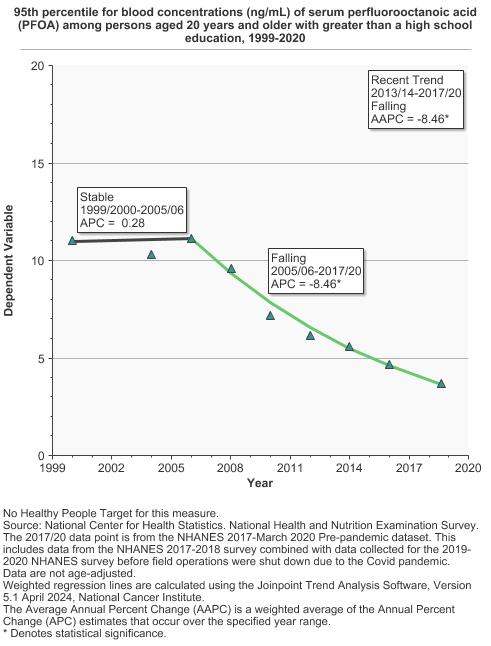
95th percentile for blood concentrations (ng/mL) of serum perfluorooctane sulfonic (PFOS) among persons aged 20 years and older by highest level of education obtained, 1999-2020 Overview Graph Detailed Trend Graphs Most Recent Estimates (2017 to 2020) Dependent Variable 95% Confidence Interval 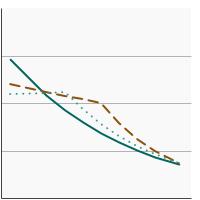
Less than High School 4.0 3.5 - 4.5 High School 3.7 3.0 - 3.8 Greater than High School 3.7 3.5 - 4.5 The 2017 to 2020 data point is from the NHANES 2017-March 2020 Pre-pandemic dataset. This includes data from the NHANES 2017-2018 survey combined with data collected for the 2019-2020 NHANES survey before field operations were shut down due to the Covid pandemic.
- Serum Perfluorooctane Sulfonic (PFOS)
- By Sex
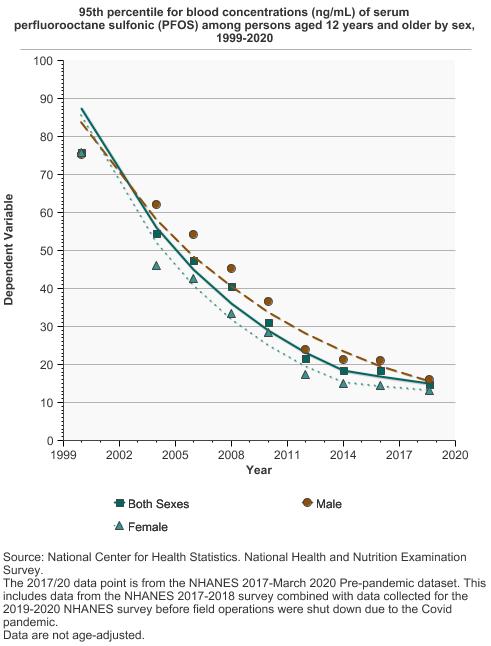
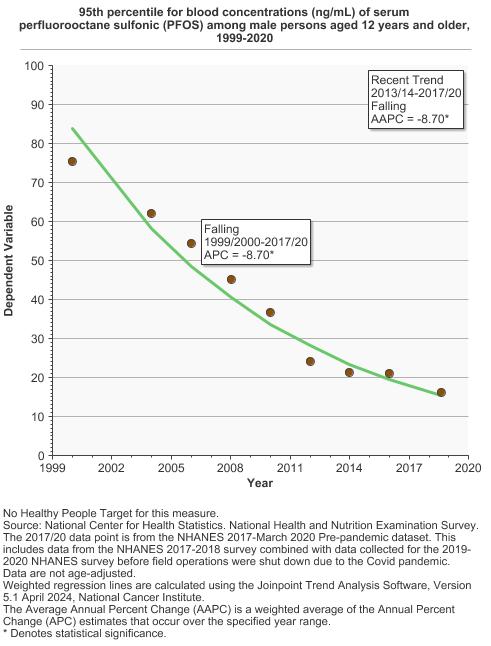
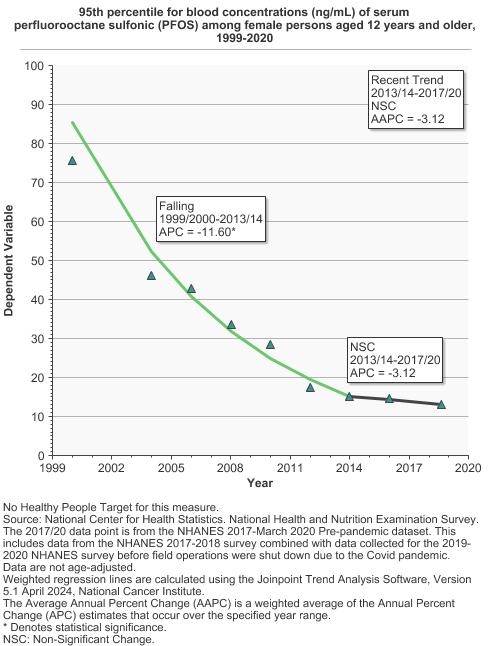
95th percentile for blood concentrations (ng/mL) of serum perfluorooctane sulfonic (PFOS) among persons aged 12 years and older by sex, 1999-2020 Overview Graph Detailed Trend Graphs Most Recent Estimates (2017 to 2020) Dependent Variable 95% Confidence Interval 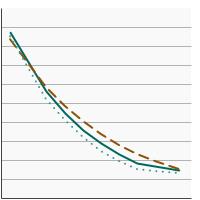
Both Sexes 14.8 13.4 - 16.3 Male 16.1 13.9 - 18.4 Female 13.1 10.6 - 15.5 The 2017 to 2020 data point is from the NHANES 2017-March 2020 Pre-pandemic dataset. This includes data from the NHANES 2017-2018 survey combined with data collected for the 2019-2020 NHANES survey before field operations were shut down due to the Covid pandemic. - By Race/Ethnicity
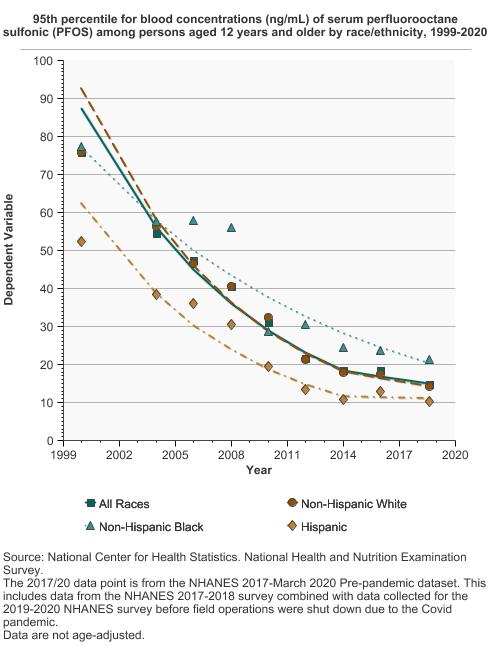
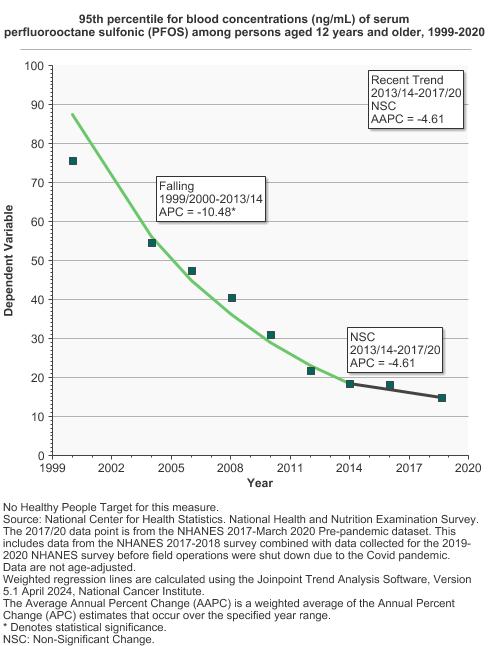
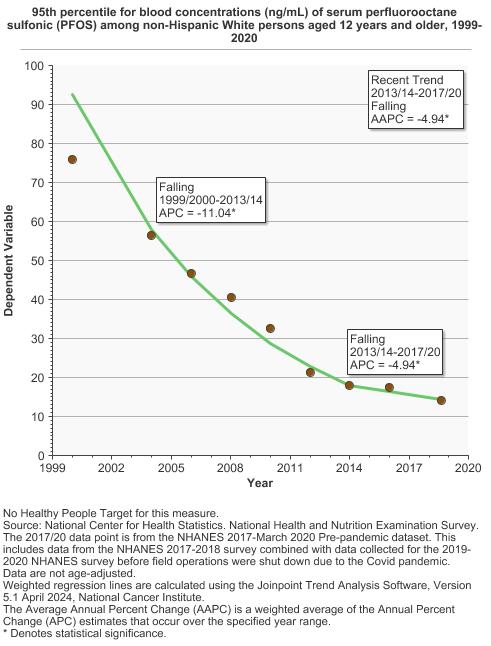
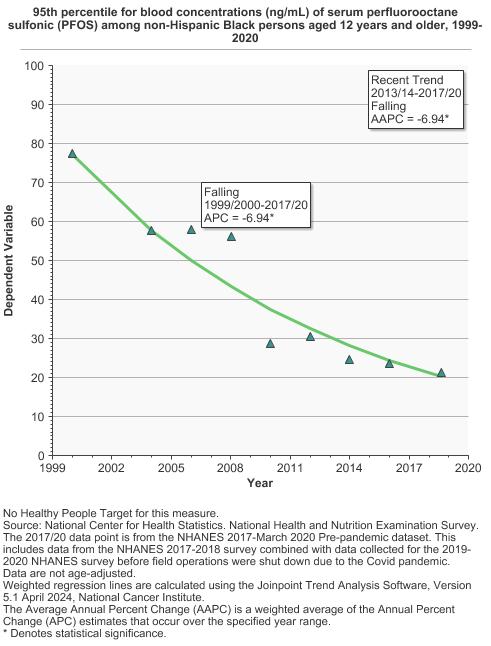
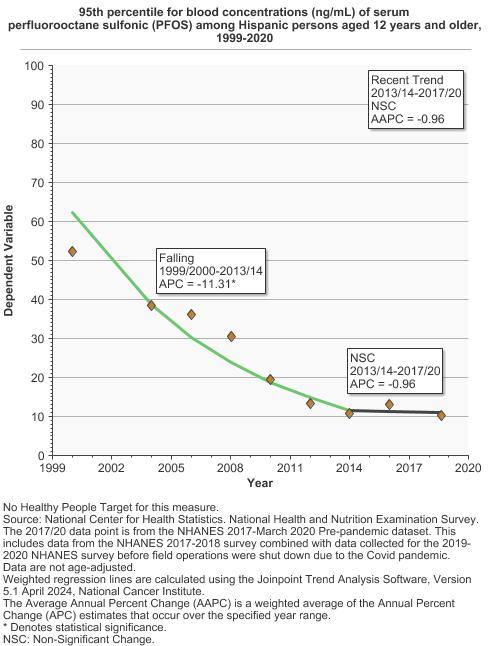
95th percentile for blood concentrations (ng/mL) of serum perfluorooctane sulfonic (PFOS) among persons aged 12 years and older by race/ethnicity, 1999-2020 Overview Graph Detailed Trend Graphs Most Recent Estimates (2017 to 2020) Dependent Variable 95% Confidence Interval 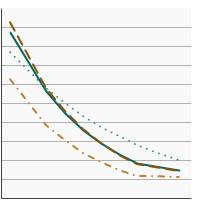
All Races 14.8 13.4 - 16.3 Non-Hispanic White 14.2 13.1 - 15.8 Non-Hispanic Black 21.3 17.5 - 24.0 Hispanic 10.3 8.4 - 12.8 The 2017 to 2020 data point is from the NHANES 2017-March 2020 Pre-pandemic dataset. This includes data from the NHANES 2017-2018 survey combined with data collected for the 2019-2020 NHANES survey before field operations were shut down due to the Covid pandemic. - By Poverty Income Level
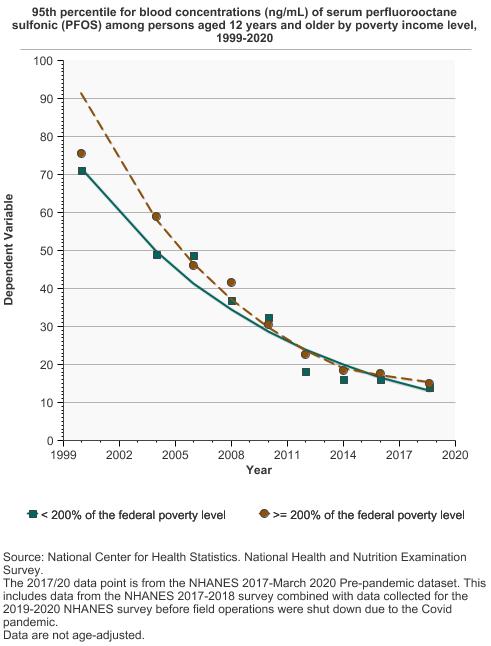
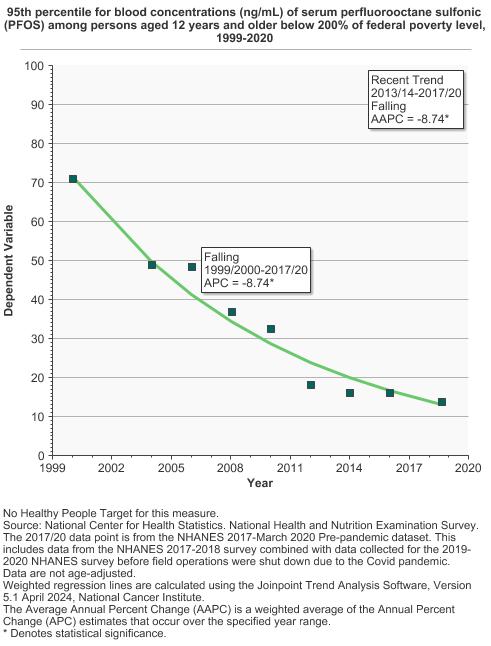
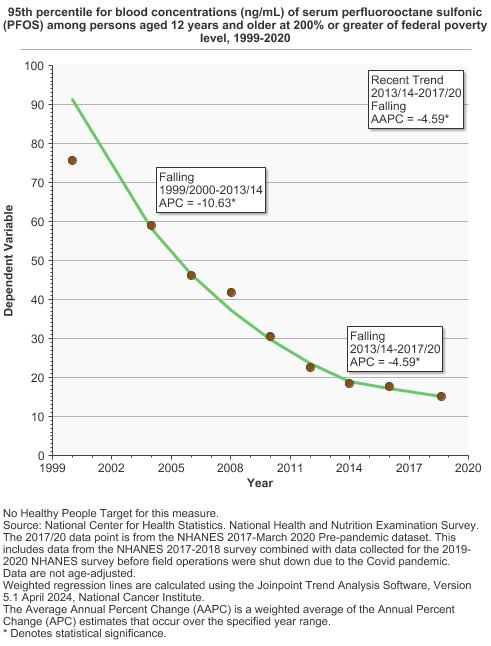
95th percentile for blood concentrations (ng/mL) of serum perfluorooctane sulfonic (PFOS) among persons aged 12 years and older by poverty income level, 1999-2020 Overview Graph Detailed Trend Graphs Most Recent Estimates (2017 to 2020) Dependent Variable 95% Confidence Interval 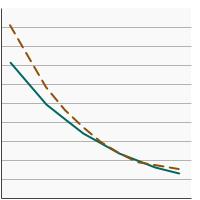
< 200% of the federal poverty level 14.0 12.7 - 15.8 >= 200% of the federal poverty level 15.0 13.4 - 17.0 The 2017 to 2020 data point is from the NHANES 2017-March 2020 Pre-pandemic dataset. This includes data from the NHANES 2017-2018 survey combined with data collected for the 2019-2020 NHANES survey before field operations were shut down due to the Covid pandemic. - By Education Level
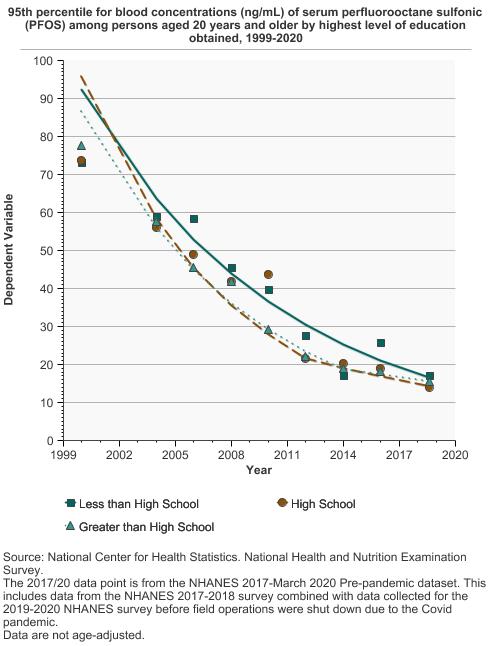
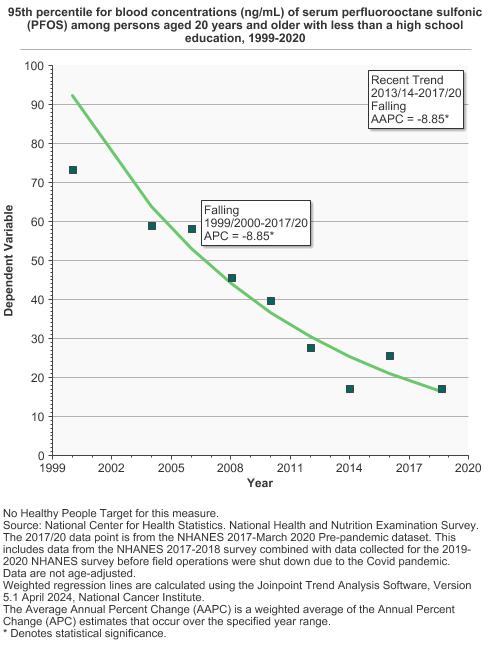
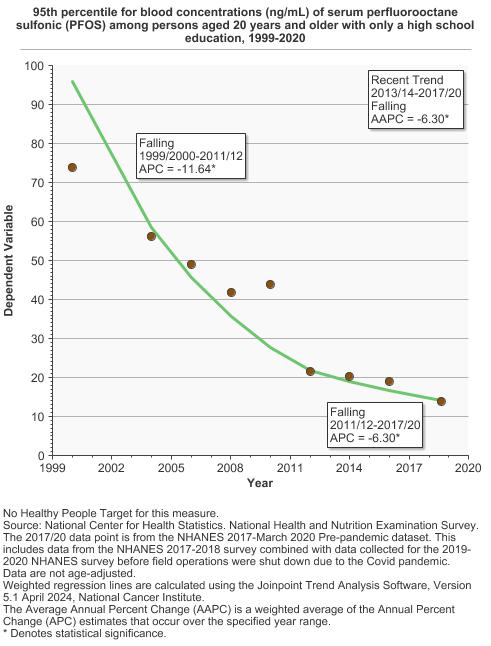
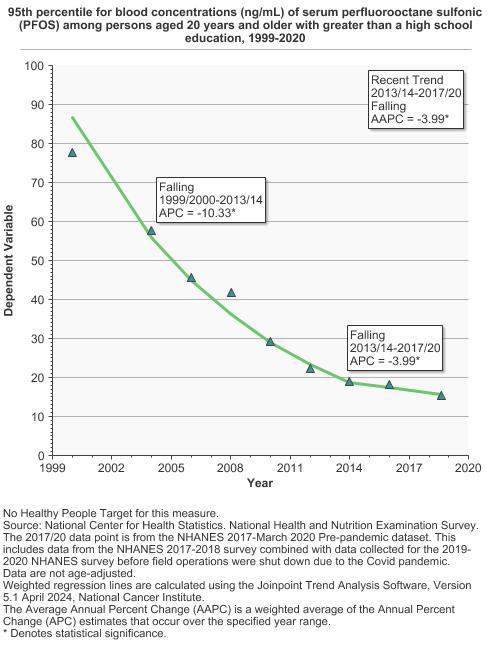
95th percentile for blood concentrations (ng/mL) of serum perfluorooctane sulfonic (PFOS) among persons aged 20 years and older by highest level of education obtained, 1999-2020 Overview Graph Detailed Trend Graphs Most Recent Estimates (2017 to 2020) Dependent Variable 95% Confidence Interval 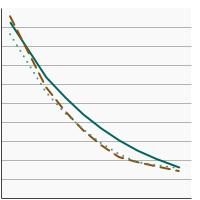
Less than High School 17.2 14.4 - 23.2 High School 13.9 12.3 - 17.2 Greater than High School 15.5 13.9 - 17.0 The 2017 to 2020 data point is from the NHANES 2017-March 2020 Pre-pandemic dataset. This includes data from the NHANES 2017-2018 survey combined with data collected for the 2019-2020 NHANES survey before field operations were shut down due to the Covid pandemic.

Additional Information
- National Report on Human Exposure to Environmental Chemicals: Biomonitoring Data Tables for Environmental Chemicals. Centers for Disease Control and Prevention.
- PFAS Exposure and Risk of Cancer. National Cancer Institute.
- Perfluoroalkyl and Polyfluoroalkyl Substances (PFAS). National Institute of Environmental Health Sciences.
- Per- and Polyfluoroalkyl Substances (PFAS). United States Food and Drug Administration.
- How PFAS Impacts Your Health. Agency for Toxic Substances and Disease Registry.
- Minimal Risk Levels (MRLs) for Hazardous Substances. Agency for Toxic Substances and Disease Registry.
- Chronic dietary toxicity and carcinogenicity study with potassium perfluorooctanesulfonate in Sprague Dawley rats. Butenhoff JL, Chang SC, Olsen GW, Thomford PJ. Toxicology 2012 Mar 11;293(1-3):1-15.
- National Toxicology Program. NTP technical report on the toxicology and carcinogenesis studies of perfluorooctanoic acid (CASRN 335-67-1) administered in feed to Sprague Dawley (Hsd:Sprague Dawley® SD®) rats (revised). Research Triangle Park (NC): National Toxicology Program, 2023.
- A nested case-control study of serum per- and polyfluoroalkyl substances and testicular germ cell tumors among U.S. Air Force servicemen. Purdue MP, Rhee J, Denic-Roberts H, McGlynn KA, Byrne C, Sampson J, Botelho JC, Calafat AM, Rusiecki J. Environmental Health Perspectives 2023; 131: 77007.
- Serum concentrations of per- and polyfluoroalkyl substances and risk of renal cell carcinoma. Shearer JJ, Callahan CL, Calafat AM, Huang WY, Jones RR, Sabbisetti VS, Freedman ND, Sampson JN, Silverman DT, Purdue MP, Hofmann JN. Journal of the National Cancer Institute 2021; 113: 580–87.