On This Page:
- Background
- Measure
- Healthy People 2030 Target
- Data Source
- Trends and Most Recent Estimates
- Related Cancers
- Additional Information

Background
Measure
The percentage of high school students (grades 9-12) who reported having been sunburned in the past 12 months.
The percentage of adults aged 18 years and older who reported having been sunburned in the past 12 months.
Data Source
Adolescents: Centers for Disease Control and Prevention, National Center for Chronic Disease Prevention and Health Promotion, Youth Risk Behavior Surveillance System (YRBSS), 2015-2017.
Adults: Centers for Disease Control and Prevention, National Center for Health Statistics. National Health Interview Survey NCI and CDC co-sponsored Cancer Control Supplement, 2000-2010, 2010-2020.
Refer to the Data Sources page for more information about data collection years 2019+.
Healthy People 2030 Target
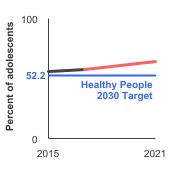
- Reduce to 52.2 percent the proportion of adolescents in grades 9 through 12 who report sunburn.
Healthy People 2030 is a set of goals set forth by the Department of Health and Human Services.
Note: Goals are indicated as blue line on Detailed Trend Graphs.
Trends and Most Recent Estimates
- Adolescents
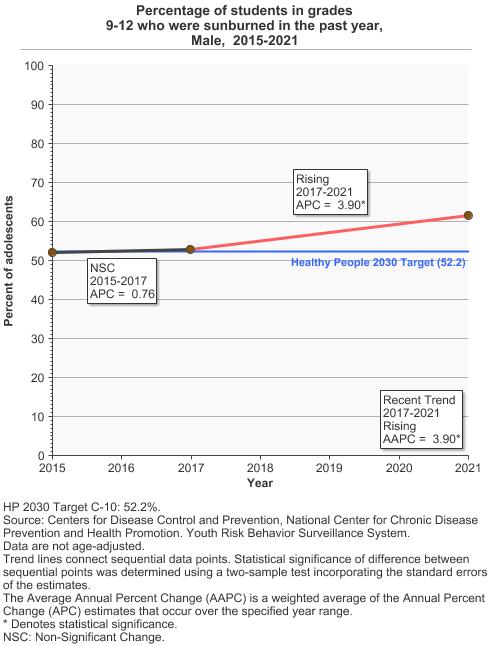
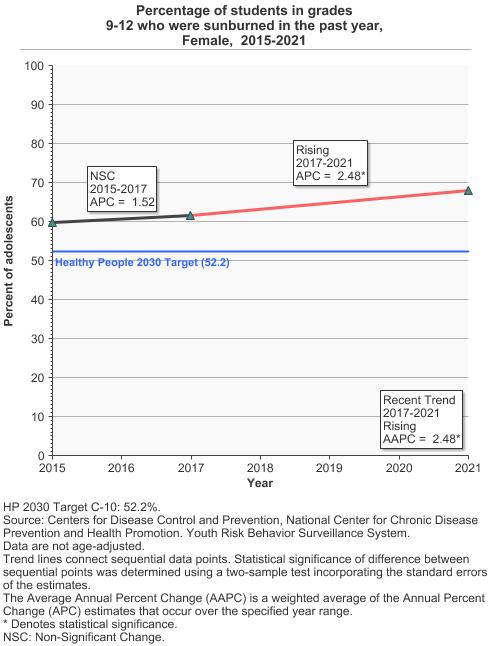
- By Sex
Percentage of students in grades 9-12 who were sunburned in the past year by sex, 2015-2021 Overview Graph Detailed Trend Graphs Most Recent Estimates (2021) Percent of adolescents 95% Confidence Interval 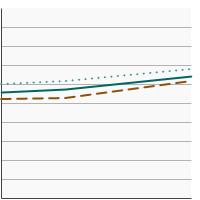

Both Sexes 
64.4 61.3 - 67.4 Male 61.5 58.6 - 64.3 Female 67.9 64.3 - 71.4 - By Race/Ethnicity
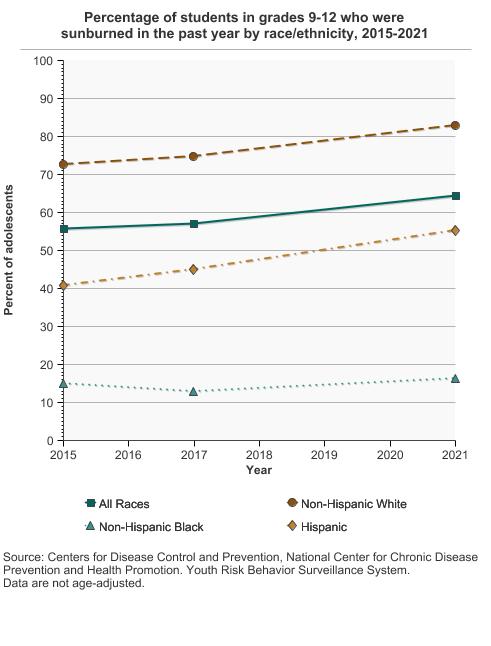
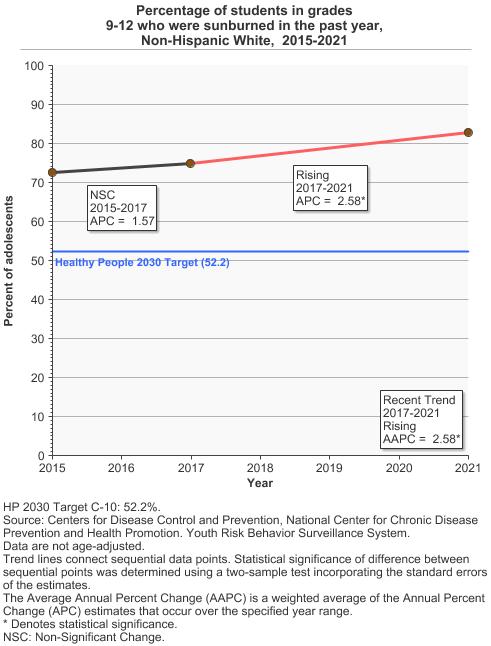
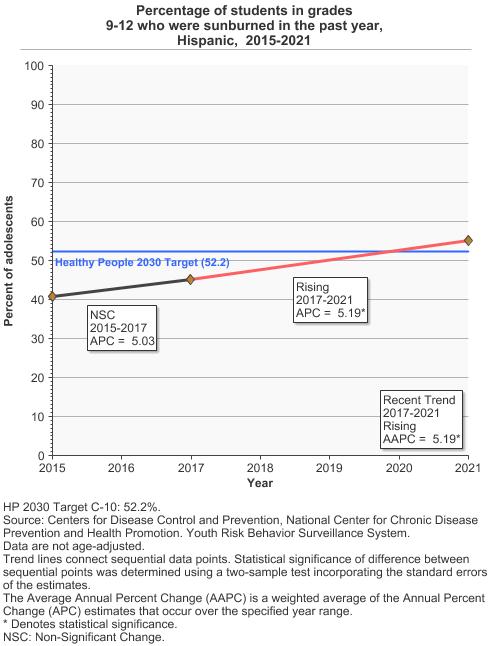
Percentage of students in grades 9-12 who were sunburned in the past year by race/ethnicity, 2015-2021 Overview Graph Detailed Trend Graphs Most Recent Estimates (2021) Percent of adolescents 95% Confidence Interval 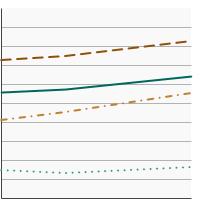
All Races 64.4 61.3 - 67.4 Non-Hispanic White 82.9 81.6 - 84.1 Non-Hispanic Black 16.3 14.0 - 18.9 Hispanic 55.2 52.1 - 58.1 - By High School Grade
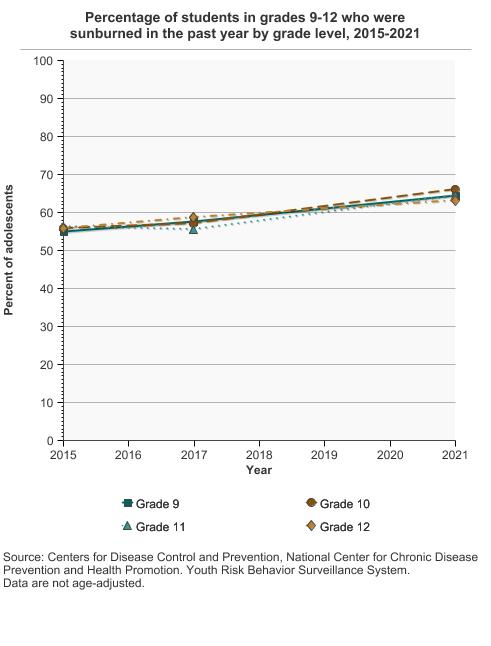
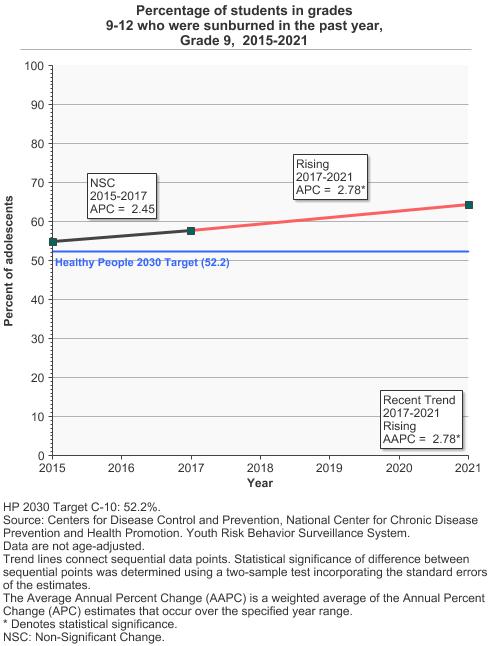
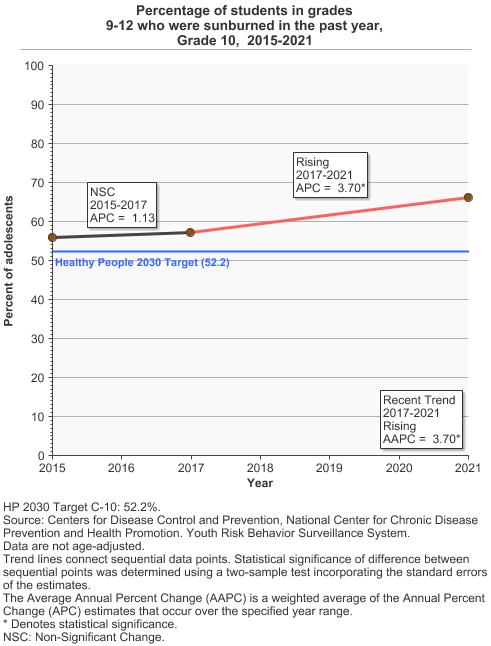
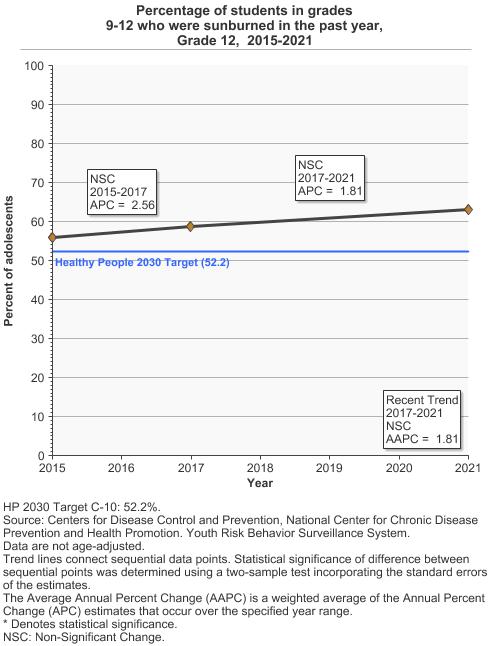
Percentage of students in grades 9-12 who were sunburned in the past year by grade level, 2015-2021 Overview Graph Detailed Trend Graphs Most Recent Estimates (2021) Percent of adolescents 95% Confidence Interval 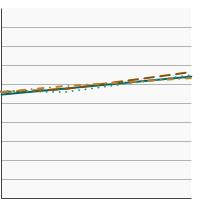
Grade 9 64.4 60.6 - 67.9 Grade 10 66.1 62.5 - 69.6 Grade 11 64.5 60.0 - 68.8 Grade 12 63.1 60.1 - 66.0
- Adults
- By Sex
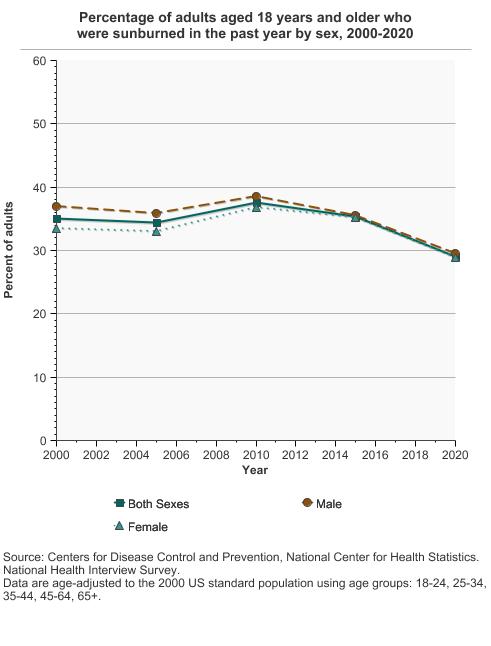
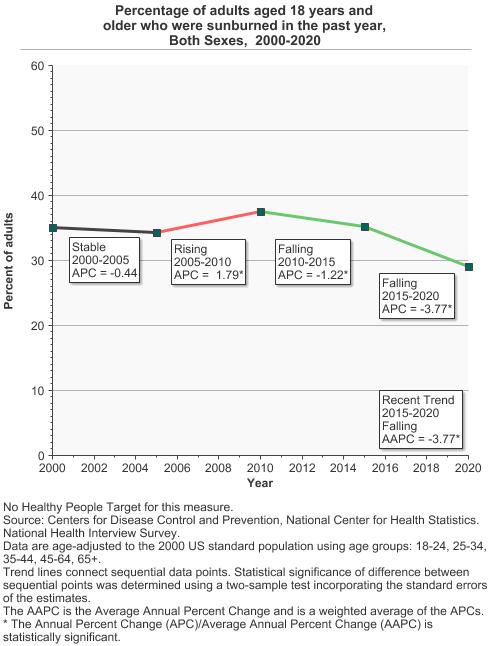
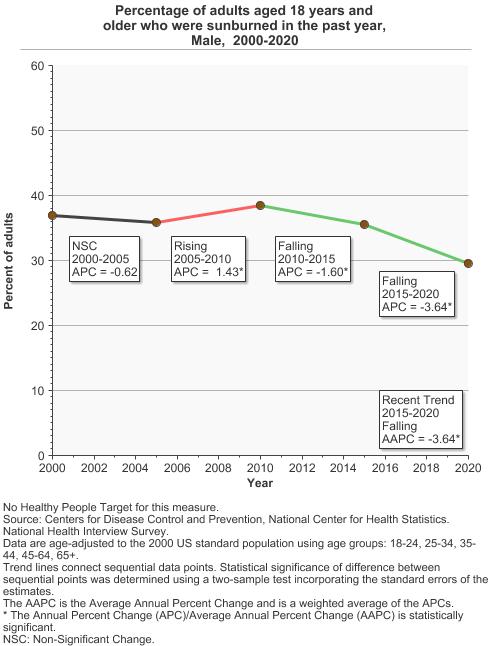
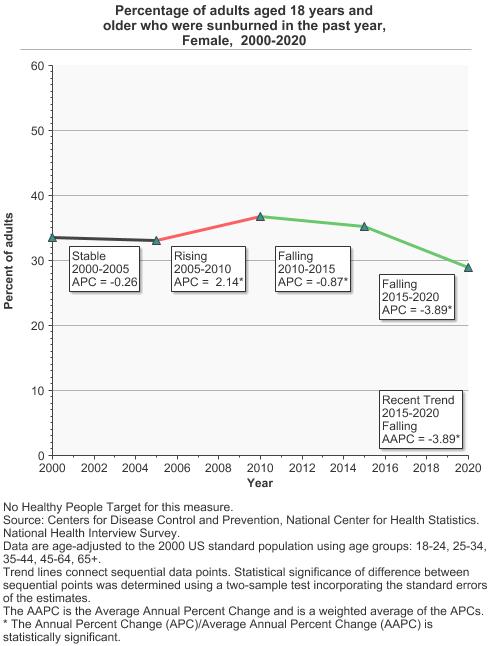
Percentage of adults aged 18 years and older who were sunburned in the past year by sex, 2000-2020 Overview Graph Detailed Trend Graphs Most Recent Estimates (2020) Percent of adults 95% Confidence Interval 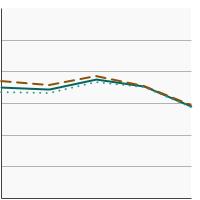
Both Sexes 29.1 28.2 - 30.1 Male 29.5 28.3 - 30.6 Female 28.9 27.7 - 30.0 - By Race/Ethnicity
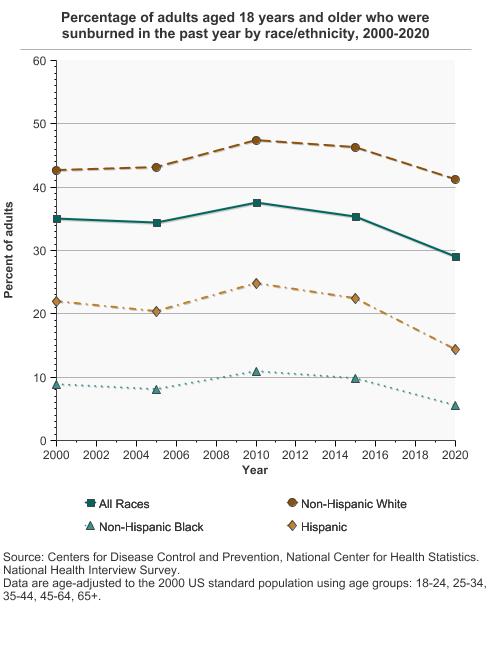
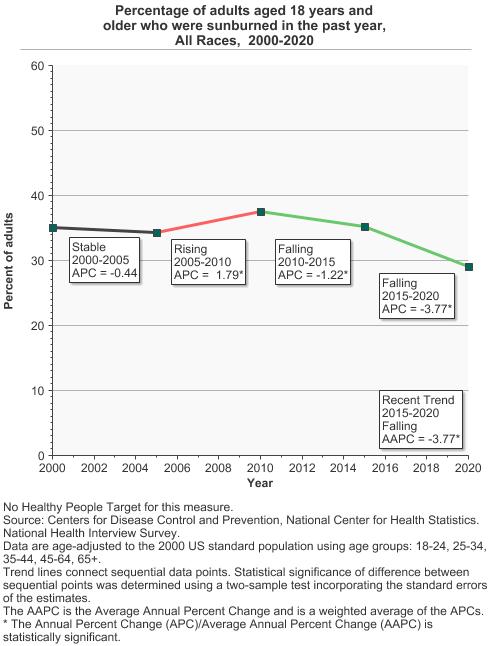
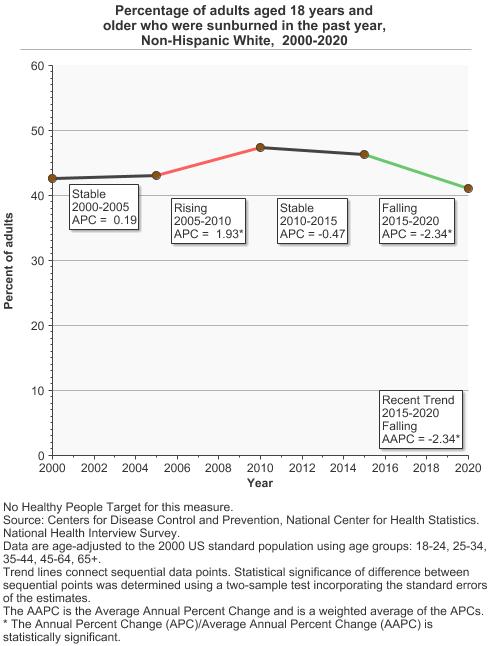
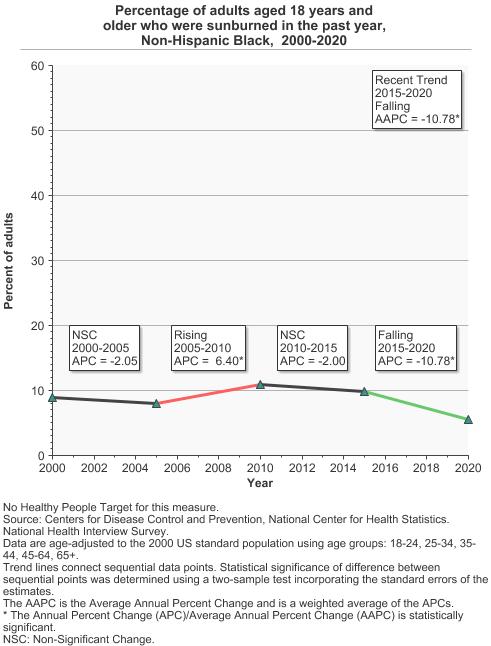
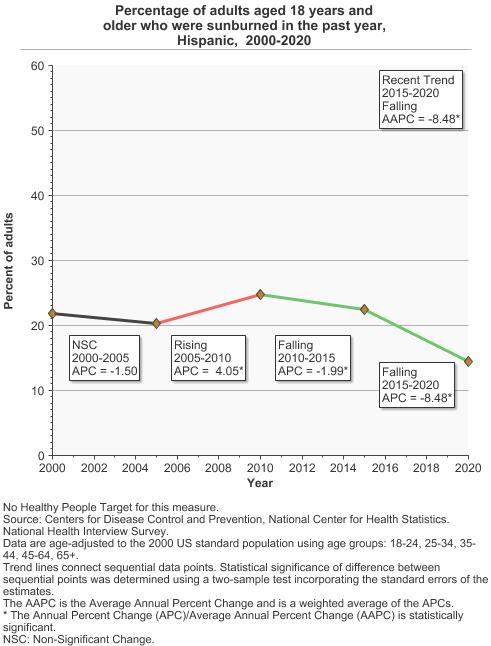
Percentage of adults aged 18 years and older who were sunburned in the past year by race/ethnicity, 2000-2020 Overview Graph Detailed Trend Graphs Most Recent Estimates (2020) Percent of adults 95% Confidence Interval 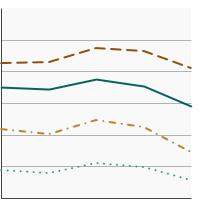
All Races 29.1 28.2 - 30.1 Non-Hispanic White 41.1 40.1 - 42.2 Non-Hispanic Black 5.6 4.6 - 6.7 Hispanic 14.4 12.9 - 16.0 - By Age
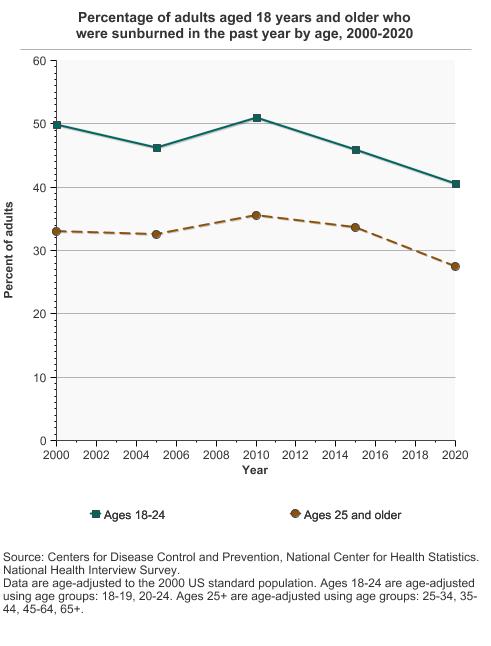
Percentage of adults aged 18 years and older who were sunburned in the past year by age, 2000-2020 Overview Graph Detailed Trend Graphs Most Recent Estimates (2020) Percent of adults 95% Confidence Interval 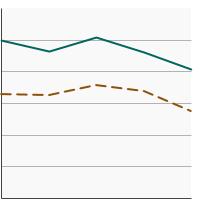
Ages 18-24 40.6 37.7 - 43.6 Ages 25 and older 27.4 26.5 - 28.3 - By Sex and Age
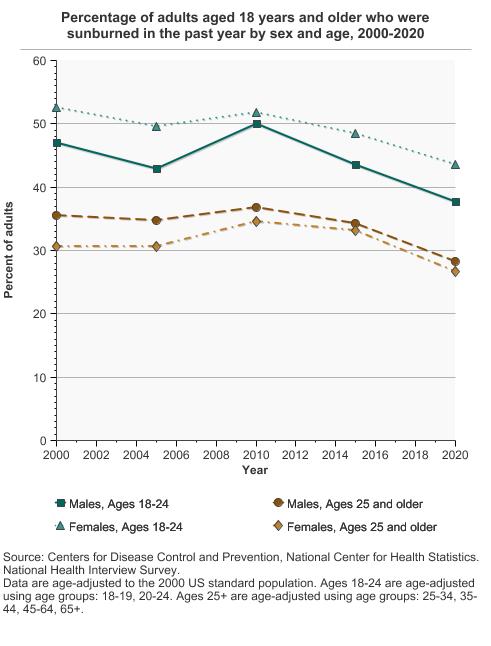
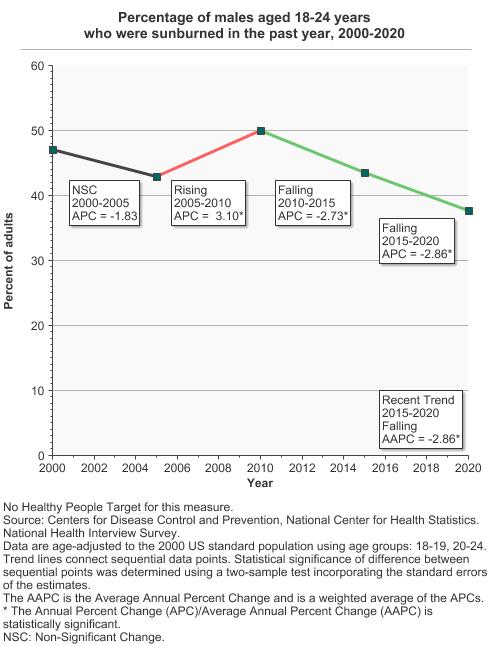
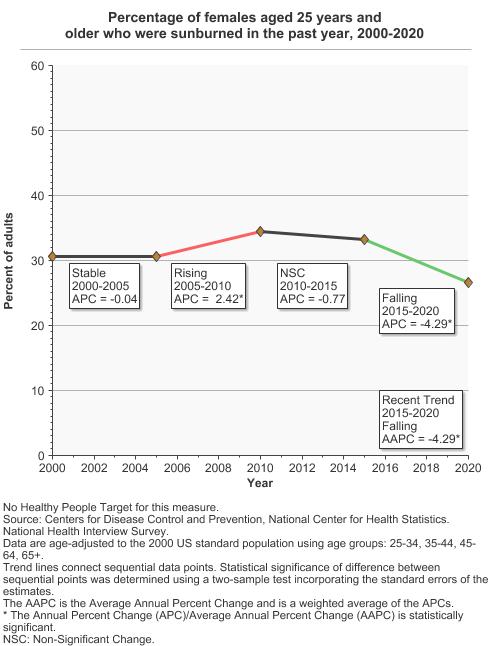
Percentage of adults aged 18 years and older who were sunburned in the past year by sex and age, 2000-2020 Overview Graph Detailed Trend Graphs Most Recent Estimates (2020) Percent of adults 95% Confidence Interval 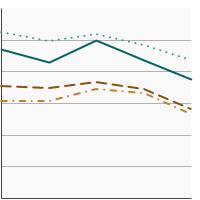
Males, Ages 18-24 37.7 33.8 - 41.7 Males, Ages 25 and older 28.2 27.1 - 29.4 Females, Ages 18-24 43.6 39.4 - 47.8 Females, Ages 25 and older 26.7 25.6 - 27.8 - By Poverty Income Level
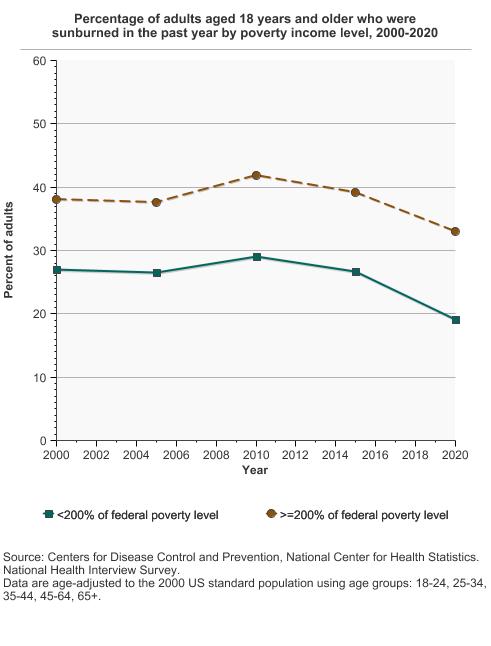
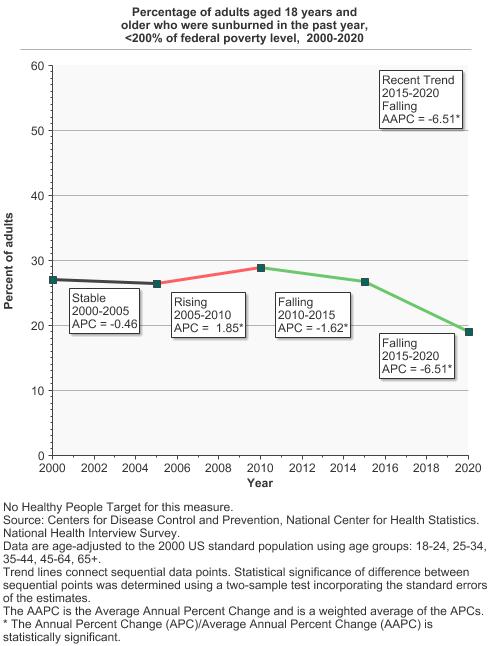
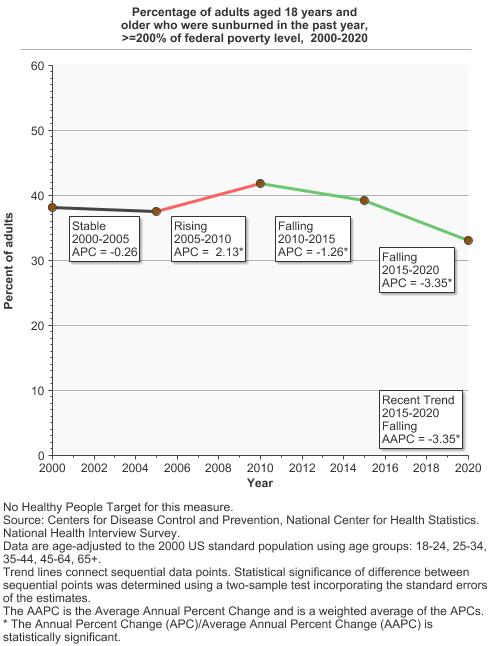
Percentage of adults aged 18 years and older who were sunburned in the past year by poverty income level, 2000-2020 Overview Graph Detailed Trend Graphs Most Recent Estimates (2020) Percent of adults 95% Confidence Interval 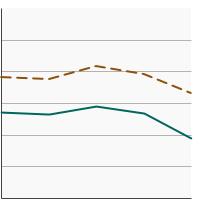
<200% of federal poverty level 19.1 17.8 - 20.5 >=200% of federal poverty level 33.1 32.1 - 34.1 - By Education Level
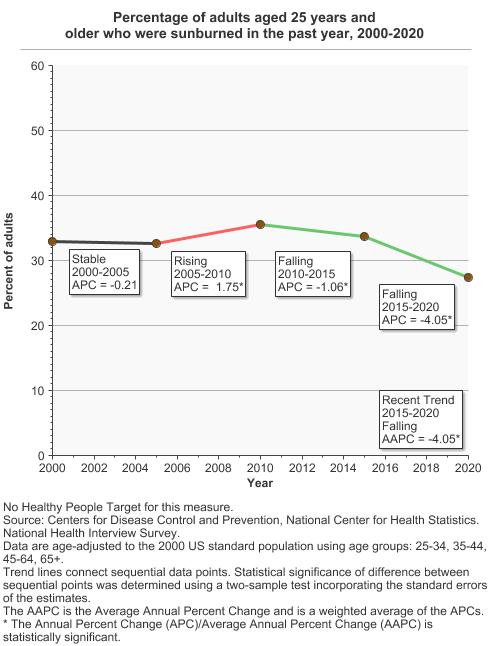
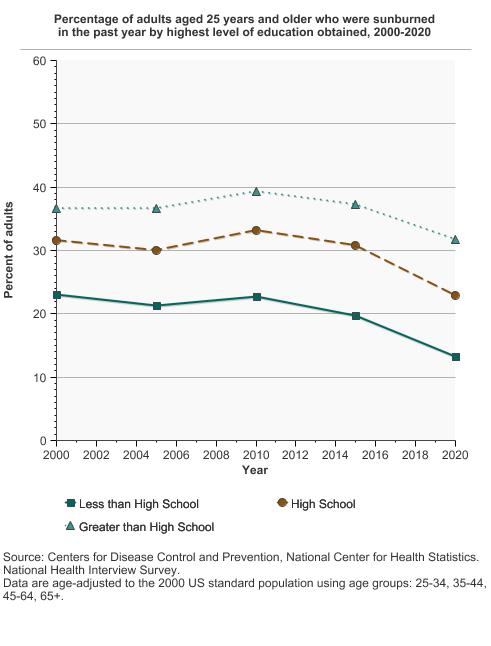
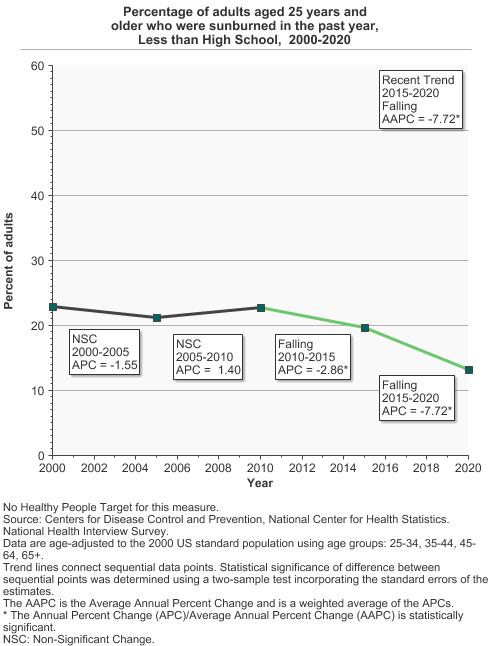
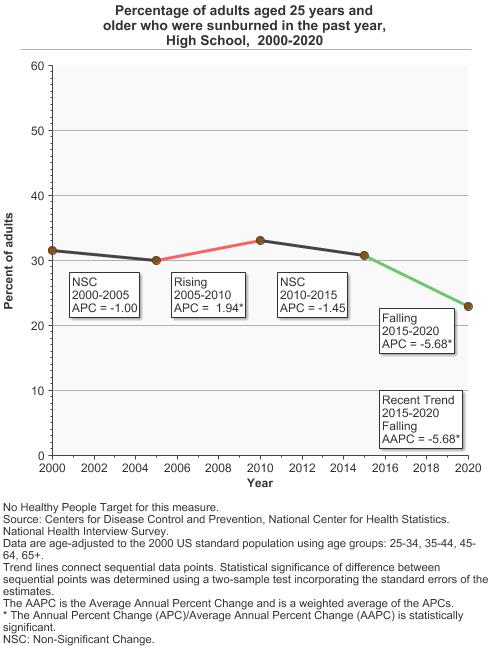
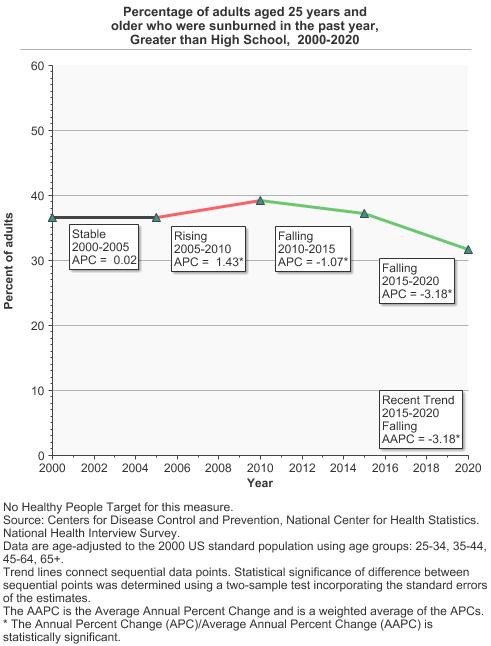
Percentage of adults aged 25 years and older who were sunburned in the past year by highest level of education obtained, 2000-2020 Overview Graph Detailed Trend Graphs Most Recent Estimates (2020) Percent of adults 95% Confidence Interval 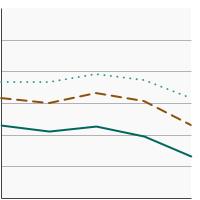
Less than High School 13.2 11.1 - 15.6 High School 23.0 21.4 - 24.7 Greater than High School 31.7 30.7 - 32.7 - By Sun Sensitivity
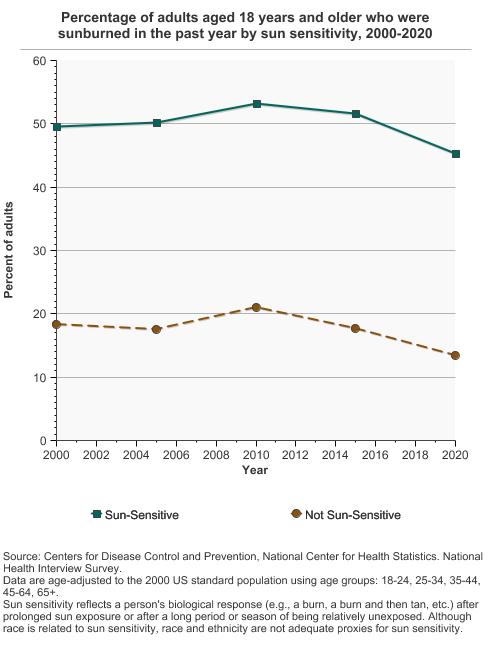
Percentage of adults aged 18 years and older who were sunburned in the past year by sun sensitivity, 2000-2020 Overview Graph Detailed Trend Graphs Most Recent Estimates (2020) Percent of adults 95% Confidence Interval 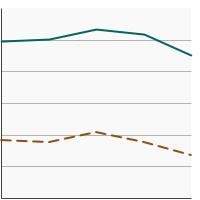
Sun-Sensitive 45.3 44.1 - 46.4 Not Sun-Sensitive 13.5 12.6 - 14.4 Sun sensitivity reflects a person's biological response (e.g., a burn, a burn and then tan, etc.) after prolonged sun exposure or after a long period or season of being relatively unexposed. Although race is related to sun sensitivity, race and ethnicity are not adequate proxies for sun sensitivity.


Additional Information
- Skin Cancer. National Cancer Institute.
- Skin Cancer. American Cancer Society.
- Skin Cancer. Centers for Disease Control and Prevention.
- Skin Cancer. National Council on Skin Cancer Prevention.
- Sun Safety. U.S. Environmental Protection Agency.
- Radiation-Emitting Products: Sunlamps and Sunlamp Products (Tanning Beds/Booths). U.S. Food and Drug Administration.
- Sun protection factor (SPF). U.S. Food and Drug Administration.
- Sunscreen: How to Help Protect Your Skin from the Sun. U.S. Food and Drug Administration.
- Melanoma Treatment (PDQ®)—Health Professional Version. National Cancer Institute.
- Skin Cancer Treatment (PDQ®)—Health Professional Version. National Cancer Institute.
- Sun Safety Evidence-Based Programs Listing. National Cancer Institute.
- Vitamin D and Calcium: A Systematic Review of Health Outcomes (Update). AHRQ Publication No. 14-E004-EF September 2014. Evidence Report/Technology Assessment Number 217.
- Counseling on Sun Protection and Indoor Tanning. Balk SJ, Gottschlich EA, Holman DM, Watson M. Pediatrics. 2017;140(6): e20171680.
- Surgeon General's Call to Action to Prevent Skin Cancer. Centers for Disease Control and Prevention.
- Skin cancer: multicomponent community-wide interventions. Community Preventive Services Task Force.
- Indoor Tanning Association settles FTC charge that it deceived customers about skin cancer risks from tanning. Federal Trade Commission.
- Dietary Reference Intakes for Calcium and Vitamin D (2010). Institute of Medicine.
- Stratosphere: UV index. National Weather Service: Climate Prediction Center.
- Code of Federal Regulations Title 21, Volume 76, Number 117, Part 352: Sunscreen Drug Products for Over-the-Counter Human Use (April 2019). U.S. Food and Drug Administration.
- Code of Federal Regulations Title 21, Volume 76, Number 117, Part 201: Labeling (July 2018). U.S. Food and Drug Administration.
- Skin Cancer Prevention: Behavioral counseling. U.S. Preventive Services Task Force.
- Sunlamp products and ultraviolet lamps intended for use in sunlamp products. U.S. Food and Drug Administration. Title 21. Food and drugs. CFR 1040.20. Fed Regist.April 2019.
- Effect of vitamin D supplementation on non-skeletal disorders: a systematic review of meta-analyses and randomized trials. Autier P, Mullie P, Macacu A et al. Lancet Diabetes Endocrinol. 2017;5(12):986-1004.
- Counseling on Sun Protection and Indoor Tanning. Balk SJ, Gottschlich EA, Holman DM, Watson M. Pediatrics. 2017;140(6): e20171680.
- Is the sun setting on vitamin D? Chou SH, LeBoff MS, Manson JE. Clin Chem 2020 May 1; 66(5):635-637.
- Interdisciplinary Perspectives on Sun Safety. Geller AC, Jablonski NG, Pagoto SL et al. JAMA Detmatol. 2018:154(1):88-92.
- Reduced melanoma after regular sunscreen use: randomized trial follow-up. Green A, Williams GM, Logan V, and Strutton GM. J Clin Oncol. 2011;29(3):257–263.
- Estimated cost of sunburn-associated visits to US hospital emergency departments. Guy GP, Berkowitz Z, and Watson M. JAMA Dermatol. 2017;153(1):90-92.
- Prevalence of indoor tanning and association with sunburn among youth in the United States. Guy GP, Berkowitz Z, Jones ES et al. JAMA Dermatol 2017;153(5):387-390.
- The Context of Sunburn Among U.S. Adults: Common Activities and Sun Protection Behaviors. Holman DM, Ragan KR, Julian AK, Perna FM. Am J Prev Med. 2021 Feb 12:S0749-3797(21)00064-7.
- Sunburn prevalence among US adults, National Health Interview Survey 2005, 2010, and 2015. Holman DM, Ding H, Berkowitz Z, Hartman AM, Perna FM. J Am Acad Dermatol. 2019 Mar;80(3):817-820. doi: 10.1016/j.jaad.2018.10.044.
- The Context of Sunburn Among U.S. Adults: Common Activities and Sun Protection Behaviors. Holman DM, Ragan KR, Julian AK, Perna FM. Am J Prev Med. 2021 May;60(5):e213-e220.
- Prevalence of sun protection use and sunburn and association of demographic and behavioral characteristics with sunburn among US adults. Holman DM, Ding H, Guy GP et al. JAMA Dermatol. 2018; 154(5):561-568.
- Radiation. International Agency for Research on Cancer. IARC Monographs on the Evaluation of Carcinogenic Risks to Humans 2012;100D:36–102.
- Sun safety practices among schools in the United States. Jones SE, Guy GP. JAMA Dermatol. 2017;153(5):391-397
- Benefit–Cost Analysis of the Danish Sun Safety Campaign 2007–2015: Cost Savings from Sunburn and Sunbed Use Reduction and Derived Skin Cancer Reductions 2007–2040 in the Danish Population. Køster B, Meyer MKH, Søgaard J, Dalum P. Pharmacoecon Open. 2020 Sep;4(3):419-425.
- Decision tree model v traditional measures to identify patterns of sun-protective behaviors and sun sensitivity associated with sunburn. Morris KL and Perna FM. JAMA Dermatol. 2018;154(8):897-902.
- Environmental effects of stratospheric ozone depletion, UV radiation, and interactions with climate change: UNEP Environmental Effects Assessment Panel, Update 2020. Neale RE, Barnes PW, Robson TM, et al. Photochem Photobiol Sci. 2021 Jan;20(1):1-67.
- The effect of sunscreen on vitamin D: a review. Neale RE, Khan SR, Lucas RM, et al. Br J Dermatol. 2019 Nov;181(5):907-915.
- Age-Specific Incidence of Melanoma in the United States. Paulson KG, Gupta D, Kim TS, et al. JAMA Dermatol. 2019. doi: 10.1001/jamadermatol.2019.3353. [Epub ahead of print]
- Research on Skin Cancer-Related Behaviors and Outcomes in the NIH Grant Portfolio, 2000-2014: Skin Cancer Intervention Across the Cancer Control Continuum (SCI-3C). Perna FM, Dwyer LA, Tesauro G et al. JAMA Dermatol. 2017;153(5): 398-405
- Community-wide interventions to prevent skin cancer: two community guide systematic reviews. Reed KB, Brewer JD, Lohse CM, et al. Mayo Clin Proc. 2012;87(4):328–334.
- Implementation of the SunSmart program and population sun protection behaviour in Melbourne, Australia: Results from cross-sectional summer surveys from 1987 to 2017. Tabbakh T, Volkov A, Wakefield M, Dobbinson S. PLoS Med. 2019;16(10):e1002932.
- Associations between ultraviolet radiation, tree cover and adolescent sunburns. Tribby CP, Julian AK, Oh AY, Perna FM, Berrigan D. Int J Health Geogr. 2020 Dec 14;19(1):59.
- SEER Cancer Statistics Review. National Cancer Institute.
- Cancer Statistics Center, 2021 Estimates. American Cancer Society.
- National Health Interview Survey. Centers for Disease Control and Prevention, National Center for Health Statistics.