On This Page:
- Background
- Measure
- Healthy People 2030 Target
- Data Source
- Trends and Most Recent Estimates
- Related Cancers
- Additional Information
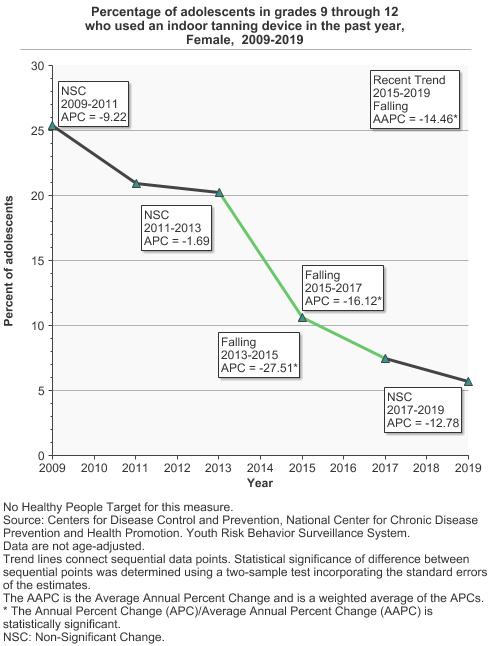
In 2019, 5.7% of female adolescents used an indoor tanning device within the past year.
Background
Guy et al. 2017 estimated that restricting indoor tanning among minors under 18 years old may prevent melanoma incidence and mortality and save millions of dollars in treatment costs in the United States. Subsequent international modeling studies accounting for more stringent indoor policies in the US, Canada, and Europe since 2018 estimate reduced skin cancer burden and reduced health care costs if indoor tanning were banned among minors or banned completely.
Reports indicate that age restriction laws have been associated with less indoor tanning, and teens who do not tan before age 18 are two to four times less likely to tan as adults. Several states have adopted laws restricting youth access to tanning beds, and the FDA has proposed a nationwide restriction for minors’ (under 18 years) access to tanning beds. Bowers et al, 2020 reported that indoor tanning rates among adults over age 18 also decreased in states that banned indoor tanning among minors as compared to adults in states without tanning restrictions for minors.
While reduction of indoor tanning is estimated to significantly reduce melanoma, outdoor sun exposure is the primary modifiable melanoma risk factor and includes intentional outdoor tanning and unintentional sun exposure. Among US adolescents, outdoor tanning (15.6%) appears to be more prevalent than indoor tanning (3%). The 2020 National Health Interview Survey provides the most recent intentional outdoor tanning data for US adults. Overall, 33.7% of US adults reported intentional outdoor tanning in the last 12-months, and outdoor tanning was more common among women (38.7%) than men (28.7%) and among adults aged under 25 years (45.1%) than those aged 25 years and over (32%), and among sun-sensitive adults (39.9%) than adults who are not sun-sensitive (29.2%). Considering the context of sunburn, other data indicate, leisure pursuits near water, physical activity, and work around the home as the most frequent contexts of sunburn in addition to intentional outdoor tanning.
Measure
The percentage of high school students (grades 9-12) who reported use of an indoor tanning device such as a sunlamp, sunbed, or tanning booth (not counting receipt of a spray-on tan) one or more times during the 12 months before the survey.
The percentage of adults aged 18 years and older who have used an indoor tanning device one or more times during the past 12 months. Although NHIS-CCS also collected this data for adults in 2005 and 2008, the methodology used likely resulted in overestimates, and these data are not included in the report.
The percentage of adults aged 18 years and older who reported spending time outdoors for the purpose of developing a tan (i.e., always, most times, sometimes, or rarely) during the past 12 months
Note: 2020 data point included above; graph will be included when more data points become available.
Data Source
Adolescents: Centers for Disease Control and Prevention, National Center for Chronic Disease Prevention and Health Promotion, Youth Risk Behavior Surveillance System (YRBSS), 2009–2019.
Adults: Centers for Disease Control and Prevention, National Center for Health Statistics. National Health Interview Survey NCI and CDC co-sponsored Cancer Control Supplement, 2010-2015. Outdoor tanning only available for 2020.
Refer to the Data Sources page for more information about data collection years 2019+.
Healthy People 2030 Target
There are no Healthy People 2030 targets regarding indoor or outdoor tanning.
Healthy People 2030 is a set of goals set forth by the Department of Health and Human Services.
Trends and Most Recent Estimates
- Adolescents
- By Sex
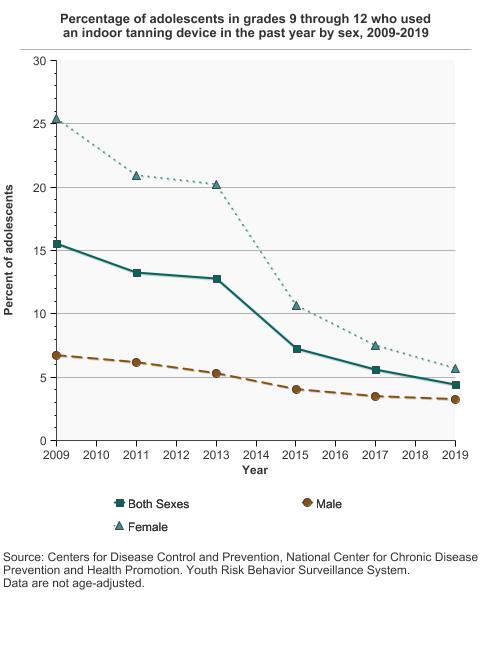
Percentage of adolescents in grades 9 through 12 who used an indoor tanning device in the past year by sex, 2009-2019 Overview Graph Detailed Trend Graphs Most Recent Estimates (2019) Percent of adolescents 95% Confidence Interval 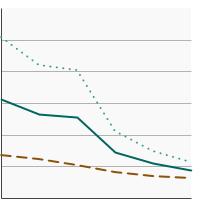

Both Sexes 
4.5 3.5 - 5.6 Male 3.2 2.5 - 4.1 Female 5.7 4.2 - 7.7 - By Race/Ethnicity
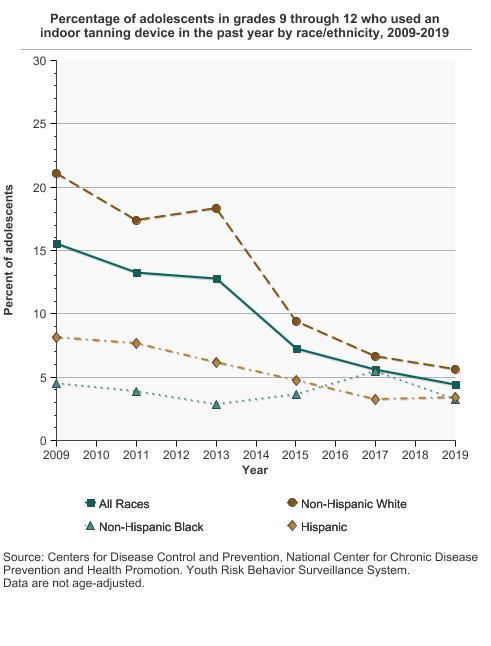
Percentage of adolescents in grades 9 through 12 who used an indoor tanning device in the past year by race/ethnicity, 2009-2019 Overview Graph Detailed Trend Graphs Most Recent Estimates (2019) Percent of adolescents 95% Confidence Interval 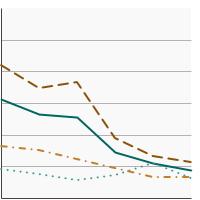
All Races 4.5 3.5 - 5.6 Non-Hispanic White 5.6 4.2 - 7.4 Non-Hispanic Black 3.2 2.2 - 4.7 Hispanic 3.4 2.5 - 4.5 - Females by Race/Ethnicity
Percentage of female adolescents in grades 9 through 12 who used an indoor tanning device in the past year by race/ethnicity, 2009-2019 Overview Graph Detailed Trend Graphs Most Recent Estimates (2019) Percent of female adolescents 95% Confidence Interval 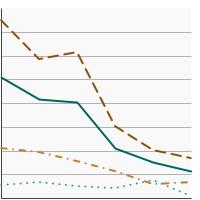
All Races 5.7 4.2 - 7.7 Non-Hispanic White 8.4 6.0 - 11.7 Non-Hispanic Black 0.5 0.3 - 0.9 Hispanic 3.3 2.5 - 4.4 - By High School Grade
Percentage of adolescents in grades 9 through 12 who used an indoor tanning device in the past year by grade level, 2009-2019 Overview Graph Detailed Trend Graphs Most Recent Estimates (2019) Percent of adolescents 95% Confidence Interval 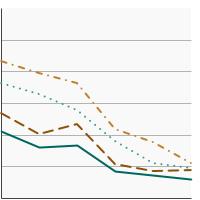
Grade 9 3.0 2.1 - 4.3 Grade 10 4.4 3.2 - 6.1 Grade 11 4.7 3.2 - 7.0 Grade 12 5.5 4.0 - 7.4 - Females by High School Grade
Percentage of female adolescents in grades 9 through 12 who used an indoor tanning device in the past year by grade level, 2009-2019 Overview Graph Detailed Trend Graphs Most Recent Estimates (2019) Percent of female adolescents 95% Confidence Interval 
Grade 9 3.7 2.4 - 5.6 Grade 10 5.5 3.7 - 8.1 Grade 11 5.6 3.5 - 9.0 Grade 12 7.5 5.0 - 11.3 - Non-Hispanic White Female by High School Grade
Percentage of Non-Hispanic White female adolescents in grades 9 through 12 who used an indoor tanning device in the past year by grade level, 2009-2019 Overview Graph Detailed Trend Graphs Most Recent Estimates (2019) Percent of female Non-Hispanic White adolescents 95% Confidence Interval 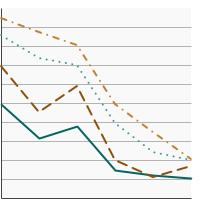
Grade 9 5.3 3.3 - 8.4 Grade 10 8.5 5.7 - 12.6 Grade 11 9.9 6.1 - 15.8 Grade 12 10.1 6.2 - 16.2
- Adults
- By Sex
Percentage of adults aged 18 years and older who used an indoor tanning device in the past year by sex, 2010-2015 Overview Graph Detailed Trend Graphs Most Recent Estimates (2015) Percent of adults 95% Confidence Interval 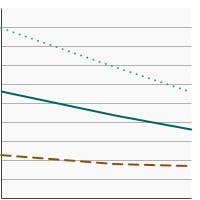
Both Sexes 3.6 3.3 - 4.0 Male 1.7 1.4 - 2.0 Female 5.6 5.1 - 6.2 - By Race/Ethnicity
Percentage of adults aged 18 years and older who used an indoor tanning device in the past year by race/ethnicity, 2010-2015 Overview Graph Detailed Trend Graphs Most Recent Estimates (2015) Percent of adults 95% Confidence Interval 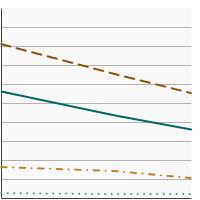
All Races 3.6 3.3 - 4.0 Non-Hispanic White 5.5 5.0 - 6.1 Non-Hispanic Black 0.2 0.1 - 0.4 Hispanic 1.0 0.8 - 1.4 - By Age
Percentage of adults aged 18 years and older who used an indoor tanning device in the past year by age, 2010-2015 Overview Graph Detailed Trend Graphs Most Recent Estimates (2015) Percent of adults 95% Confidence Interval 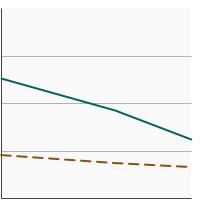
Ages 18-24 6.2 5.1 - 7.5 Ages 25 and older 3.3 2.9 - 3.6 - By Sex and Age
Percentage of adults aged 18 years and older who used an indoor tanning device in the past year by sex and age, 2010-2015 Overview Graph Detailed Trend Graphs Most Recent Estimates (2015) Percent of adults 95% Confidence Interval 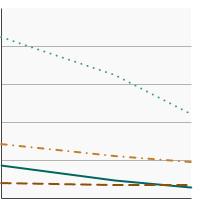
Males, Ages 18-24 1.5 0.9 - 2.5 Males, Ages 25 and older 1.7 1.4 - 2.0 Females, Ages 18-24 11.0 9.0 - 13.4 Females, Ages 25 and older 4.8 4.3 - 5.4 - By Poverty Income Level
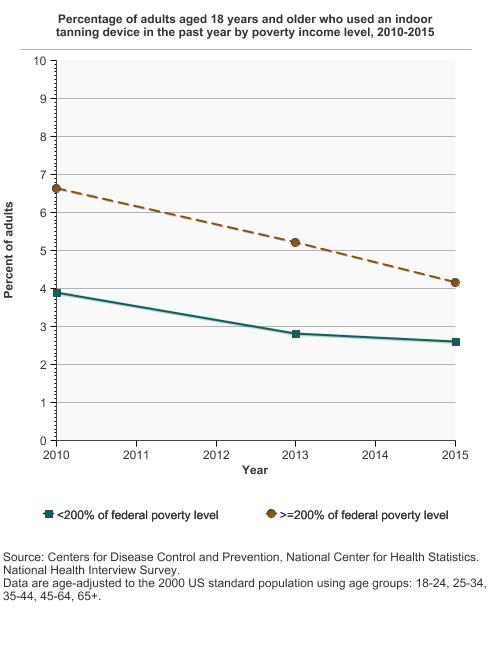
Percentage of adults aged 18 years and older who used an indoor tanning device in the past year by poverty income level, 2010-2015 Overview Graph Detailed Trend Graphs Most Recent Estimates (2015) Percent of adults 95% Confidence Interval 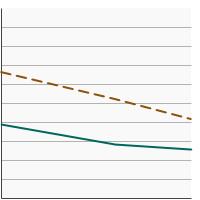
<200% of federal poverty level 2.6 2.2 - 3.0 >=200% of federal poverty level 4.2 3.7 - 4.6 - By Education Level
Percentage of adults aged 25 years and older who used an indoor tanning device in the past year by highest level of education obtained, 2010-2015 Overview Graph Detailed Trend Graphs Most Recent Estimates (2015) Percent of adults 95% Confidence Interval 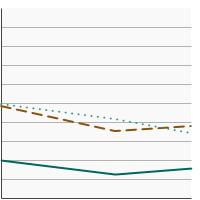
Less than High School 1.6 1.1 - 2.2 High School 3.8 3.1 - 4.6 Greater than High School 3.4 3.0 - 3.8 - By Sun Sensitivity
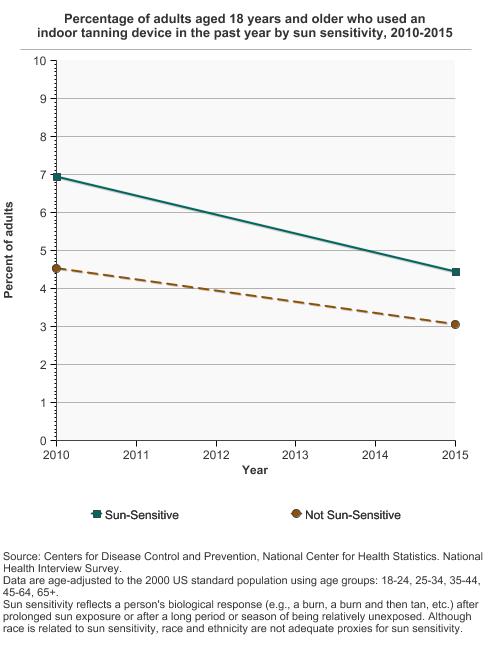
Percentage of adults aged 18 years and older who used an indoor tanning device in the past year by sun sensitivity, 2010-2015 Overview Graph Detailed Trend Graphs Most Recent Estimates (2015) Percent of adults 95% Confidence Interval 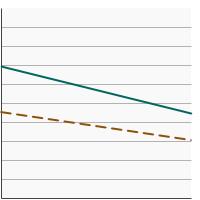
Sun-Sensitive 4.5 4.0 - 5.0 Not Sun-Sensitive 3.0 2.6 - 3.5 Sun sensitivity reflects a person's biological response (e.g., a burn, a burn and then tan, etc.) after prolonged sun exposure or after a long period or season of being relatively unexposed. Although race is related to sun sensitivity, race and ethnicity are not adequate proxies for sun sensitivity.


Additional Information
- Skin Cancer (including Melanoma)—Patient Version. National Cancer Institute.
- Skin Cancer. American Cancer Society.
- National Council on Skin Cancer Prevention.
- Sunburn Protection Factor (SPF). U.S. Food and Drug Administration.
- The Risks of Tanning. U.S. Food and Drug Administration.
- Sunscreen: How to Help Protect Your Skin From the Sun. U.S. Food and Drug Administration.
- Melanoma Treatment (PDQ®)—Health Professional Version. National Cancer Institute.
- Skin Cancer Treatment (PDQ®)—Health Professional Version. National Cancer Institute.
- Sun Safety Evidence-Based Programs Listing. National Cancer Institute.
- Surgeon General's Call to Action to Prevent Skin Cancer. Centers for Disease Control and Prevention.
- Counseling on Sun Protection and Indoor Tanning. Balk SJ, Gottschlich EA, Holman DM, Watson M. Pediatrics. 2017;140(6): e20171680.
- Skin cancer: multicomponent community-wide interventions. Community Preventive Services Task Force.
- Sunlamps and Sunlamp Products (Tanning Beds/Booths). U.S. Food and Drug Administration.
- Behavioral counseling to prevent skin cancer: U.S. Preventive Services Task Force recommendation statement. U.S. Preventive Services Task Force. JAMA 2018;319(11):1134–1142.
- Effect of vitamin D supplementation on non-skeletal disorders: a systematic review of meta-analyses and randomized trials. Autier P, Mullie P, Macacu A et al. Lancet Diabetes Endocrinol. 2017;5(12):986-1004.
- VITamin D and OmegA-3 TriaL (VITAL Study). Brigham and Women’s Hospital.
- Interdisciplinary Perspectives on Sun Safety. Geller AC, Jablonski NG, Pagoto SL et al. JAMA Detmatol. 2018:154(1):88-92.
- Trends in indoor tanning and its association with sunburn among US adults. Guy GP, Watson M, Seidenberg AB et al. J Am Acad Dermatol. 2017;76(6):1191-1193 .
- The potential impact of reducing indoor tanning on melanoma prevention and treatment costs in the U.S.: An economic analysis. Guy GP, Zhang Y, Ekwueme DU et al. J Am Acad Dermatol. 2017;76(2):226-233.
- The Context of Sunburn Among U.S. Adults: Common Activities and Sun Protection Behaviors. Holman DM, Ragan KR, Julian AK, Perna FM. Am J Prev Med. 2021;60(5):213-220.
- Behavioral counseling to prevent skin cancer: U.S. Preventive Services Task Force recommendation statement. U.S. Preventive Services Task Force. JAMA 2018;319(11):1134–1142.
- Age-Specific Incidence of Melanoma in the United States. Paulson KG, Gupta D, Kim TS, et al. JAMA Dermatol. 2019. doi: 10.1001/jamadermatol.2019.3353. [Epub ahead of print]
- Research on Skin Cancer-Related Behaviors and Outcomes in the NIH Grant Portfolio, 2000-2014: Skin Cancer Intervention Across the Cancer Control Continuum (SCI-3C). Perna FM, Dwyer LA, Tesauro G et al. JAMA Dermatol. 2017;153(5): 398-405.
- State Indoor Tanning Laws and Prevalence of Indoor Tanning Among US High School Students, 2009-2015. Qin J, Holman DM, Jones SE et al. Am J Public Health. 2018;108(7):951-956.
- Implementation of the SunSmart program and population sun protection behaviour in Melbourne, Australia: Results from cross-sectional summer surveys from 1987 to 2017. Tabbakh T, Volkov A, Wakefield M, Dobbinson S. PLoS Med. 2019;16(10):e1002932.
- Tanning Salon Compliance Rates in States with Legislation to Protect Youth Access to UV Tanning. Williams MS, Buhalog B, Blumenthal L, Stratman EJ. JAMA Dermatol 2018;154(1):67-72.
- Prevalence of indoor tanning and association with sunburn among youth in the United States. Guy GP, Berkowitz Z, Jones ES et al. JAMA Dermatol 2017;153(5):387-390.
- SEER Cancer Statistics Review. National Cancer Institute.
- Cancer Statistics Center, 2018 Estimates. American Cancer Society.
- National Health Interview Survey. Centers for Disease Control and Prevention, National Center for Health Statistics.