On This Page:
- Background
- Measure
- Healthy People 2030 Target
- Data Source
- Trends and Most Recent Estimates
- Additional Information
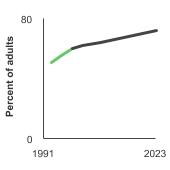
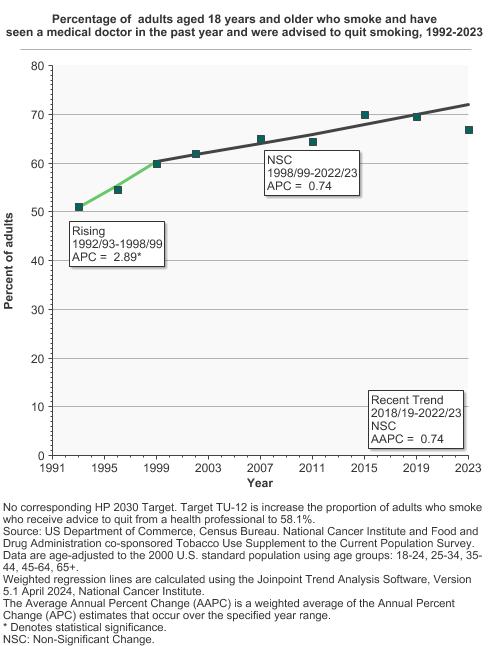
From 2022 to 2023, 66.8% of adults who smoked and had seen a medical doctor during the past 12 months reported being advised by any medical doctor to quit smoking.

Background
Clinicians’ advice to quit smoking can, by itself, increase quit attempts and quit success and can have even greater impact if coupled with cessation counseling and/or medication. In addition, even brief clinical interventions have been shown to be cost effective for increasing the motivation of people who smoke to quit.
Clinical guidelines recommend clinicians utilize the “5 A’s” (ask, advise, assess, assist, and arrange) when screening for tobacco use and providing cessation interventions. For patients ready to quit, clinicians can provide cessation assistance and support, including medication, counseling, referral to treatment extenders, and follow-up. For patients who are not yet ready to quit, clinicians can instead provide a brief intervention designed to promote the motivation to quit. A wide variety of clinicians, including dentists, physicians, nurses, and other health professionals such as pharmacists, can effectively implement brief strategies to increase future quit attempts.
Measure
The percentage of adults who smoke (aged 18 years and older) and have seen a medical doctor in the past 12 months who report that any medical doctor advised them to quit smoking.
Data Source
National Cancer Institute. Tobacco Use Supplement to the Current Population Survey.
Healthy People 2030 Target
- Increase to 58.1 percent the proportion of adults who smoke that receive advice to quit from a health professional.
This Healthy People 2030 (HP2030) goal is focused on smoking cessation advice from any health professional, including a physician, dentist, or other health professional. Data for this HP2030 goal are from the National Health Interview Survey. In contrast, the data presented in the Cancer Trends Progress Report only use reports of smoking cessation advice from a medical doctor. Data for this report are from the Tobacco Use Supplement to the Current Population Survey. Therefore, the data presented in this report cannot be directly compared to the HP2030 objective.
Healthy People 2030 is a set of goals set forth by the Department of Health and Human Services.
Note: Goals are indicated as blue line on Detailed Trend Graphs.
Trends and Most Recent Estimates
- By Sex
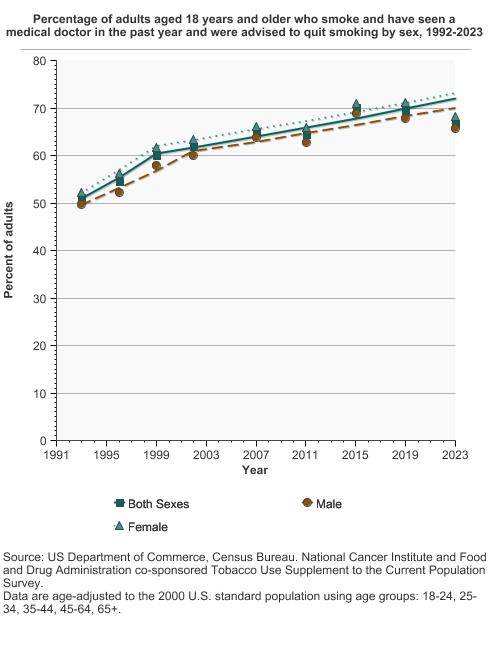
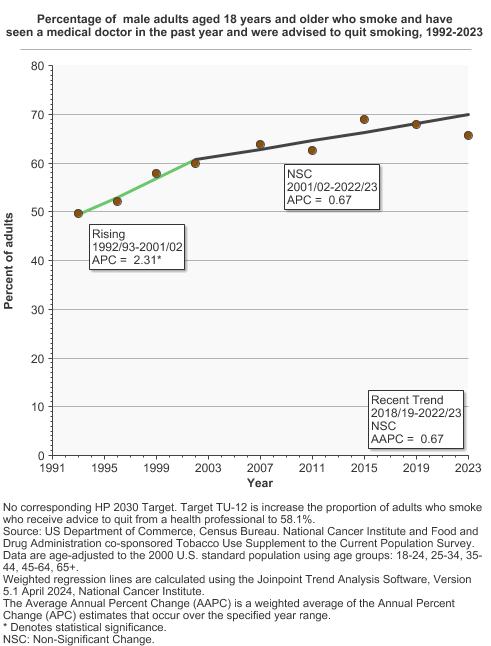
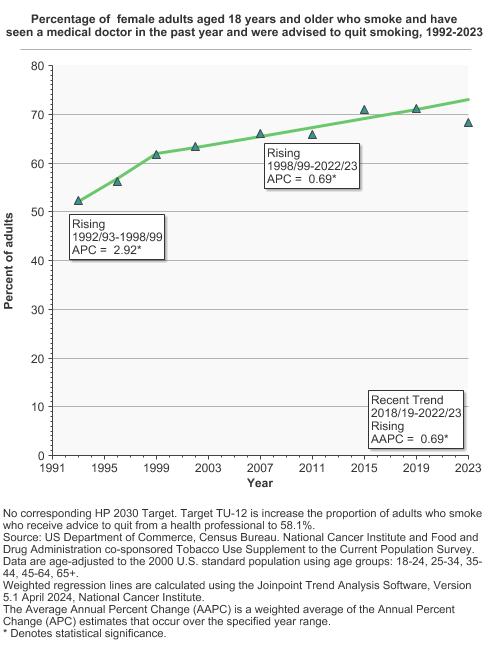
Percentage of adults aged 18 years and older who smoke and have seen a medical doctor in the past year and were advised to quit smoking by sex, 1992-2023 Overview Graph Detailed Trend Graphs Most Recent Estimates (2022 to 2023) Percent of adults 95% Confidence Interval 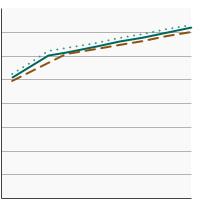

Both Sexes 
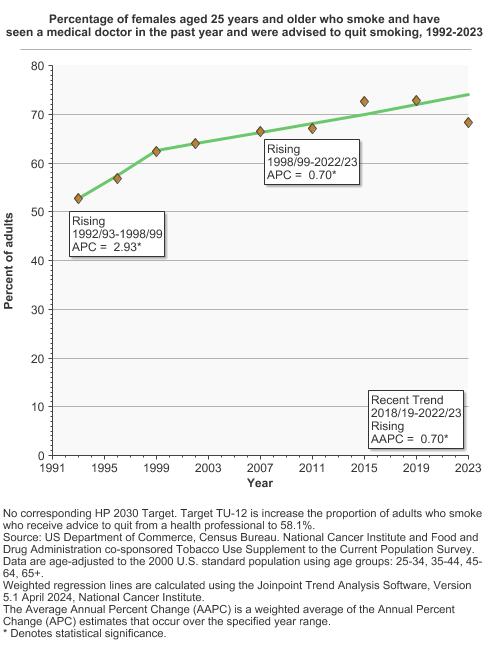
66.8 64.6 - 68.9 Male 65.6 62.5 - 68.6 Female 68.3 65.3 - 71.1 - By Race/Ethnicity
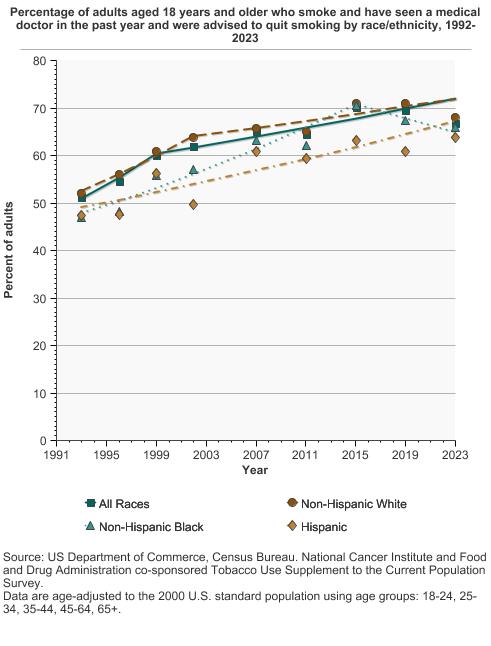
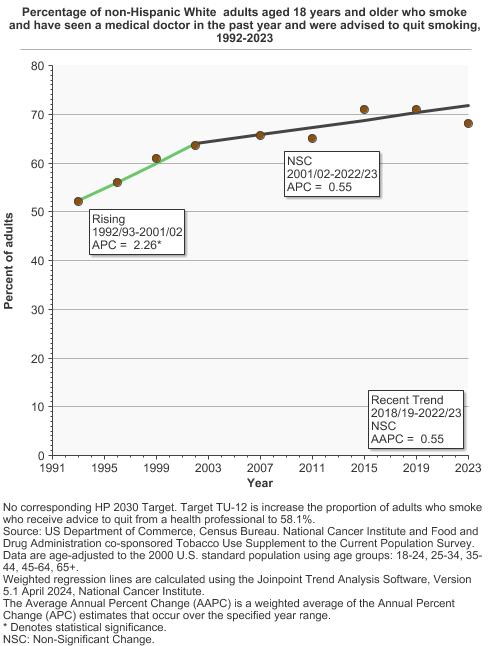
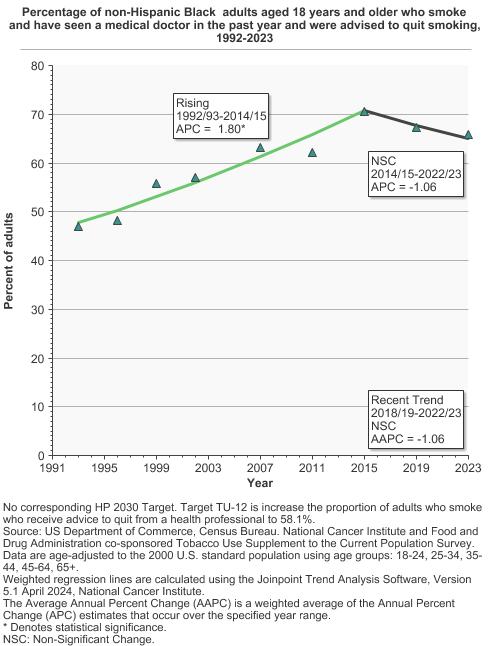
Percentage of adults aged 18 years and older who smoke and have seen a medical doctor in the past year and were advised to quit smoking by race/ethnicity, 1992-2023 Overview Graph Detailed Trend Graphs Most Recent Estimates (2022 to 2023) Percent of adults 95% Confidence Interval 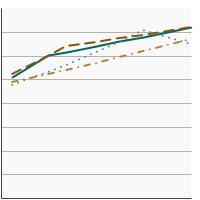
All Races 66.8 64.6 - 68.9 Non-Hispanic White 68.1 65.5 - 70.5 Non-Hispanic Black 65.9 57.9 - 73.2 Hispanic 63.8 57.3 - 69.9 - By Age
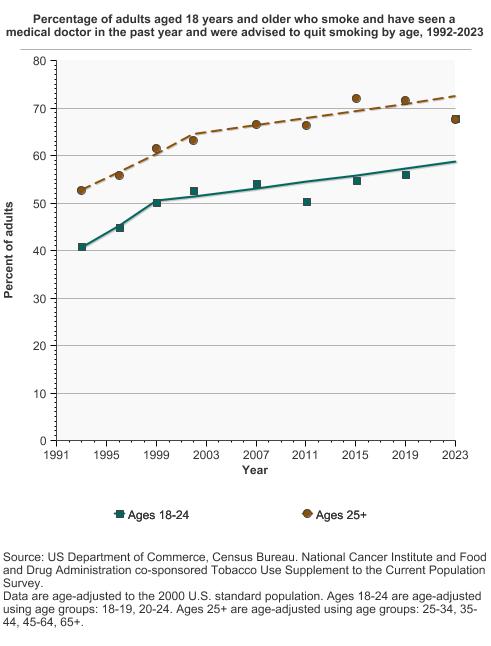
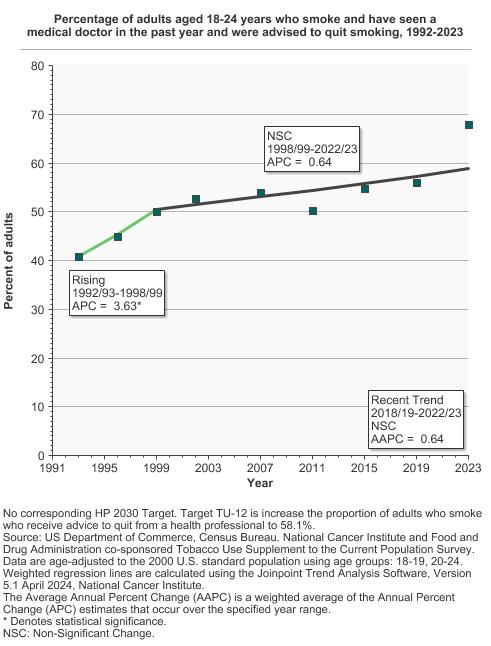
Percentage of adults aged 18 years and older who smoke and have seen a medical doctor in the past year and were advised to quit smoking by age, 1992-2023 Overview Graph Detailed Trend Graphs Most Recent Estimates (2022 to 2023) Percent of adults 95% Confidence Interval 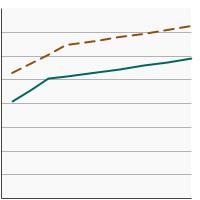
Ages 18-24 67.8 58.0 - 76.3 Ages 25+ 67.6 66.0 - 69.2 - By Sex and Age
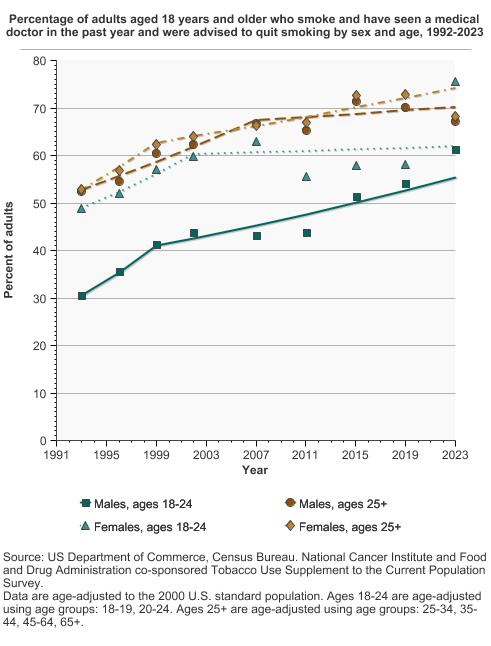
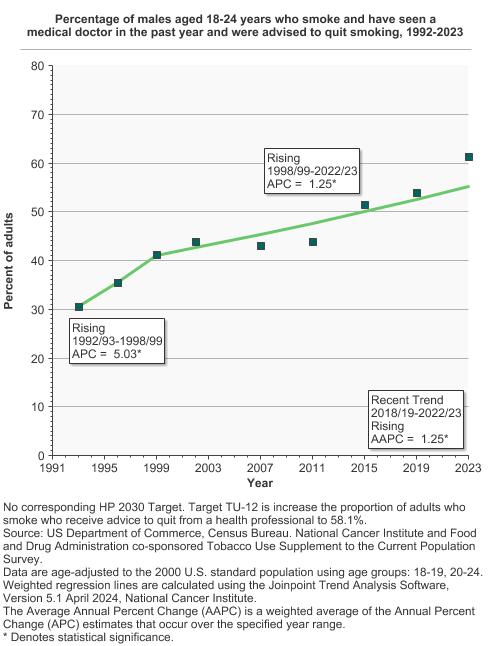
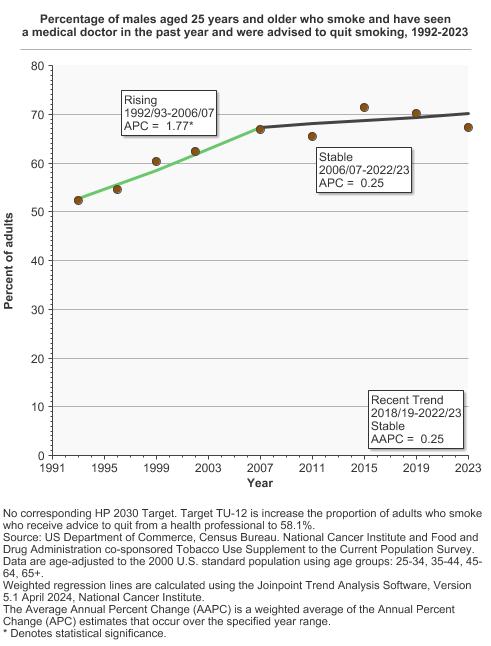
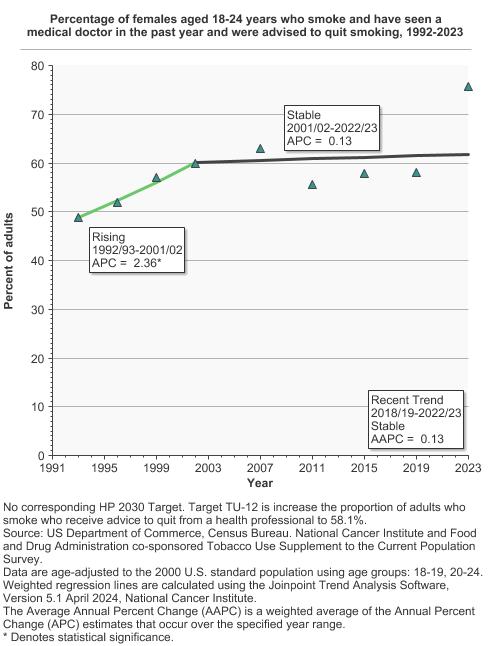
Percentage of adults aged 18 years and older who smoke and have seen a medical doctor in the past year and were advised to quit smoking by sex and age, 1992-2023 Overview Graph Detailed Trend Graphs Most Recent Estimates (2022 to 2023) Percent of adults 95% Confidence Interval 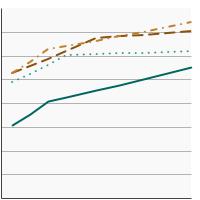
Males, ages 18-24 61.3 45.9 - 74.6 Males, ages 25+ 67.2 64.9 - 69.5 Females, ages 18-24 75.7 62.3 - 85.4 Females, ages 25+ 68.3 66.1 - 70.4 - By Poverty Income Level
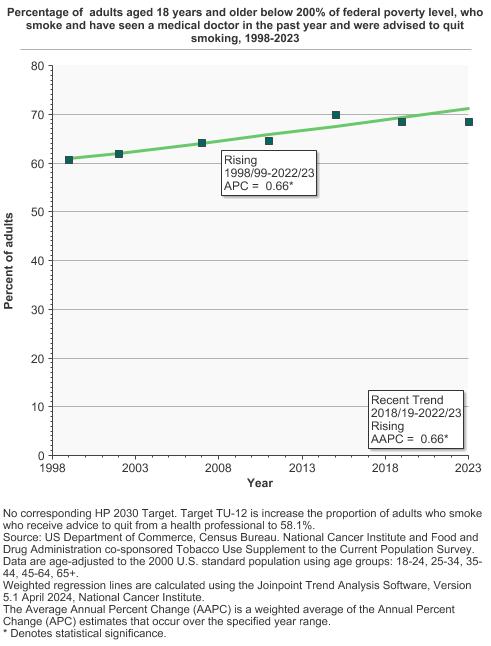
Percentage of adults aged 18 years and older who smoke and have seen a medical doctor in the past year and were advised to quit smoking by poverty income level, 1998-2023 Overview Graph Detailed Trend Graphs Most Recent Estimates (2022 to 2023) Percent of adults 95% Confidence Interval 
< 200% of the federal poverty level 68.5 65.2 - 71.7 >= 200% of the federal poverty level 65.5 61.7 - 69.1 - By Education Level
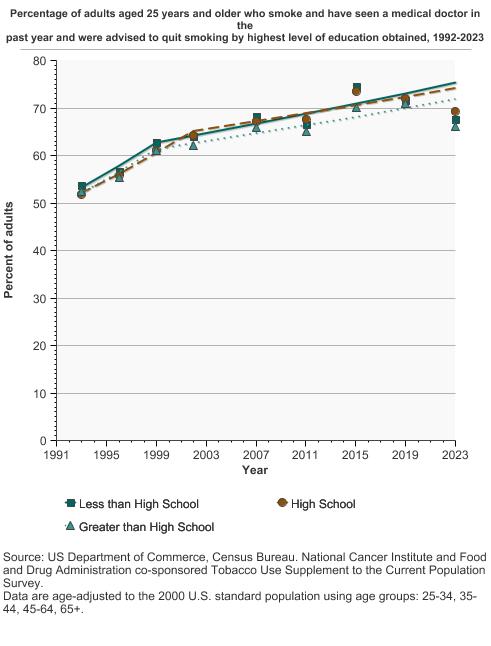
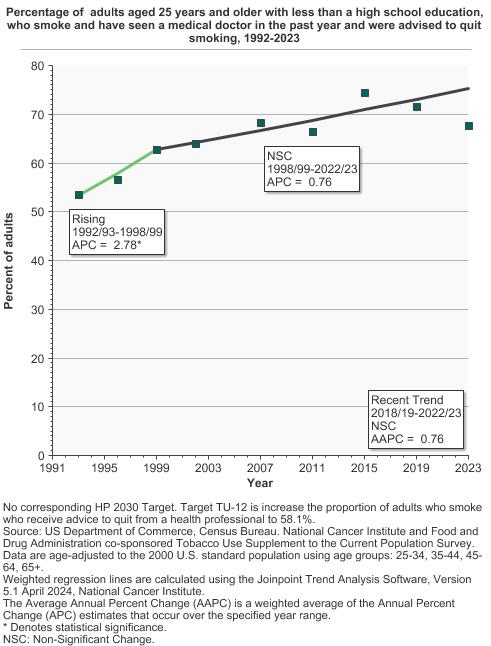
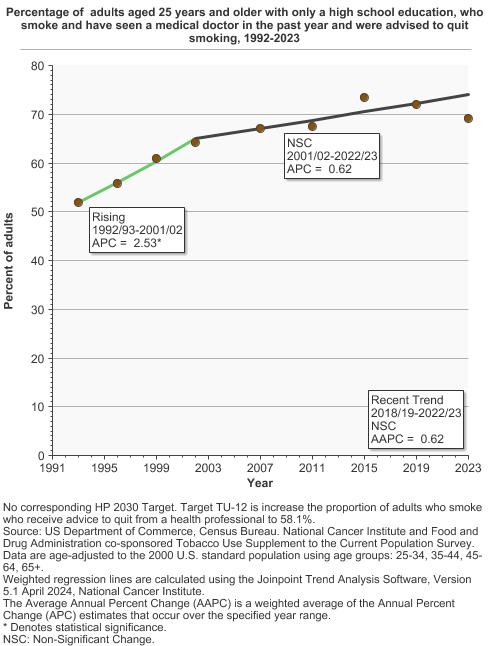
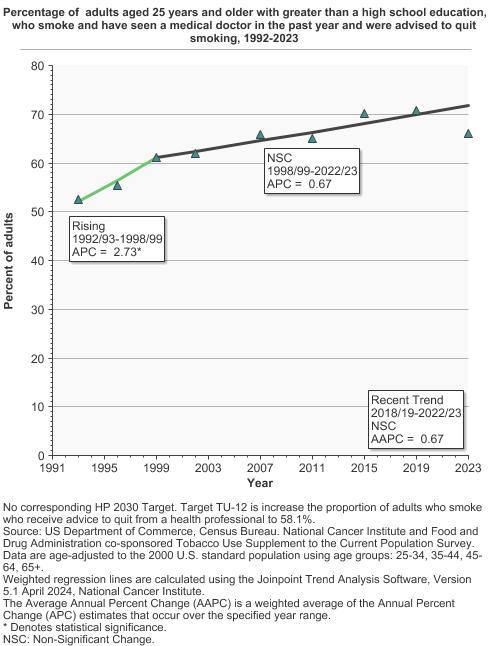
Percentage of adults aged 25 years and older who smoke and have seen a medical doctor in the past year and were advised to quit smoking by highest level of education obtained, 1992-2023 Overview Graph Detailed Trend Graphs Most Recent Estimates (2022 to 2023) Percent of adults 95% Confidence Interval 
Less than High School 67.7 62.3 - 72.6 High School 69.2 66.7 - 71.6 Greater than High School 66.1 63.8 - 68.4


Additional Information
- Tobacco and Cancer. American Cancer Society.
- What You Need to Know About Quitting Smoking: Advice from the Surgeon General. Centers for Disease Control and Prevention.
- Public Health Education. The Food and Drug Administration.
Quitting Resources
- Cigarette Smoking: Health Risks and How to Quit (PDQ®)–Patient Version. National Cancer Institute.
- Smokefree.gov. National Cancer Institute.
- How to Quit Using Tobacco. American Cancer Society.
- How to Quit Smoking. Centers for Disease Control and Prevention.
- Tobacco Control Evidence-Based Programs Listing. National Cancer Institute.
- Cigarette Smoking: Health Risks and How to Quit (PDQ®) - Health Professional Version. National Cancer Institute.
- Treating Tobacco Use and Dependence: 2008 Update. Agency for Healthcare Research and Quality.
- Best Practices for Comprehensive Tobacco Control Programs – 2014. Centers for Disease Control and Prevention.
- Healthcare Provider Resources: Smoking and Tobacco Use. Centers for Disease Control and Prevention.
- Surgeon General’s Reports on Smoking and Tobacco Use. Centers for Disease Control and Prevention.
- Tobacco Use. Million Hearts.
- Community Pharmacy Personnel Interventions for Smoking Cessation. Carson‐Chahhoud KV, Livingstone‐Banks J, Sharrad KJ, et. al. Cochrane Database Syst Rev. 2019;2019(10).
- Ask-Advise-Connect: Differential Enrollment and Smoking Cessation Outcomes Between Primary Care Patients Who Received Quitline-Delivered Treatment in Spanish vs English. Fennell BS, Piñeiro B, Vidrine DJ, et al. Ann Fam Med. 2022;20(6):519-525.
- Tobacco Cessation Counseling and Medications Provided by Physicians to Tobacco Users During Primary Care Visits. Geletko KW, Graves K, Lateef H, Harman J. J Prim Care Community Health. 2022;13.
- Nurse Counseling as Part of a Multicomponent Tobacco Treatment Intervention: An Integrative Review. Keller KG, Lach HW. J Addict Nurs. 2020;31(3):161-179.
- Strategies to improve smoking cessation rates in primary care. Lindson N, Pritchard G, Hong B, et al. Cochrane Database Syst Rev. 2021;9(9).
- Integration of the 5As Nicotine Cessation Framework in a Primary Care Clinic. Mangena N, Dabney BW, Linton M. J Nurs Care Qual. 2022;37(3):257-262.
- How To Support Smoking Cessation In Primary Care And The Community: A Systematic Review Of Interventions For The Prevention Of Cardiovascular Diseases. Odorico M, Le Goff D, Aerts N, Bastiaens H, Le Reste JY. Vasc Health Risk Manag. 2019;15:485-502.
- Patient-Reported Receipt of Oncology Clinician-Delivered Brief Tobacco Treatment (5As) Six Months following Cancer Diagnosis. Price SN, Neil JM, Flores M, et al. Addict Behav. 2023;101(5):328-342.
- Factors associated with smoking cessation attempts in a public, safety-net primary care system. Suen LW, Rafferty H, Le T, et al. Prev med Rep. 2022;26.
- Smokers' Receipt of Cessation Advice from Healthcare Professionals in National Samples of People Diagnosed with HIV and the General Population. Timberlake DS, Nwosisi NG. Subst Use Misuse. 2020;55(7):1079-1085.
- The Tobacco Use Supplement to the Current Population Survey. National Cancer Institute.
- The National Health Interview Survey Cancer Control Supplements. National Center for Health Statistics, co-sponsored by the National Cancer Institute/DCCPS and the Centers for Disease Control and Prevention/OSH and DCPC.