On This Page:
- Background
- Measure
- Healthy People 2030 Target
- Data Source
- Trends and Most Recent Estimates
- Related Cancers
- Additional Information
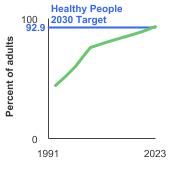
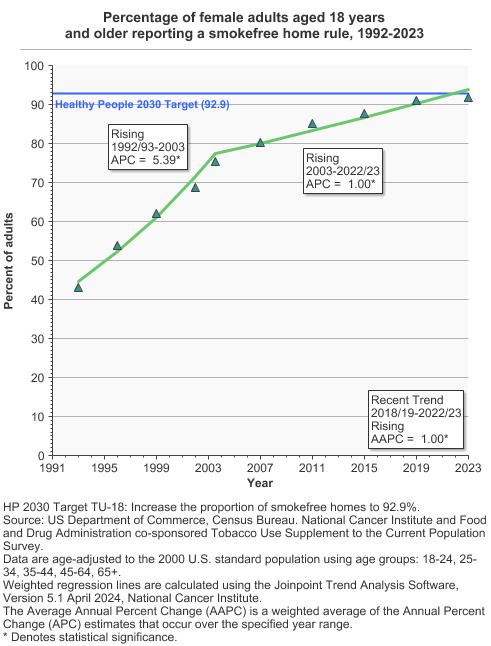
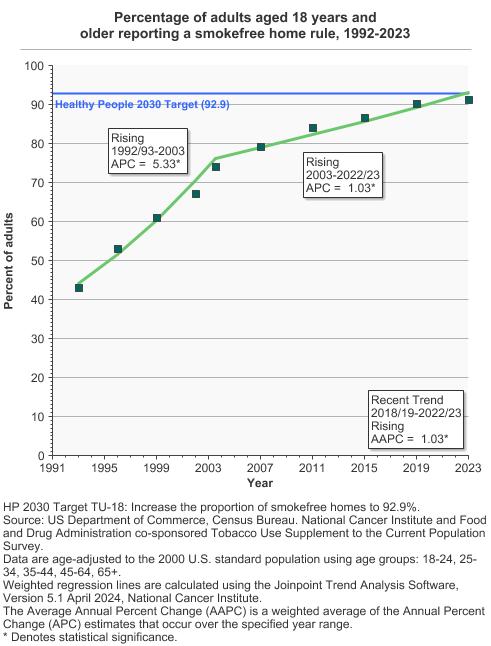
From 2022 to 2023, 91.2% of adults aged 18 years and older reported a smokefree home rule.

Background
Secondhand smoke (SHS) is a mixture of the sidestream smoke released by a smoldering cigarette, pipe, hookah or waterpipe, or cigar, and the mainstream smoke exhaled by a person who smokes. SHS is a complex mixture containing thousands of chemicals, including formaldehyde, cyanide, carbon monoxide, ammonia, and nicotine. More than 250 of the chemicals in SHS are known to be harmful, and at least 69 are known to cause cancer.
Conclusive scientific evidence documents that SHS causes premature death and disease in children and adults who do not smoke. Among adults, exposure to SHS has immediate adverse effects on the cardiovascular system, and long-term exposure to SHS causes coronary heart disease, stroke, and lung cancer. Children exposed to SHS are at increased risk for sudden infant death syndrome, acute respiratory infections, middle ear disease, more severe asthma, respiratory symptoms, and slowed lung growth.
There is no risk-free level of exposure to SHS. Eliminating smoking in indoor spaces, including homes and workplaces, is the only way to fully protect people who do not smoke from exposure to SHS.
Many individuals and families, including both people who smoke and people who don’t, have voluntarily adopted smokefree rules for their homes, reflecting a change in community social norms. Studies have found that adoption of smokefree home rules is a significant predictor of smoking cessation success. For children, smoking in the home is the main source of exposure to SHS. About 80 million (1 in 4) people in the US live in multiunit housing, such as apartments, including about 7 million living in government-subsidized housing. Secondhand smoke can travel between units and into common areas in multiunit housing. To protect nonsmokers living within public housing, the U.S. Department of Housing and Urban Development adopted a rule making all public housing smokefree. This rule was implemented in July 2018.
Smokefree laws in workplaces not only protect people from SHS exposure, but also reduce youth initiation and encourage people who smoke to quit. As of January 1, 2025, thirty-eight states, along with the District of Columbia, American Samoa, Guam, the Northern Mariana Islands, Puerto Rico, and the U.S. Virgin Islands, have laws in effect that require one or more of the following venues to be 100% smokefree: non-hospitality workplaces, restaurants, bars, and state-run gambling establishments. A total of 1,216 cities and counties have a 100% smokefree provision in effect in the following venues: non-hospitality workplaces, restaurants, and bars. In 2021, the Navajo Nation become the first tribe to pass legislation to create a comprehensive commercial tobacco free environment for all public places (including the four Navajo casinos, pow wows, annual festivals, and sports and rodeos). This will protect people living within and visiting the Navajo Nation who do not smoke.
E-cigarettes (also known as vapes or Electronic Nicotine Delivery Systems) are battery-powered devices that convert a liquid (“e-liquid”) into an aerosol. E-liquids typically contain nicotine, flavorings, vegetable glycerin, propylene glycol and other chemicals. In addition to nicotine, e-cigarette aerosol may contain heavy metals, volatile organic compounds, and fine and ultrafine particles that can be inhaled deeply into the lungs by both users and by-standers. States and localities are increasingly incorporating prohibition of e-cigarette use into comprehensive smokefree air laws. As of January 1, 2025, 27 states, including the territories of Guam, the Northern Mariana Islands, and Puerto Rico, and 1,069 municipalities have prohibited the use of e-cigarettes in 100% smokefree locations.
Measure
The percentage of respondents reporting a smokefree home rule (i.e., that smoking was not allowed anywhere in their home).
The percentage of indoor workers reporting a smokefree worksite rule (i.e., no smoking allowed in any indoor public/common or work areas).
The percentage of the population protected by local and state smokefree indoor air laws covering workplaces, restaurants, and bars. This measure draws on data collected and analyzed by the Americans for Nonsmokers’ Rights Foundation. Use of this information allows the National Cancer Institute (NCI) to include both local and state laws in its assessments.
Data Source
National Cancer Institute. Tobacco Use Supplement to the Current Population Survey.
Americans for Nonsmokers Right Foundation. “Percentage of the population covered by local and/or state 100% smokefree air laws”.
Healthy People 2030 Target
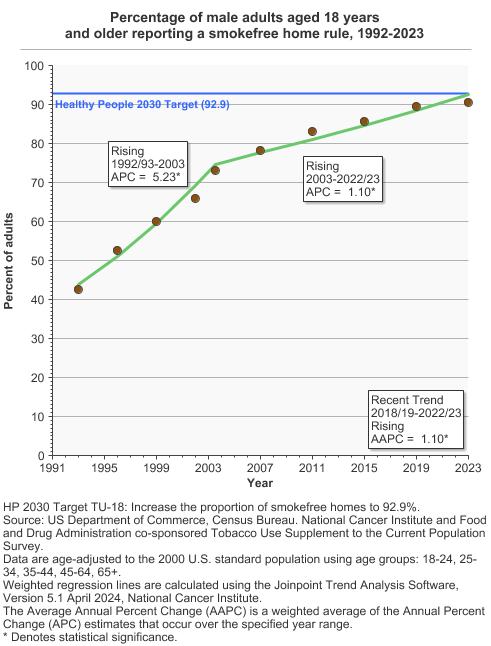
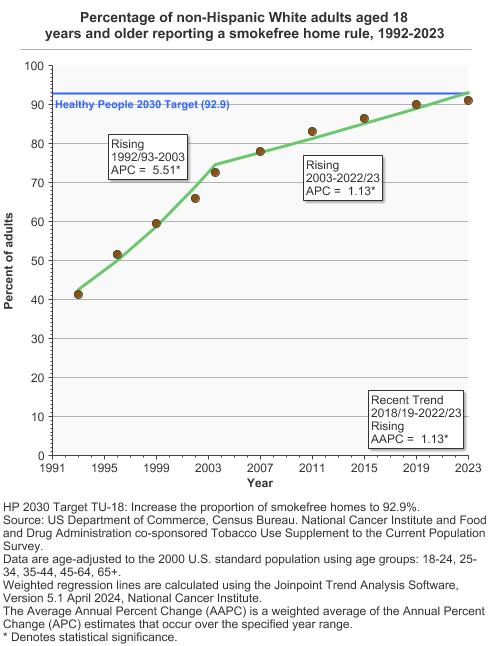
- Increase the proportion of smokefree homes to 92.9 percent.
- Increase the proportion of worksites that are covered by indoor worksite policies that prohibit smoking (Developmental Objective)
- Increase the number of states, territories, and DC that prohibit smoking in worksites, restaurants, and bars to 58.
While the Healthy People 2030 (HP2030) developmental objective focuses on the proportion of worksites covered by indoor worksite policies that prohibit smoking, data presented in the Cancer Trends Progress Report focus on the proportion of indoor workers reporting that smoking is prohibited in all indoor public/common or work areas. Therefore, the data presented in this report cannot be directly compared to the HP2030 developmental objective.
Healthy People 2030 is a set of goals set forth by the Department of Health and Human Services.
Note: Goals are indicated as blue line on Detailed Trend Graphs.
Trends and Most Recent Estimates
- Smokefree Home Rule
- By Sex
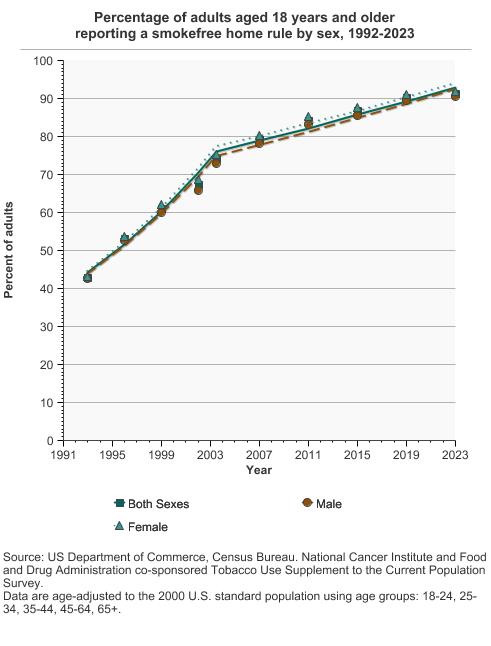
Percentage of adults aged 18 years and older reporting a smokefree home rule by sex, 1992-2023 Overview Graph Detailed Trend Graphs Most Recent Estimates (2022 to 2023) Percent of adults 95% Confidence Interval 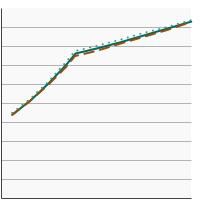

Both Sexes 
91.2 91.0 - 91.4 Male 90.5 90.2 - 90.8 Female 91.9 91.5 - 92.2 - By Race/Ethnicity
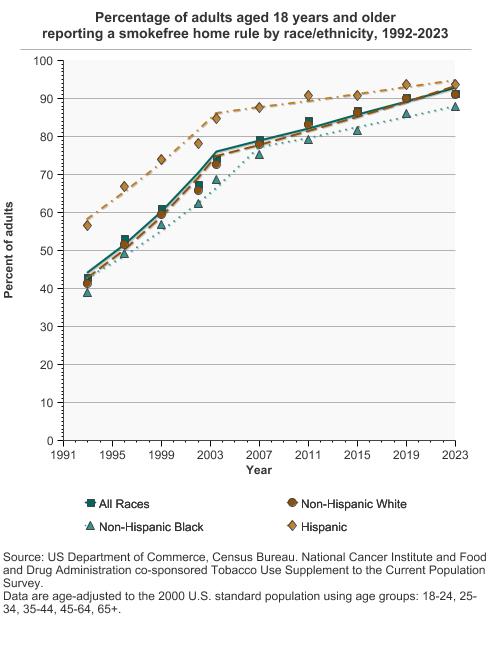
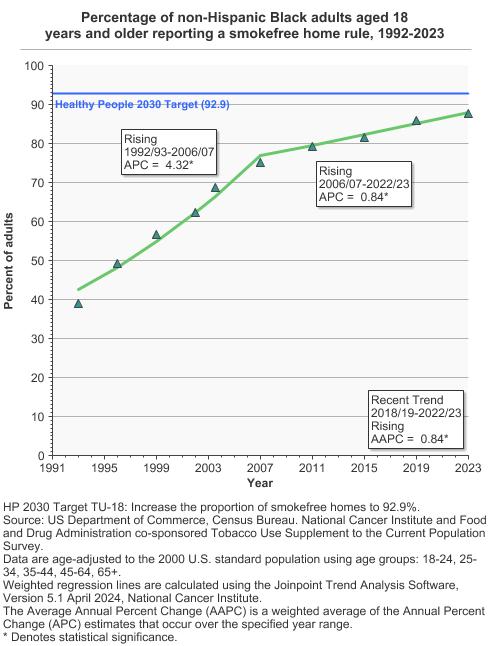
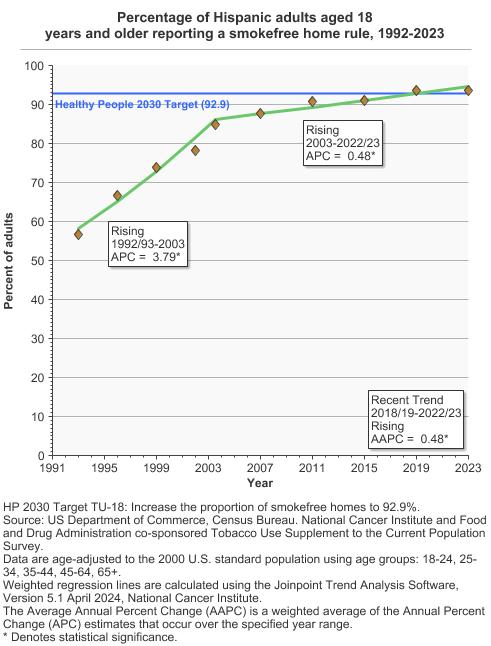
Percentage of adults aged 18 years and older reporting a smokefree home rule by race/ethnicity, 1992-2023 Overview Graph Detailed Trend Graphs Most Recent Estimates (2022 to 2023) Percent of adults 95% Confidence Interval 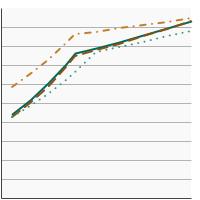
All Races 91.2 91.0 - 91.4 Non-Hispanic White 91.1 90.8 - 91.4 Non-Hispanic Black 87.8 87.0 - 88.6 Hispanic 93.7 93.2 - 94.1 - By Age
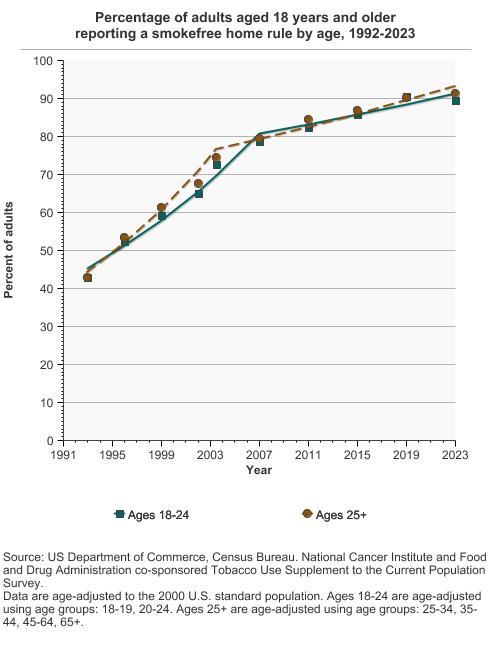
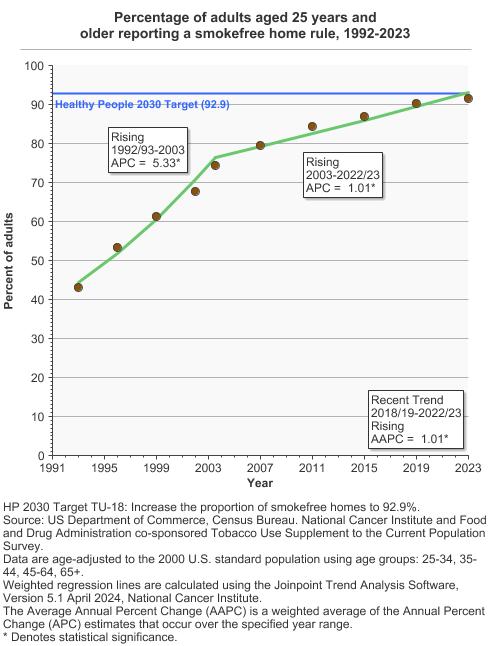
Percentage of adults aged 18 years and older reporting a smokefree home rule by age, 1992-2023 Overview Graph Detailed Trend Graphs Most Recent Estimates (2022 to 2023) Percent of adults 95% Confidence Interval 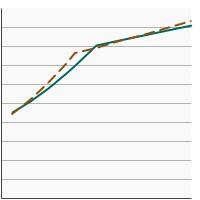
Ages 18-24 89.6 88.6 - 90.5 Ages 25+ 91.4 91.2 - 91.7 - By Sex and Age
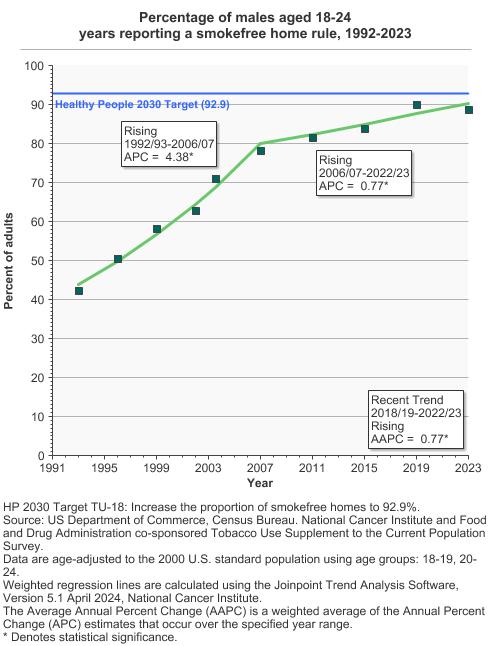
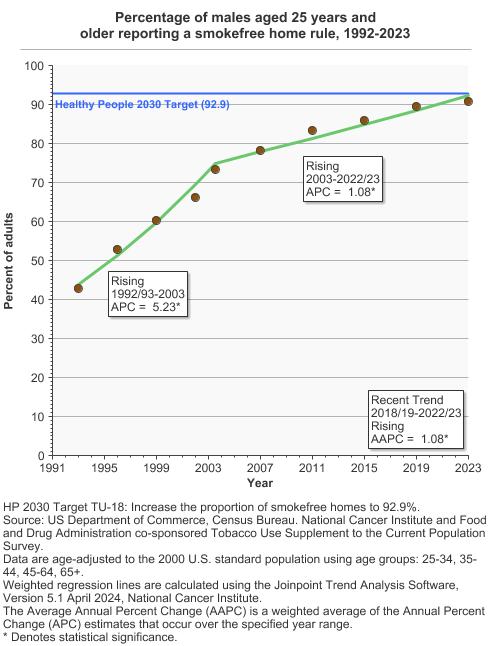
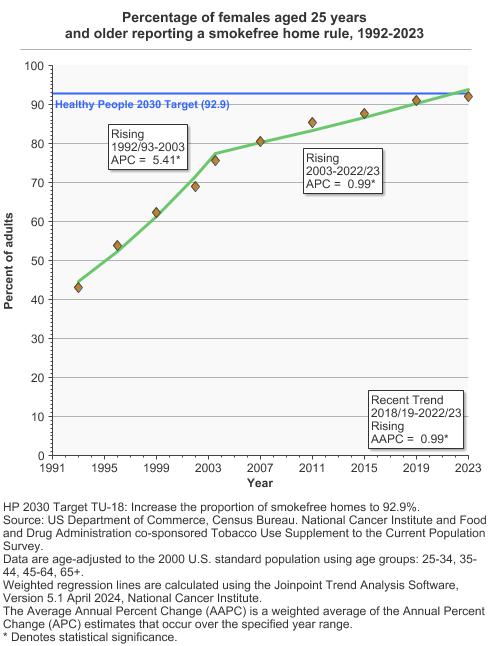
Percentage of adults aged 18 years and older reporting a smokefree home rule by sex and age, 1992-2023 Overview Graph Detailed Trend Graphs Most Recent Estimates (2022 to 2023) Percent of adults 95% Confidence Interval 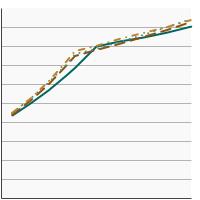
Males, ages 18-24 88.8 87.4 - 90.0 Males, ages 25+ 90.8 90.5 - 91.1 Females, ages 18-24 90.4 89.0 - 91.6 Females, ages 25+ 92.1 91.8 - 92.4 - By Poverty Income Level
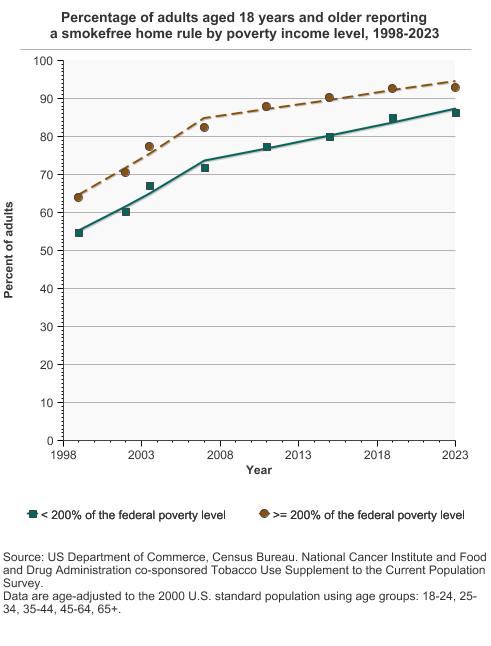
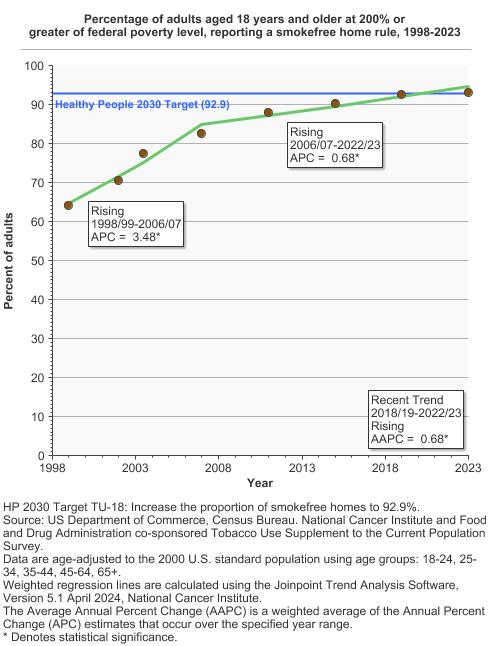
Percentage of adults aged 18 years and older reporting a smokefree home rule by poverty income level, 1998-2023 Overview Graph Detailed Trend Graphs Most Recent Estimates (2022 to 2023) Percent of adults 95% Confidence Interval 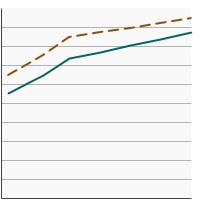
< 200% of the federal poverty level 86.3 85.7 - 86.8 >= 200% of the federal poverty level 93.0 92.7 - 93.3 - By Education Level
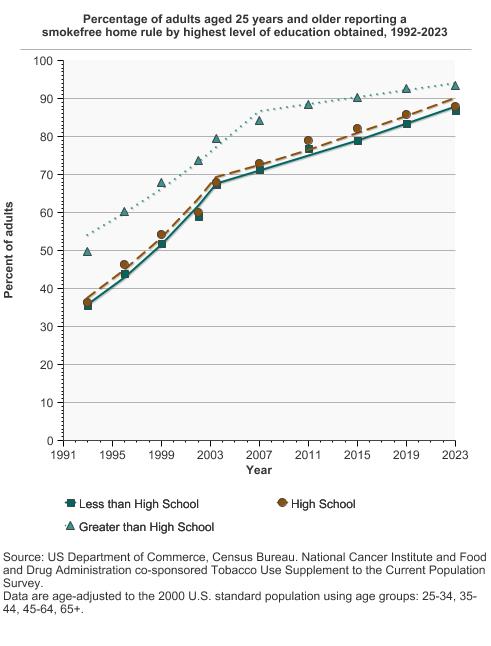
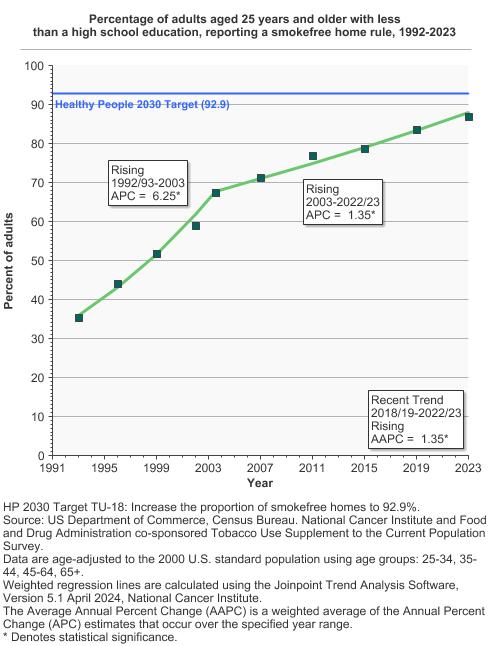
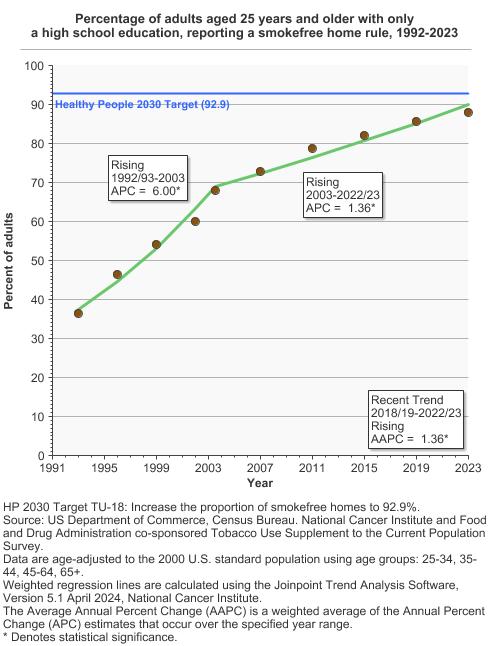
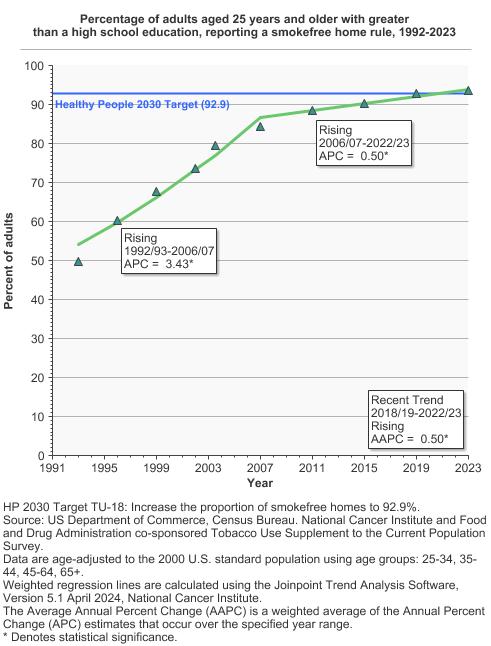
Percentage of adults aged 25 years and older reporting a smokefree home rule by highest level of education obtained, 1992-2023 Overview Graph Detailed Trend Graphs Most Recent Estimates (2022 to 2023) Percent of adults 95% Confidence Interval 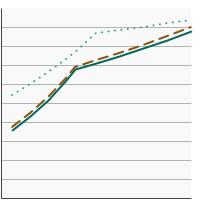
Less than High School 87.0 85.9 - 88.0 High School 87.9 87.3 - 88.4 Greater than High School 93.5 93.3 - 93.7
- Smokefree Workplace Rules
- By Sex
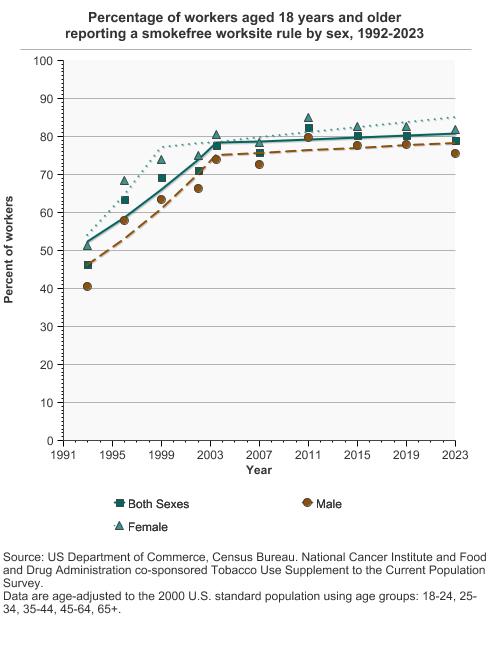
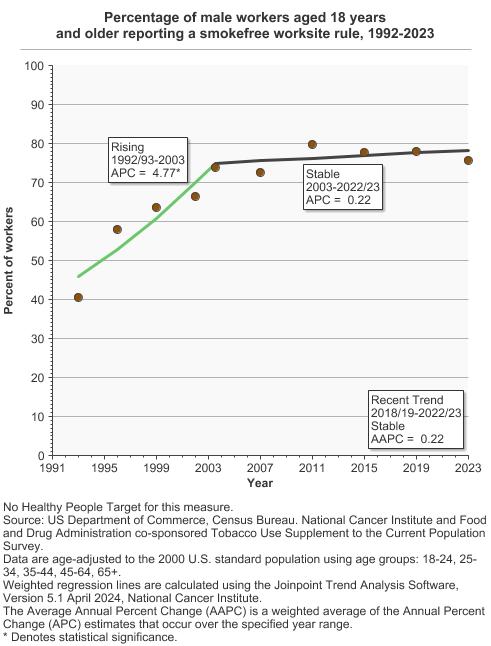
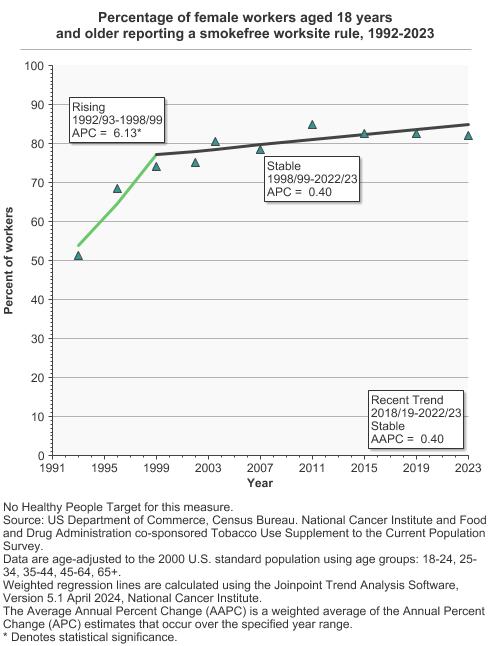
Percentage of workers aged 18 years and older reporting a smokefree worksite rule by sex, 1992-2023 Overview Graph Detailed Trend Graphs Most Recent Estimates (2022 to 2023) Percent of workers 95% Confidence Interval 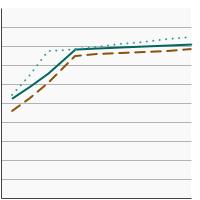
Both Sexes 78.8 78.3 - 79.4 Male 75.5 74.7 - 76.3 Female 81.9 81.2 - 82.6 - By Race/Ethnicity
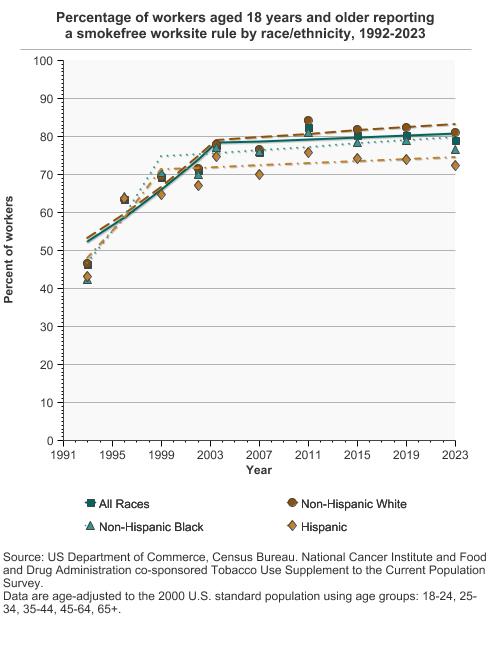
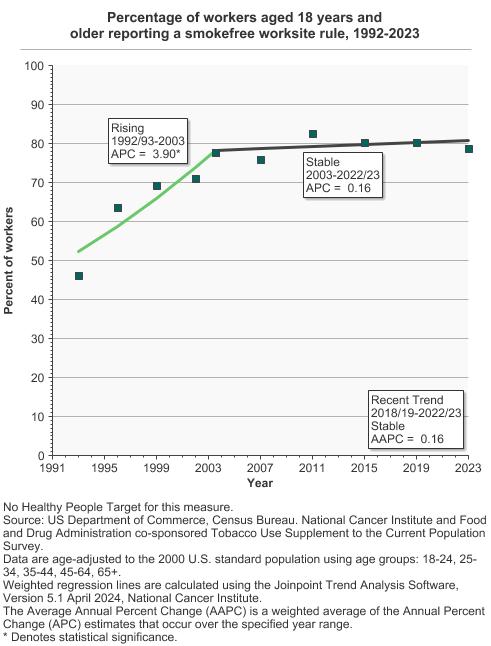
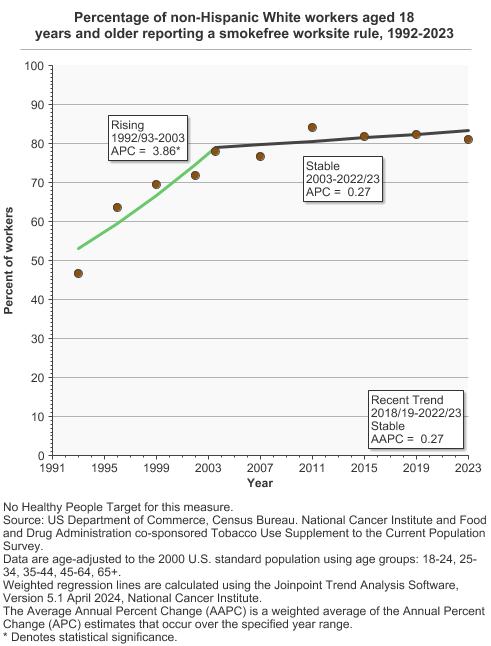
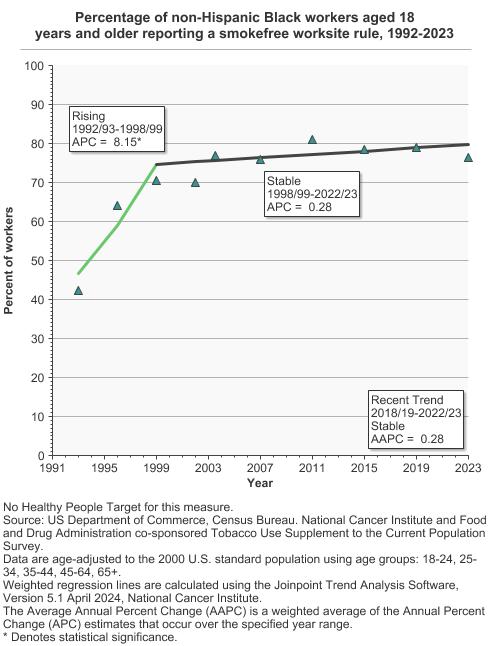
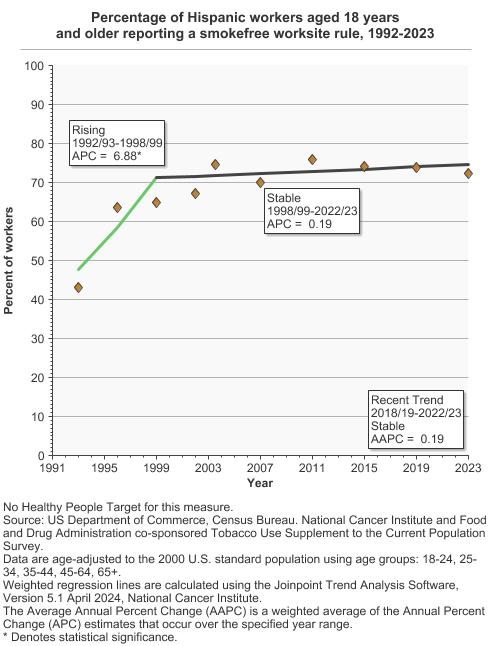
Percentage of workers aged 18 years and older reporting a smokefree worksite rule by race/ethnicity, 1992-2023 Overview Graph Detailed Trend Graphs Most Recent Estimates (2022 to 2023) Percent of workers 95% Confidence Interval 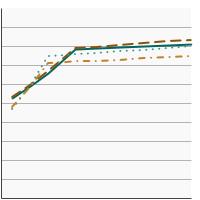
All Races 78.8 78.3 - 79.4 Non-Hispanic White 81.0 80.4 - 81.7 Non-Hispanic Black 76.5 74.8 - 78.1 Hispanic 72.4 70.6 - 74.2 - By Age
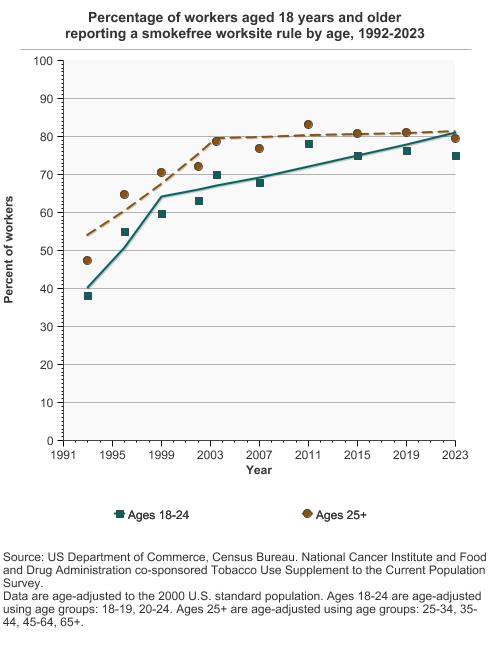
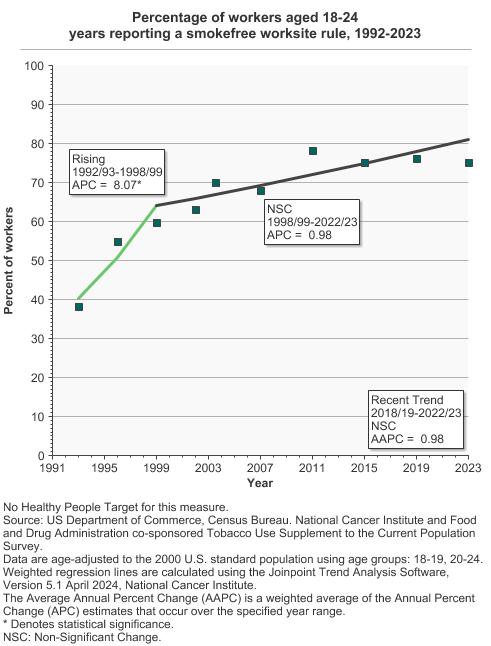
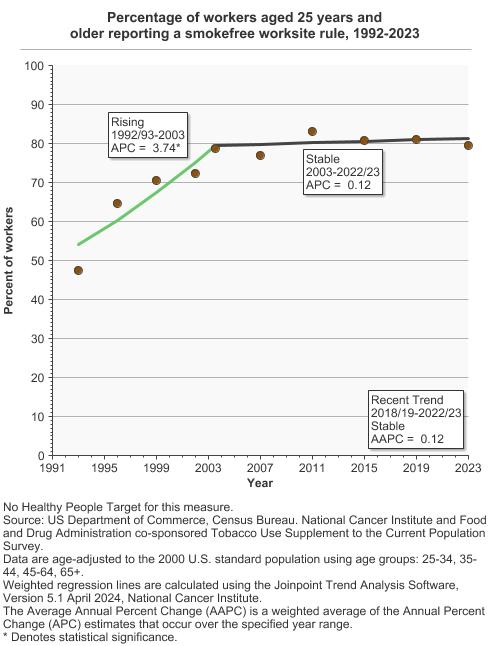
Percentage of workers aged 18 years and older reporting a smokefree worksite rule by age, 1992-2023 Overview Graph Detailed Trend Graphs Most Recent Estimates (2022 to 2023) Percent of workers 95% Confidence Interval 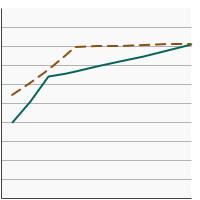
Ages 18-24 75.1 72.9 - 77.2 Ages 25+ 79.4 78.8 - 79.9 - By Sex and Age
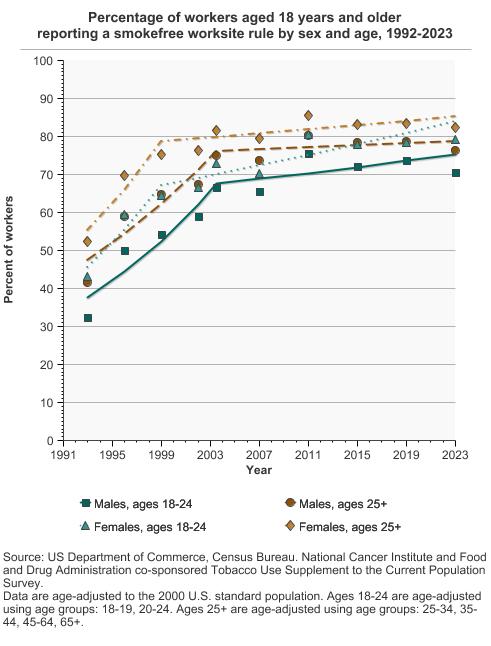
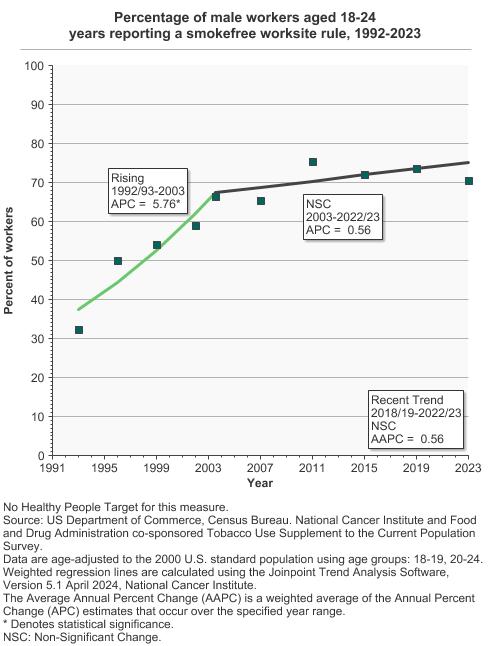
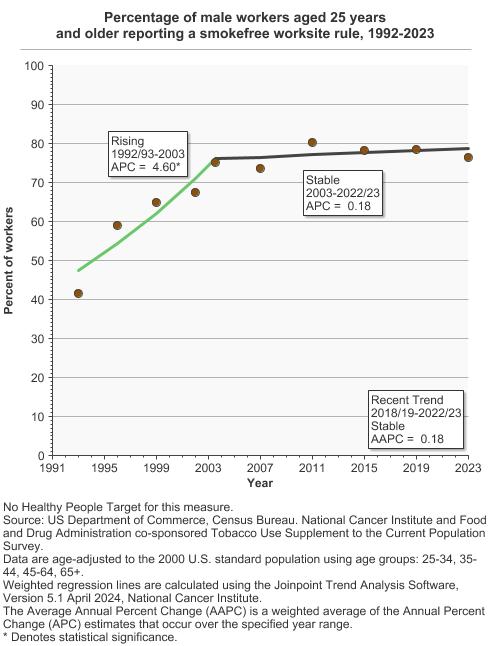
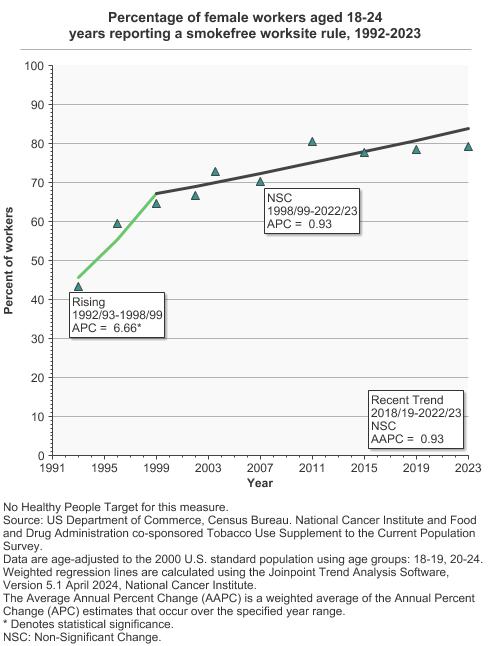
Percentage of workers aged 18 years and older reporting a smokefree worksite rule by sex and age, 1992-2023 Overview Graph Detailed Trend Graphs Most Recent Estimates (2022 to 2023) Percent of workers 95% Confidence Interval 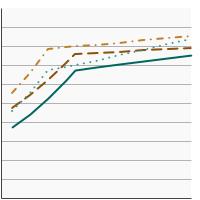
Males, ages 18-24 70.5 67.2 - 73.5 Males, ages 25+ 76.3 75.5 - 77.1 Females, ages 18-24 79.3 76.5 - 81.9 Females, ages 25+ 82.3 81.5 - 83.0 - By Poverty Income Level
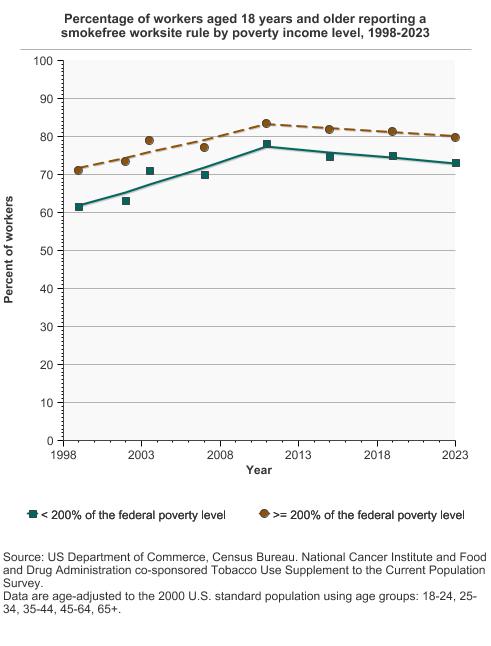
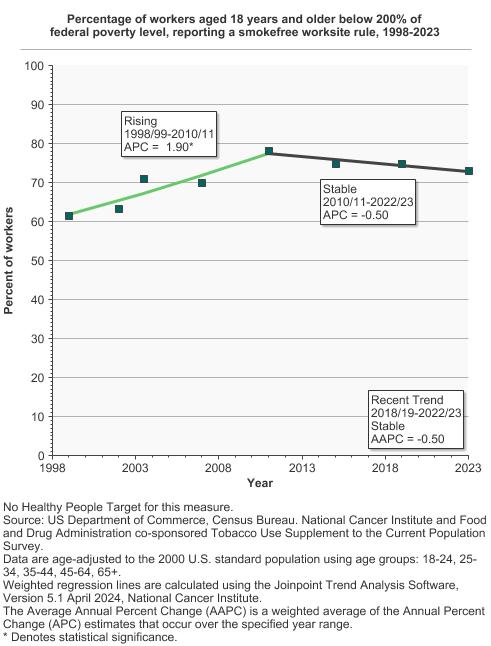
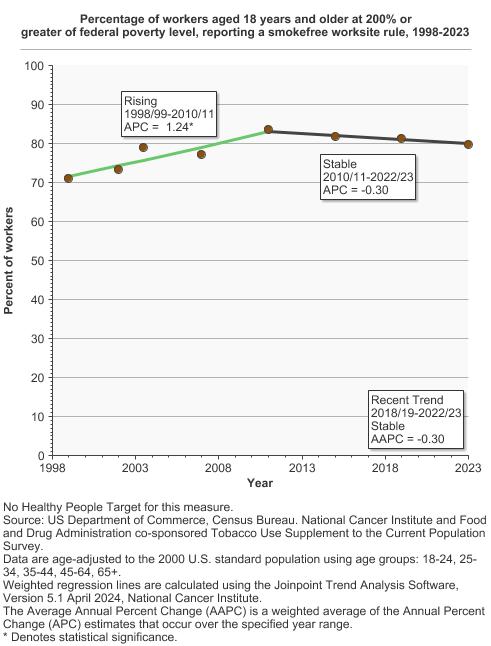
Percentage of workers aged 18 years and older reporting a smokefree worksite rule by poverty income level, 1998-2023 Overview Graph Detailed Trend Graphs Most Recent Estimates (2022 to 2023) Percent of workers 95% Confidence Interval 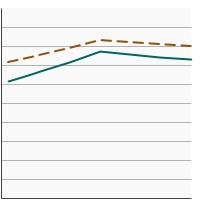
< 200% of the federal poverty level 73.1 71.5 - 74.5 >= 200% of the federal poverty level 79.8 79.1 - 80.5 - By Education Level
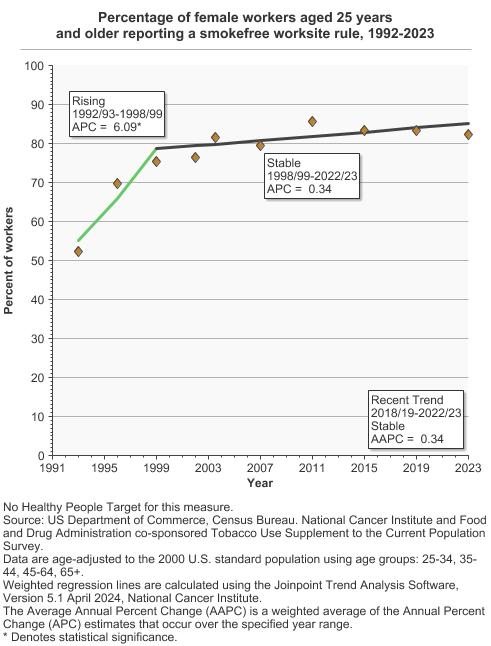
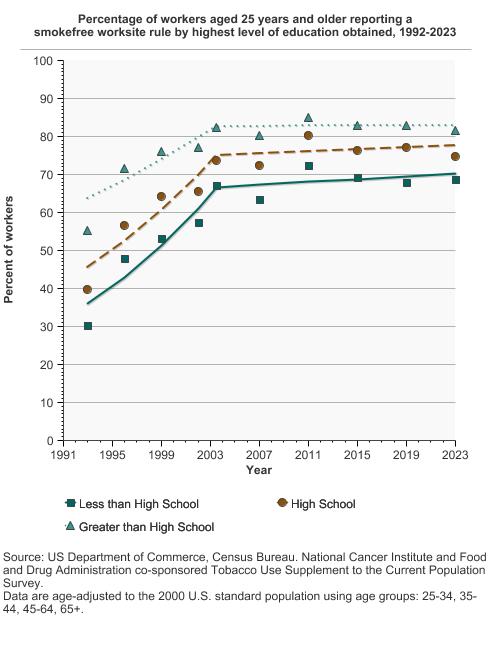
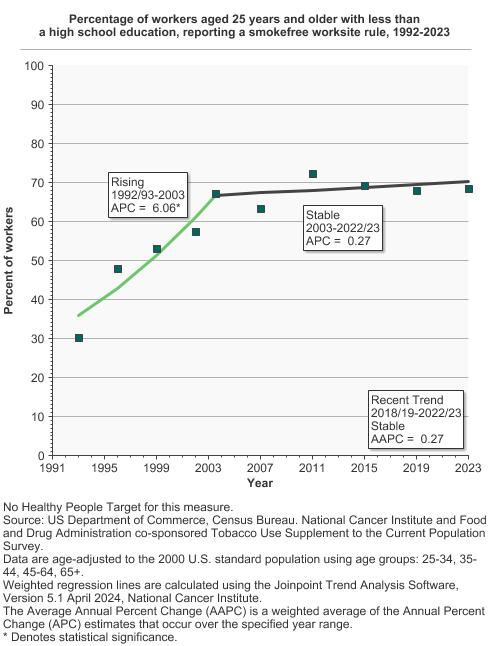
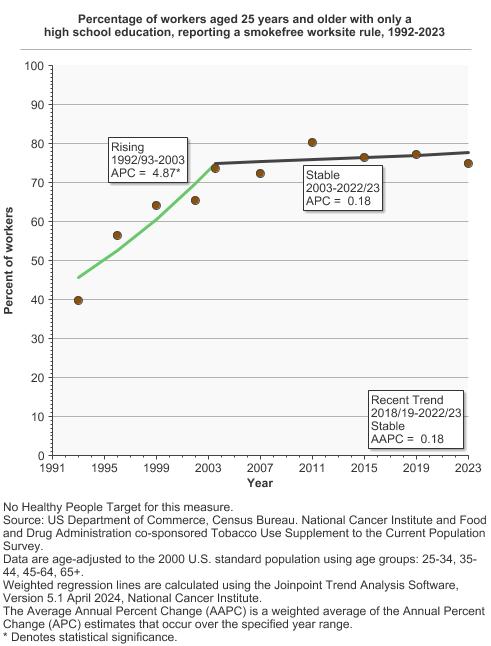
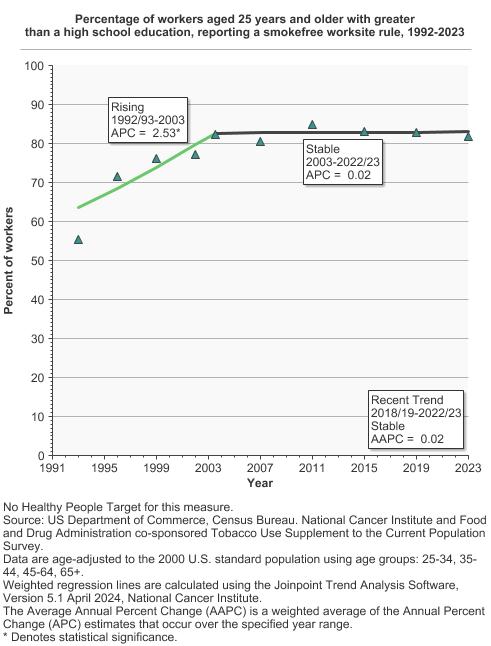
Percentage of workers aged 25 years and older reporting a smokefree worksite rule by highest level of education obtained, 1992-2023 Overview Graph Detailed Trend Graphs Most Recent Estimates (2022 to 2023) Percent of workers 95% Confidence Interval 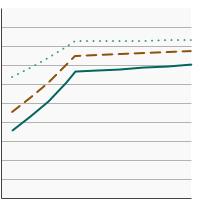
Less than High School 68.6 65.8 - 71.2 High School 74.8 73.4 - 76.1 Greater than High School 81.7 81.1 - 82.4
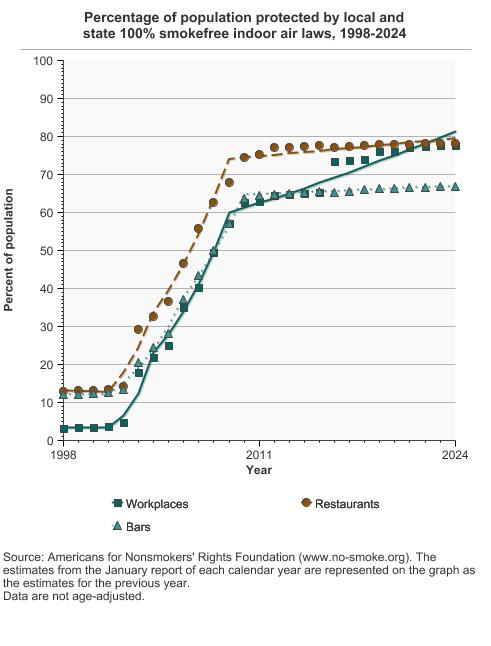
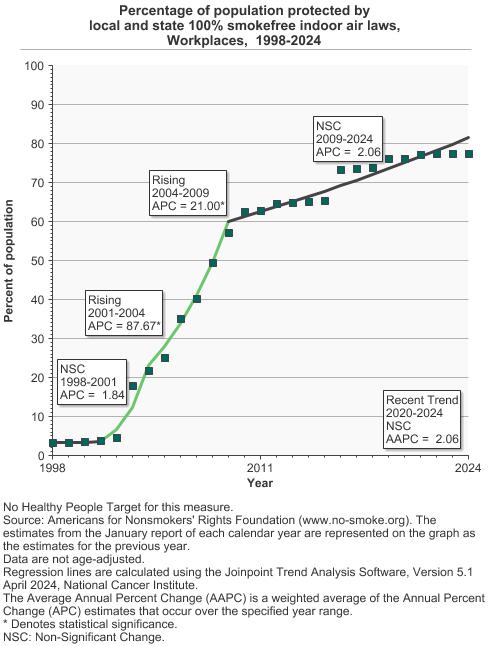
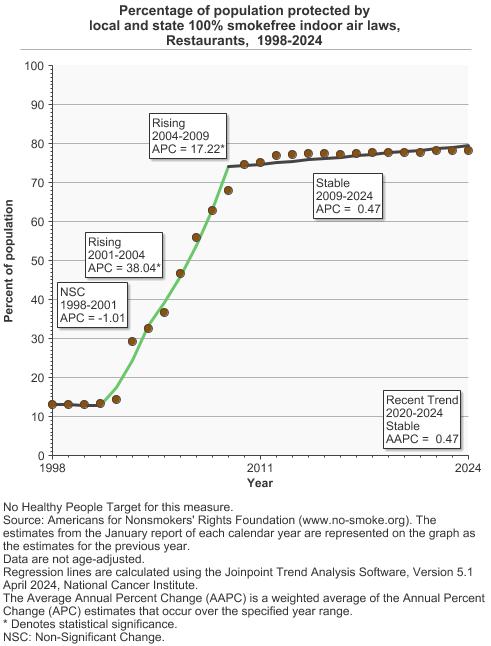
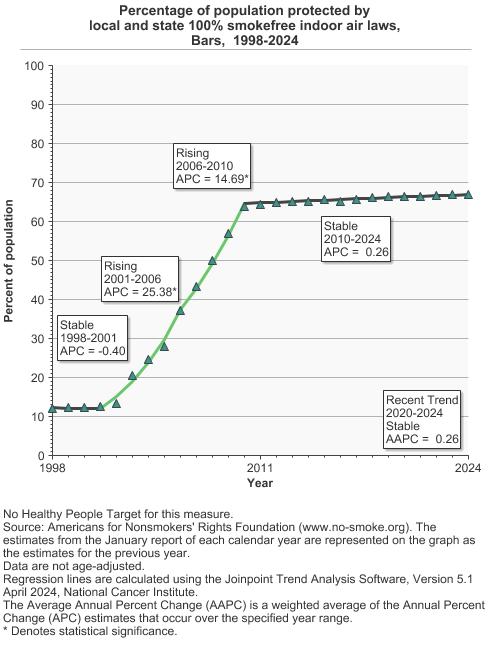
- Indoor Air Laws
Percentage of population protected by local and state 100% smokefree indoor air laws, 1998-2024 Overview Graph Detailed Trend Graphs Most Recent Estimates (2024) Percent of population 95% Confidence Interval 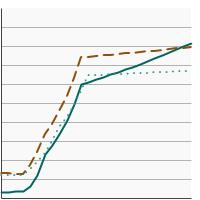
Workplaces 77.6 Not available Restaurants 78.2 Not available Bars 66.8 Not available


Additional Information
- Secondhand Smoke Exposure. National Cancer Institute.
- Secondhand Smoke and Cancer. National Cancer Institute.
- Going Smokefree Matters: In Your Home. Centers for Disease Control and Prevention.
- Going Smokefree Matters: Multiunit Housing. Centers for Disease Control and Prevention.
- The Effects of Secondhand Smoke on Worker Health. American Cancer Society.
- Tobacco Control Evidence-Based Programs Listing. National Cancer Institute.
- Surgeon General’s Reports on Smoking and Tobacco Use. Centers for Disease Control and Prevention.
- American Nonsmokers’ Rights Foundation.
- Small Area Estimation of Smoke-free Workplace Polices and Home Rules in U.S. Counties. Liu B, Dompreh I, Hartman AM. Nicotine Tob Res. 2021; [Epub ahead of print]
- National and state prevalence of smoke-free rules in homes with and without children and smokers: Two decades of progress. King BA, Patel R, Babb SD, et al. A. Prev Med. 2016 Jan;82:51-8.
- Persistent tobacco smoke residue in multiunit housing: Legacy of permissive indoor smoking policies and challenges in the implementation of smoking bans. Matt GE, Quintana PJE, Hoh E, et al. Prev Med Rep 2020;18:101088.
- Uneven Access to Smoke-Free Laws and Policies and Its Effect on Health Equity in the United States: 2000–2019. Hafez AY, Gonzalez M, Kulik MC, Vijayaraghavan M, Glantz SA. Am J Public Health. 2019;109(11):1568-1575.
- Workplace Smoke-Free Policies and Cessation Programs Among U.S. Working Adults. Syamlal G, King BA, Mazurek JM. Am J Prev Med. 2019 Apr;56(4):548-562.
- Tobacco Use Supplement to the Current Population Survey. National Cancer Institute.
- Cancer Facts and Figures. American Cancer Society.
- National Health and Nutrition Examination Survey. Centers for Disease Control and Prevention, National Center for Health Statistics.
- State Tobacco Activities Tracking and Evaluation System. Centers for Disease Control and Prevention.