On This Page:
- Background
- Measure
- Healthy People 2030 Target
- Data Source
- Trends and Most Recent Estimates
- Related Cancers
- Additional Information
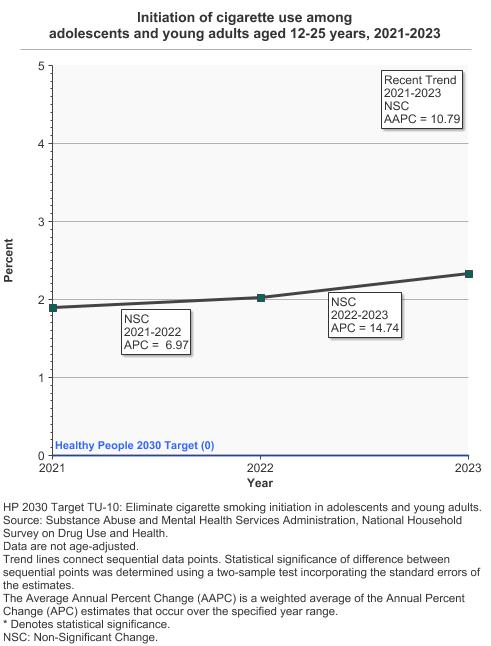
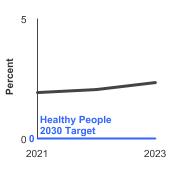
In 2023, 2.3% of adolescents and young adults aged 12 to 25 began smoking cigarettes in the past year.
Background
Because cigarette smoking typically begins during adolescence, smoking is often described as a “pediatric disease.” Nearly 90 percent of adults in the United States who smoke daily began smoking by age 18, and 98 percent first smoked by age 26. Nicotine is highly addictive; initiation of smoking during adolescence is linked to persistent smoking in adulthood and the many adverse health effects caused by smoking. Further, exposure to nicotine during adolescence may harm normal brain development, which continues until about age 25. Specifically, nicotine exposure during adolescence may impair development of brain regions involved in attention, learning, and impulse control, and it may prime the brain for addiction to other drugs.
Cigarettes are not the only tobacco products taken up during adolescence. Reports show use of other tobacco products, such as electronic cigarettes, also begins in adolescence. Understanding trends in youth initiation of tobacco products – including cigarettes, electronic cigarettes, cigars, nicotine pouches, and smokeless tobacco – helps policy makers determine how to allocate prevention resources more effectively. Effective strategies to reduce youth initiation of tobacco use include federal regulation of tobacco products; comprehensive smokefree and tobacco-free policies; increasing excise taxes; restrictions on tobacco advertising and promotion; restricting the availability of tobacco products to youth; mass-media public education campaigns; and full implementation of comprehensive state and community tobacco control programs. On December 20, 2019, legislation was enacted to amend the Federal Food, Drug, and Cosmetic Act and raise the federal minimum age of sale of tobacco products from 18 to 21 years.
Measure
The percentage of individuals among those aged 12 to 25 years who said they had initiated use of any of these tobacco products during the past 12 months.
The percentage of individuals among those aged 12 to 25 years who said they had initiated cigarette smoking during the past 12 months.
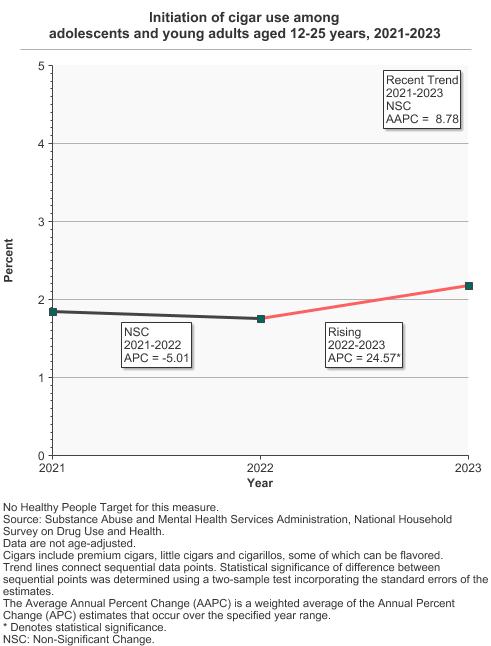
The percentage of individuals among those aged 12 to 25 years who said they had initiated cigar smoking during the past 12 months.
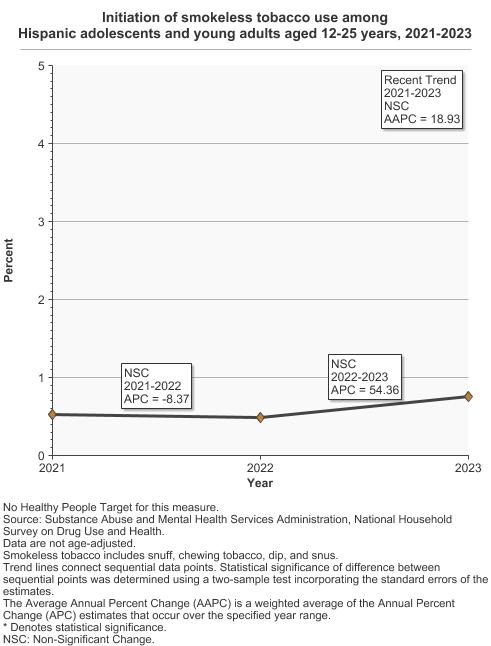
The percentage of individuals among those aged 12 to 25 years who said they had initiated smokeless tobacco use during the past 12 months.
The percentage of individuals among those aged 12 to 25 years who said they had initiated use of a nicotine vaping device during the past 12 months.
Note: Initiation measures included a numerator of the number of adolescents and young adults aged 12 to 25 years who used the specified tobacco product for the first time in the past 12 months and a denominator of the number of adolescents and young adults aged 12 to 25 years who did not use the specified tobacco product in their lifetime or who used the specified tobacco product for the first time in the past 12 months.
Note: Cigars include premium cigars, little cigars, and cigarillos. Nicotine vaping devices include e-cigarettes and other devices used to vape nicotine.
Data Source
Substance Abuse and Mental Health Services Administration, National Household Survey on Drug Use and Health, 2021-2023.
Note: This report includes available data points from 2021 to 2022. NSDUH, like many surveys, experienced significant challenges and changes during the 2020 fielding. The COVID-19 pandemic interrupted data collection in mid-March, and the survey did not resume until September of 2020. In the interim, many aspects of daily life were drastically altered, and these may have affected substance use behaviors. Beginning in October of 2020, data collection became almost entirely web-based, with very few in-person interviews. Overall response rates, and particularly youth interview response rates, dropped, and many interviews were not completed. As a result, 2020 data may not be internally consistent (i.e., Q1 to Q4) or comparable with previous survey years. During the 2021 fielding, data collection remained multimodal, with responses collected either in person or online. Estimates differed significantly based on the mode of data collection, diminishing the comparability of the 2021 survey to previous years. Therefore, data points prior to 2021 are not included in this report.
Healthy People 2030 Target
- Eliminate the initiation of the use of cigarettes among adolescents and young adults.
Healthy People 2030 is a set of goals set forth by the Department of Health and Human Services.
Note: Goals are indicated as blue line on Detailed Trend Graphs.
Trends and Most Recent Estimates
- By Type of Tobacco Product
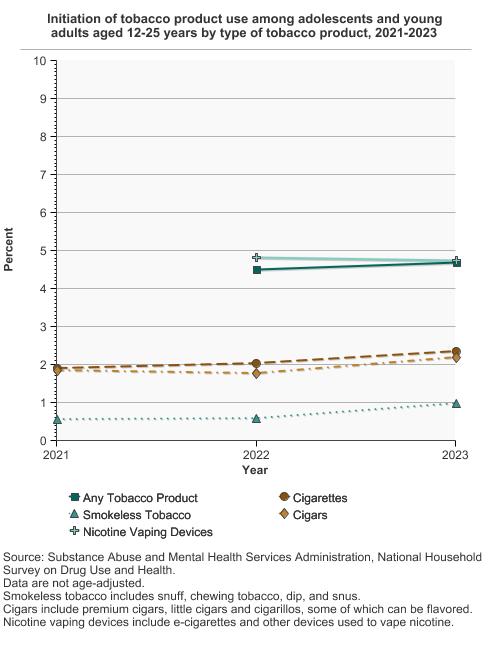
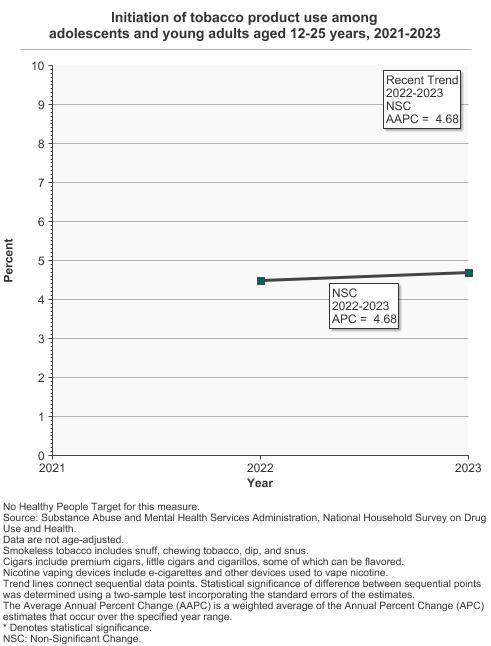
Initiation of tobacco product use among adolescents and young adults aged 12-25 years by type of tobacco product, 2021-2023 Overview Graph Detailed Trend Graphs Most Recent Estimates (2023) Percent 95% Confidence Interval 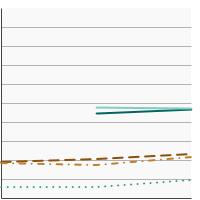

Any Tobacco Product 
4.7 4.3 - 5.1 Cigarettes 2.3 2.1 - 2.6 Smokeless Tobacco 1.0 0.8 - 1.2 Cigars 2.2 1.9 - 2.5 Nicotine Vaping Devices 4.7 4.4 - 5.1 - Any Tobacco Product
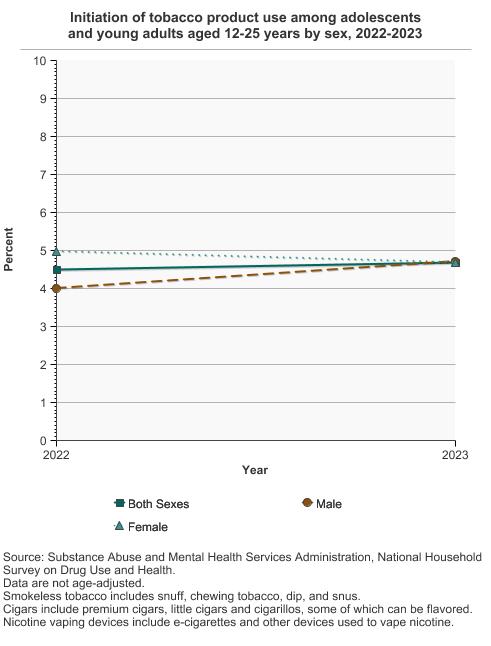
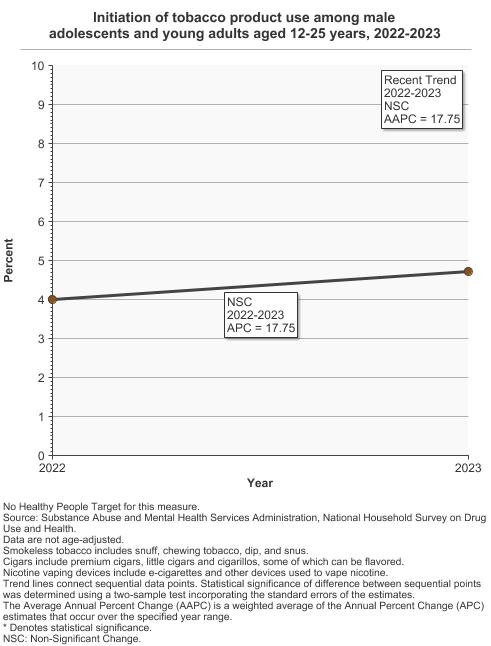
- By Sex
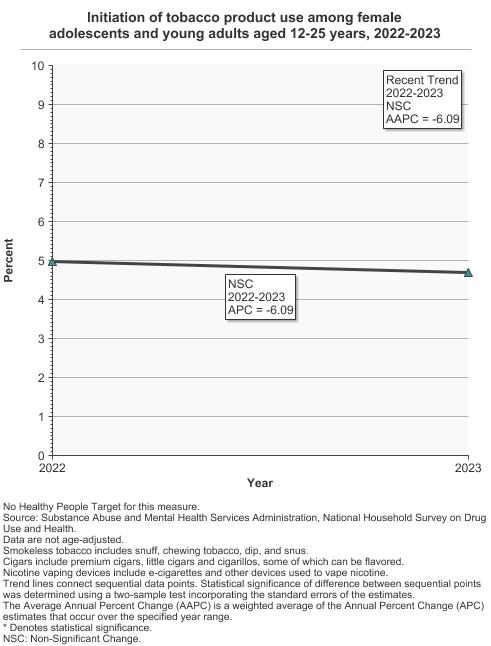
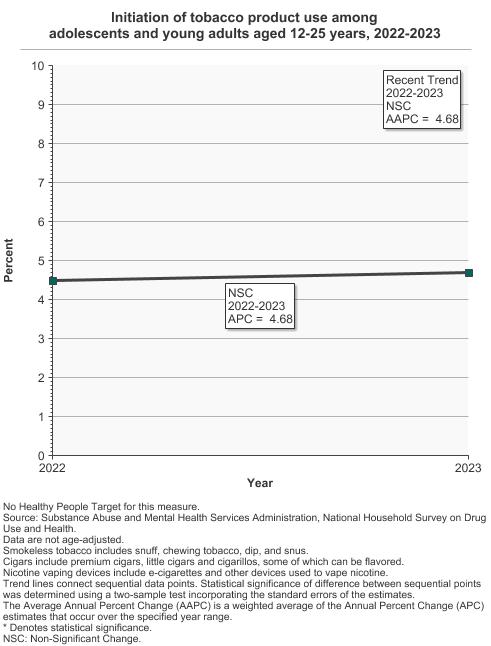
Initiation of tobacco product use among adolescents and young adults aged 12-25 years by sex, 2022-2023 Overview Graph Detailed Trend Graphs Most Recent Estimates (2023) Percent 95% Confidence Interval 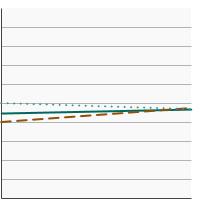
Both Sexes 4.7 4.3 - 5.1 Male 4.7 4.2 - 5.3 Female 4.7 4.2 - 5.3 - By Race/Ethnicity
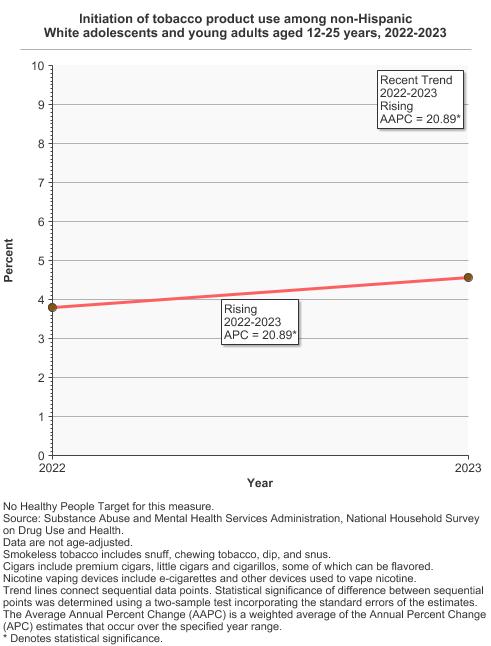
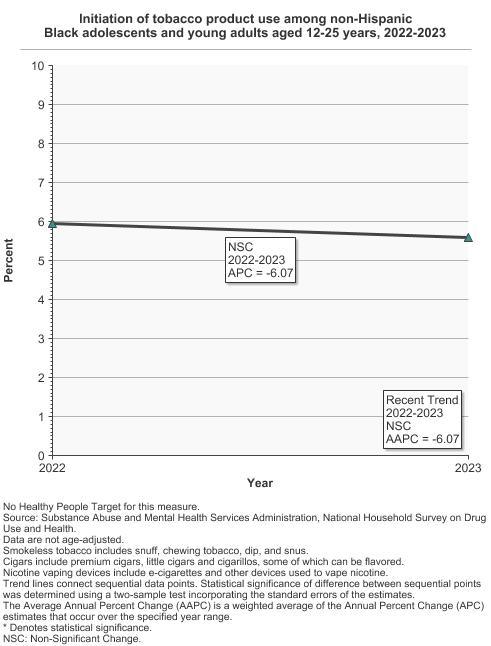
Initiation of tobacco product use among adolescents and young adults aged 12-25 years by race/ethnicity, 2022-2023 Overview Graph Detailed Trend Graphs Most Recent Estimates (2023) Percent 95% Confidence Interval 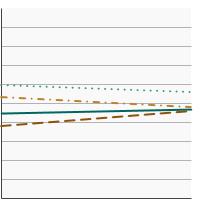
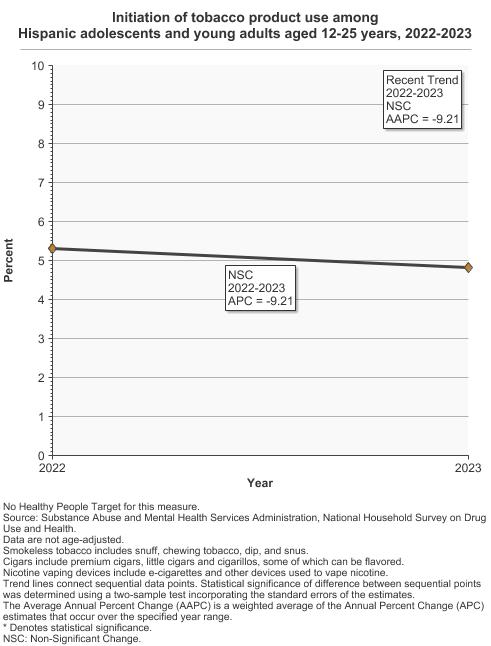
All Races 4.7 4.3 - 5.1 Non-Hispanic White 4.6 4.1 - 5.2 Non-Hispanic Black 5.6 4.6 - 6.7 Hispanic 4.8 4.0 - 5.8
- Cigarettes
- By Sex
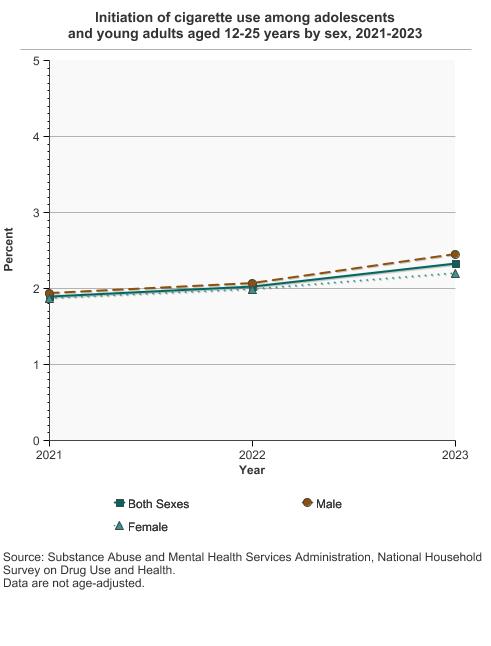
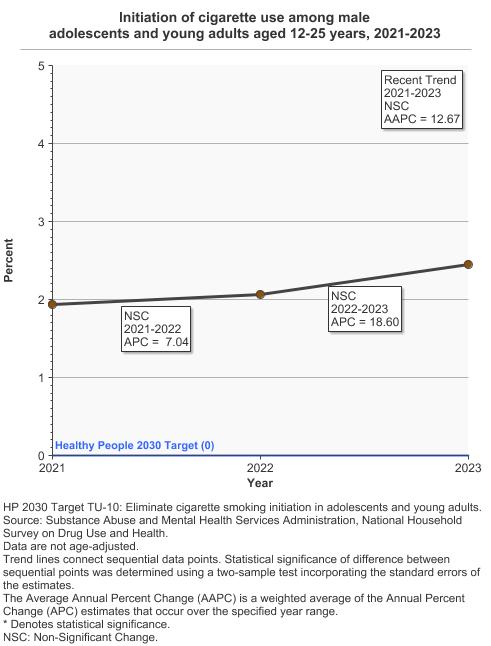
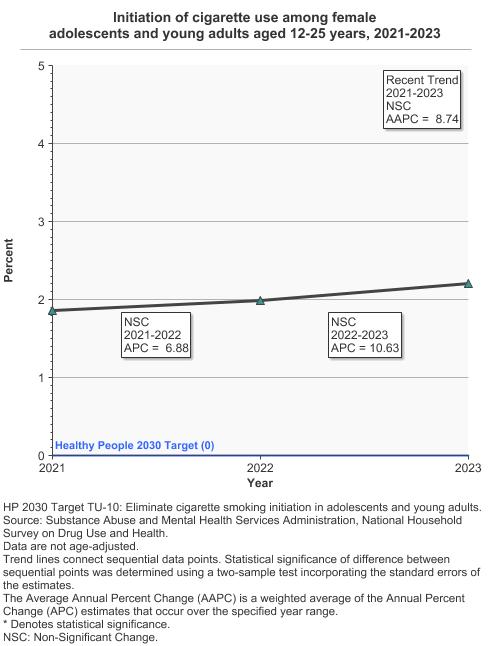
Initiation of cigarette use among adolescents and young adults aged 12-25 years by sex, 2021-2023 Overview Graph Detailed Trend Graphs Most Recent Estimates (2023) Percent 95% Confidence Interval 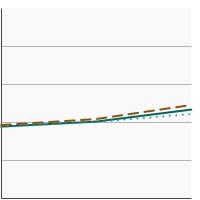
Both Sexes 2.3 2.1 - 2.6 Male 2.5 2.1 - 2.9 Female 2.2 1.8 - 2.6 - By Race/Ethnicity
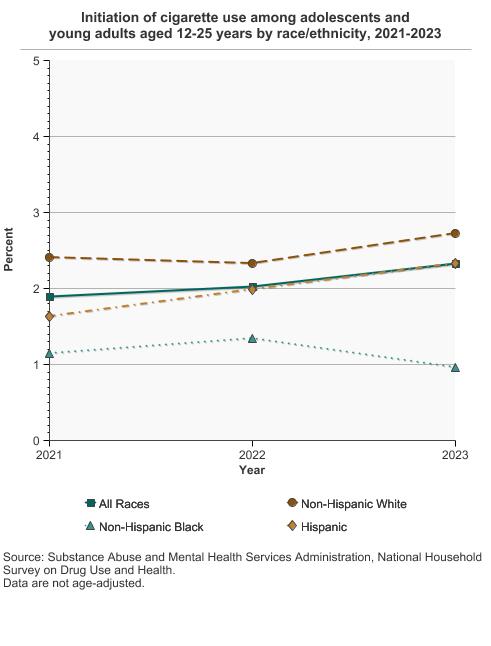
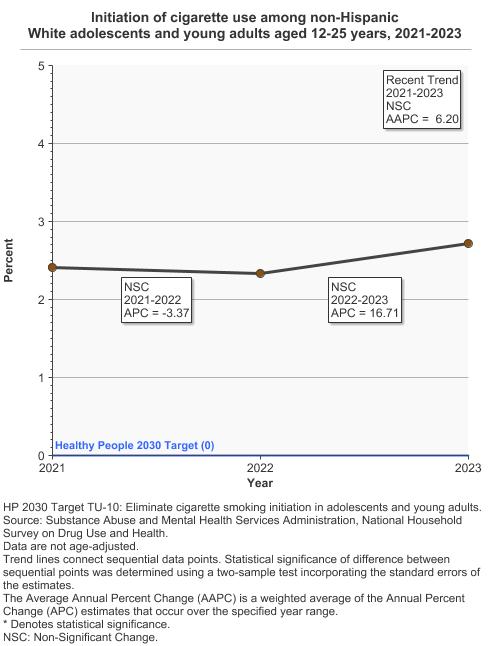
Initiation of cigarette use among adolescents and young adults aged 12-25 years by race/ethnicity, 2021-2023 Overview Graph Detailed Trend Graphs Most Recent Estimates (2023) Percent 95% Confidence Interval 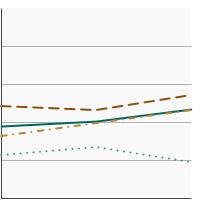
All Races 2.3 2.1 - 2.6 Non-Hispanic White 2.7 2.3 - 3.2 Non-Hispanic Black 1.0 0.6 - 1.5 Hispanic 2.3 1.7 - 3.1
- Smokeless Tobacco
- By Sex
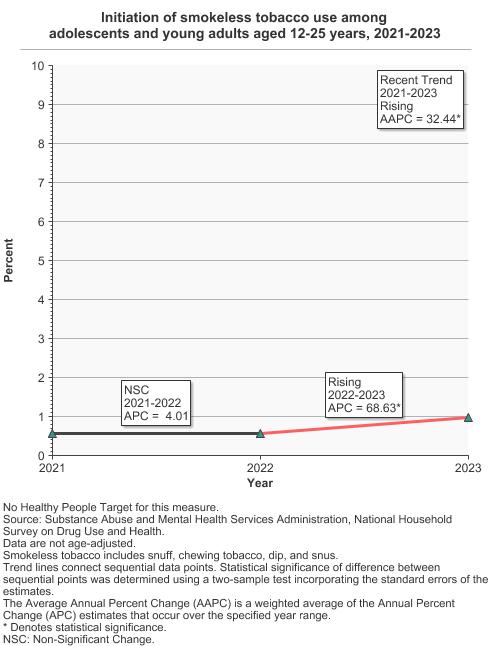
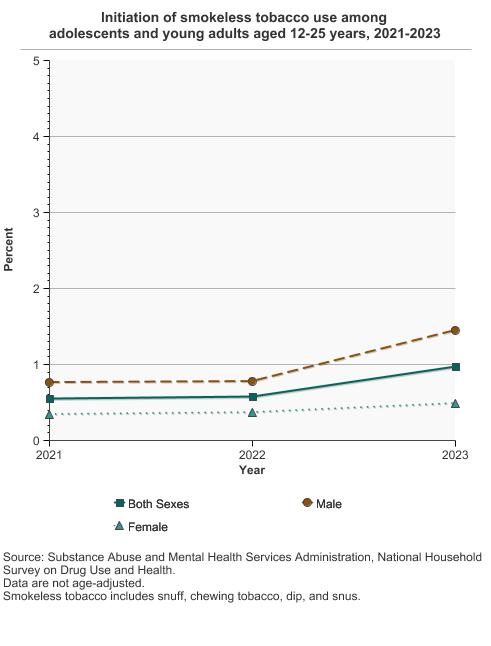
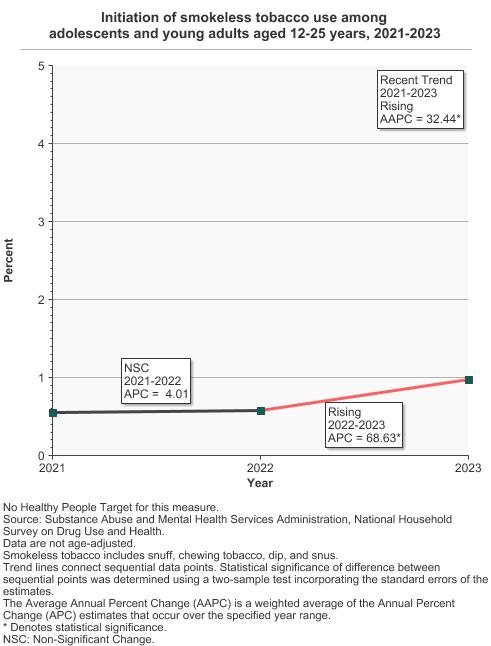
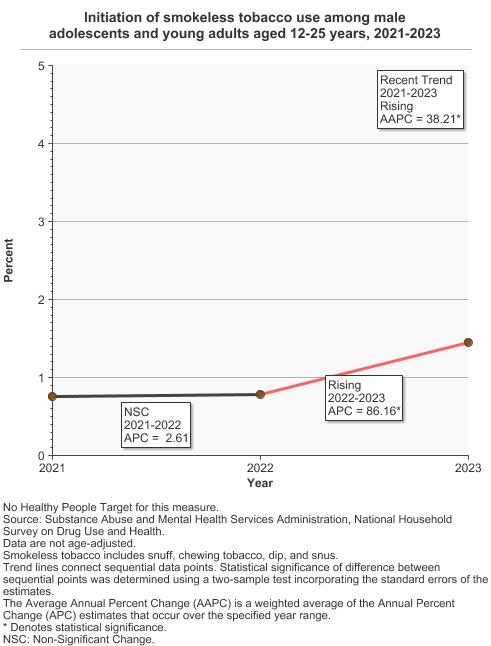
Initiation of smokeless tobacco use among adolescents and young adults aged 12-25 years, 2021-2023 Overview Graph Detailed Trend Graphs Most Recent Estimates (2023) Percent 95% Confidence Interval 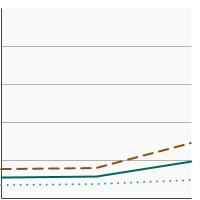
Both Sexes 1.0 0.8 - 1.2 Male 1.4 1.1 - 1.9 Female 0.5 0.3 - 0.7 - By Race/Ethnicity
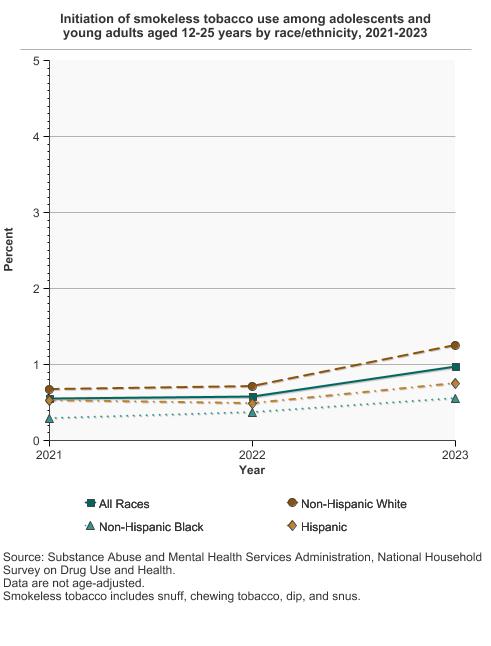
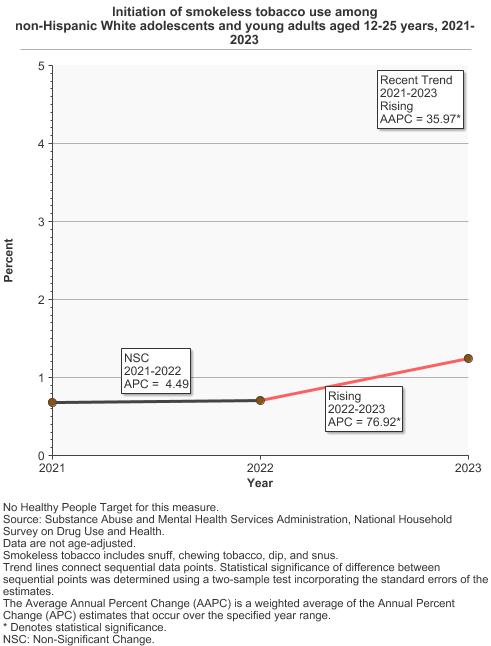
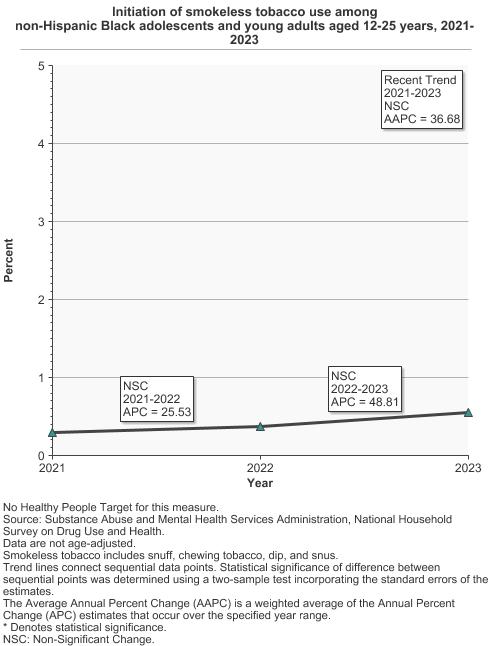
Initiation of smokeless tobacco use among adolescents and young adults aged 12-25 years by race/ethnicity, 2021-2023 Overview Graph Detailed Trend Graphs Most Recent Estimates (2023) Percent 95% Confidence Interval 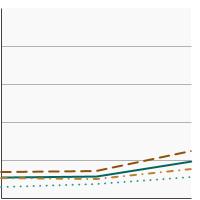
All Races 1.0 0.8 - 1.2 Non-Hispanic White 1.2 0.9 - 1.7 Non-Hispanic Black 0.6 0.3 - 1.1 Hispanic 0.8 0.5 - 1.2
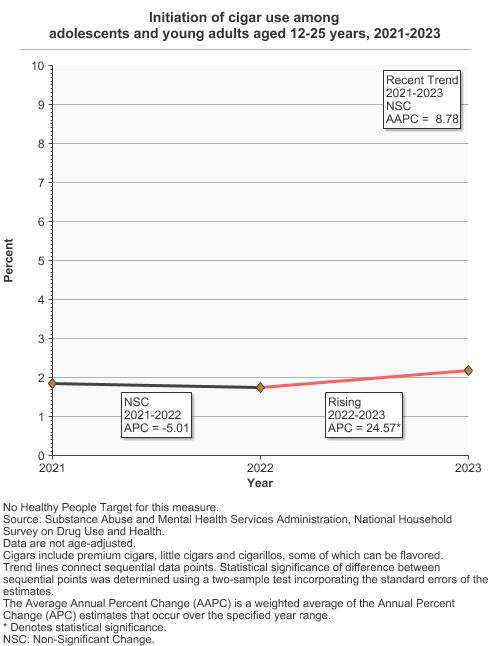
- Cigars
- By Sex
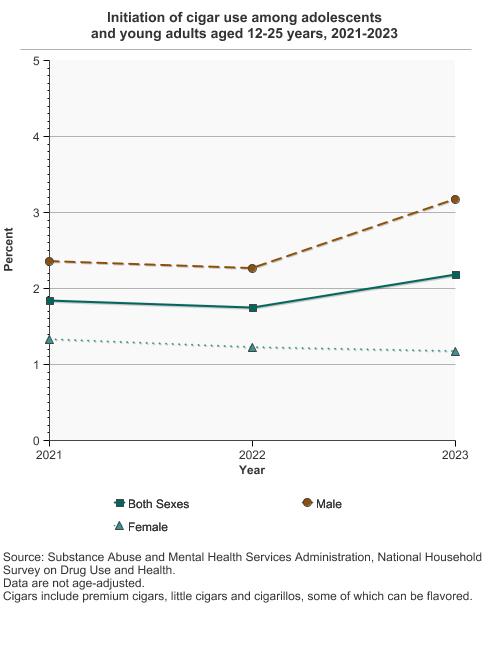
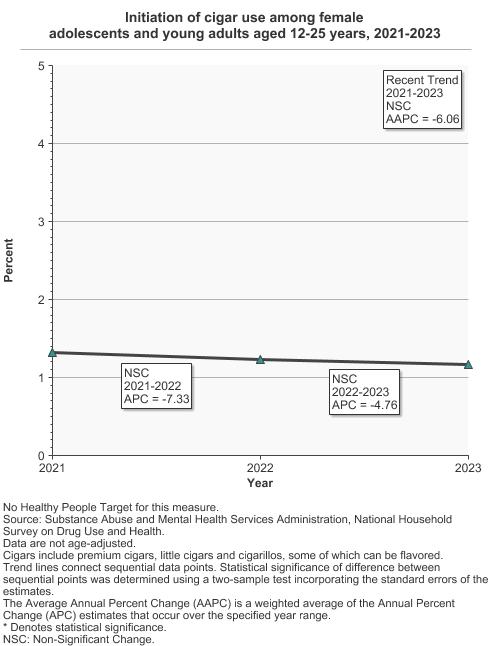
Initiation of cigar use among adolescents and young adults aged 12-25 years, 2021-2023 Overview Graph Detailed Trend Graphs Most Recent Estimates (2023) Percent 95% Confidence Interval 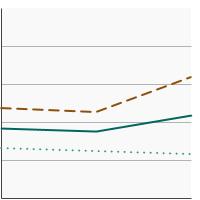
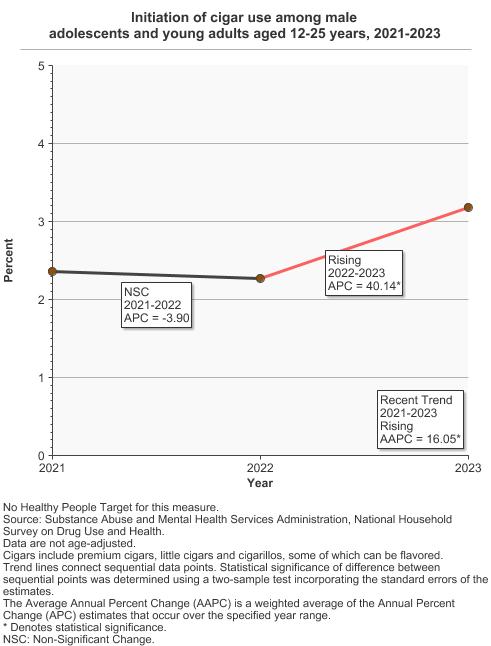
Both Sexes 2.2 1.9 - 2.5 Male 3.2 2.7 - 3.7 Female 1.2 0.9 - 1.5 - By Race/Ethnicity
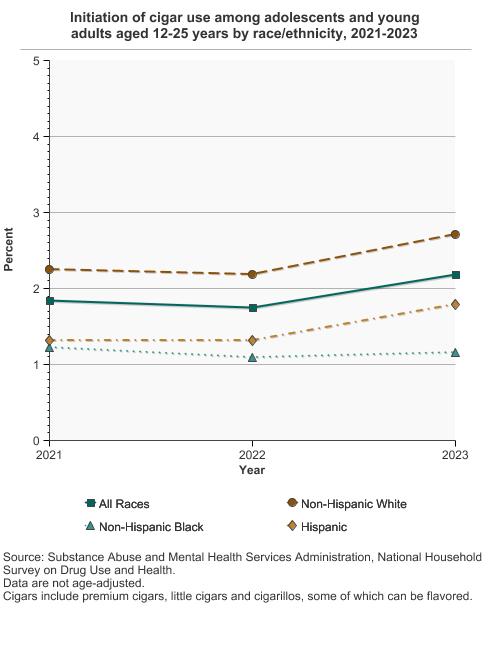
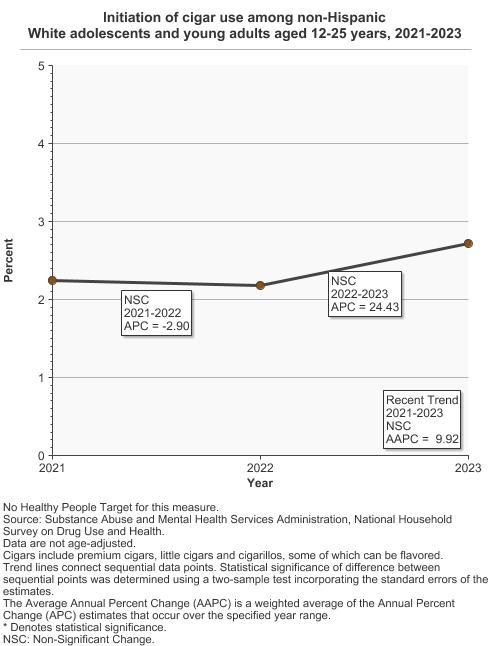
Initiation of cigar use among adolescents and young adults aged 12-25 years by race/ethnicity, 2021-2023 Overview Graph Detailed Trend Graphs Most Recent Estimates (2023) Percent 95% Confidence Interval 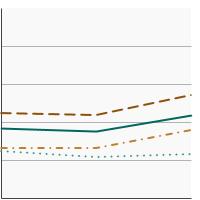
All Races 2.2 1.9 - 2.5 Non-Hispanic White 2.7 2.3 - 3.2 Non-Hispanic Black 1.2 0.8 - 1.7 Hispanic 1.8 1.3 - 2.4
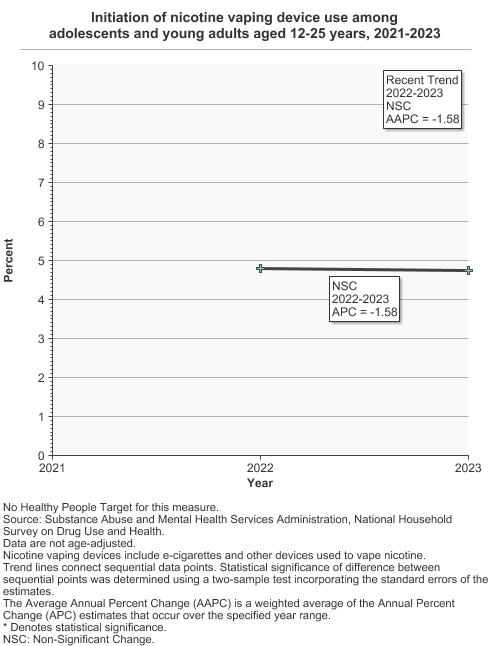
- Nicotine Vaping Devices
- By Sex
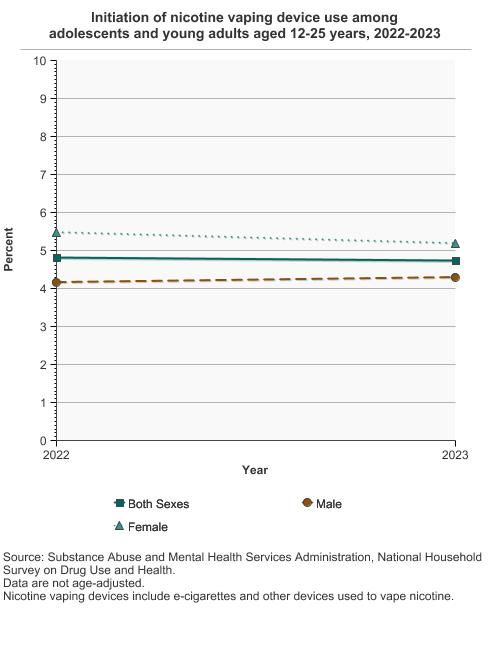
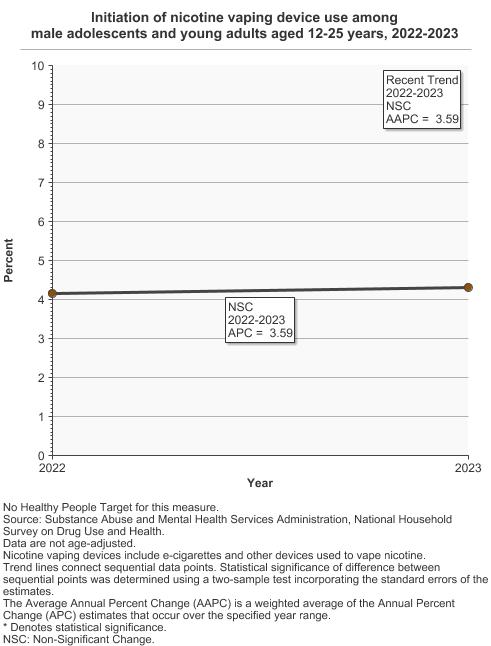
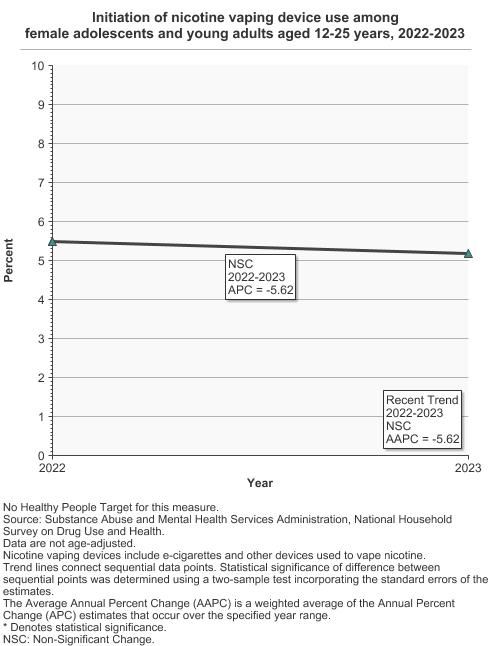
Initiation of nicotine vaping device use among adolescents and young adults aged 12-25 years, 2022-2023 Overview Graph Detailed Trend Graphs Most Recent Estimates (2023) Percent 95% Confidence Interval 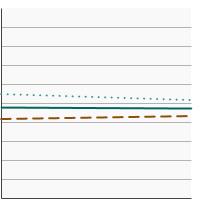
Both Sexes 4.7 4.4 - 5.1 Male 4.3 3.8 - 4.8 Female 5.2 4.6 - 5.8 - By Race/Ethnicity
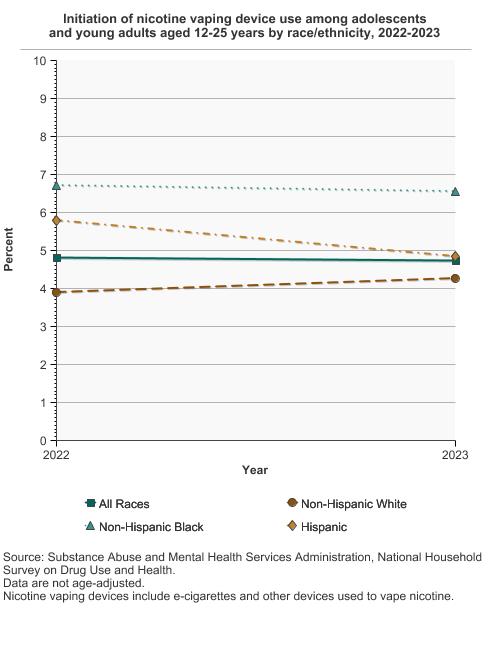
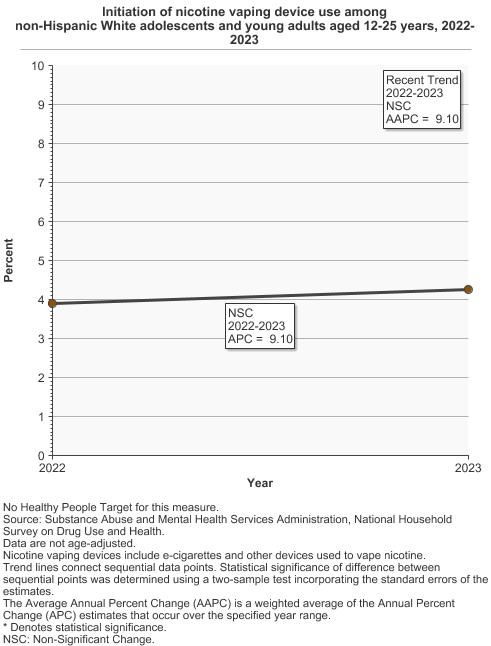
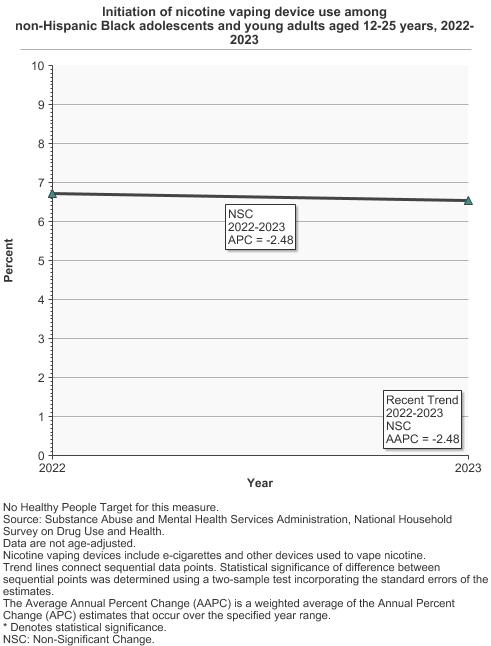
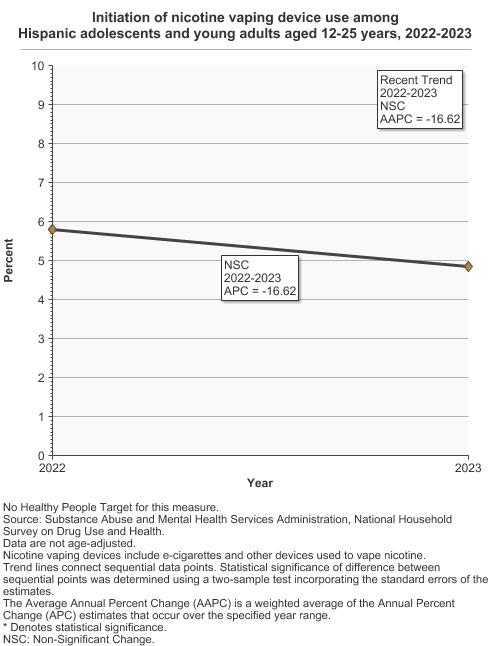
Initiation of nicotine vaping device use among adolescents and young adults aged 12-25 years by race/ethnicity, 2022-2023 Overview Graph Detailed Trend Graphs Most Recent Estimates (2023) Percent 95% Confidence Interval 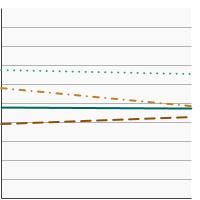
All Races 4.7 4.4 - 5.1 Non-Hispanic White 4.3 3.8 - 4.8 Non-Hispanic Black 6.5 5.5 - 7.7 Hispanic 4.8 4.1 - 5.7
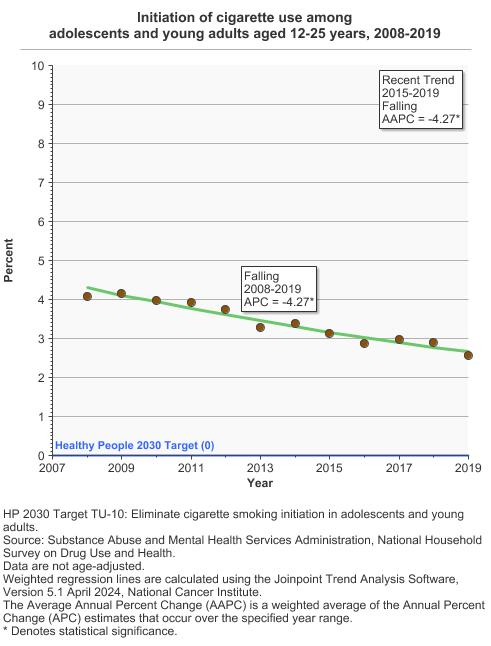
- Previous Trends, 2008-2019
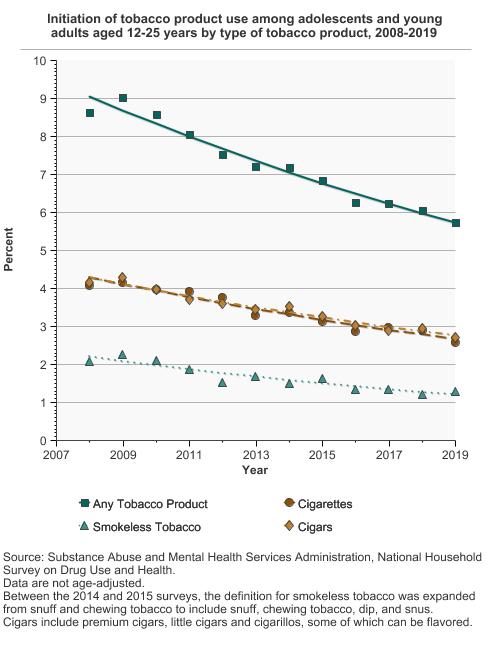
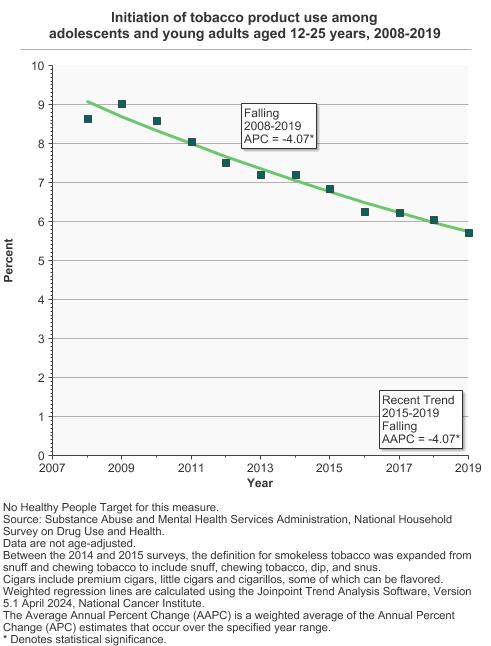
Initiation of tobacco product use among adolescents and young adults aged 12-25 years by type of tobacco product, 2008-2019 Overview Graph Detailed Trend Graphs Most Recent Estimates (2019) Percent 95% Confidence Interval 
Any Tobacco Product 5.7 5.4 - 6.1 Cigarettes 2.6 2.3 - 2.8 Smokeless Tobacco 1.3 1.1 - 1.5 Cigars 2.7 2.5 - 3.0


Additional Information
- Tobacco. National Cancer Institute.
- Consumer Guide: Let’s Make the Next Generation Tobacco-Free. U.S. Department of Health and Human Services.
- Tobacco and Cancer. American Cancer Society.
- Youth and Tobacco Use. Centers for Disease Control and Prevention.
- Youth and Tobacco. U.S. Food and Drug Administration.
- Smoking and Tobacco Control Monograph 21: The Economics of Tobacco and Tobacco Control. National Cancer Institute.
- Tobacco Control Evidence-Based Programs Listing. National Cancer Institute.
- Julius B. Richmond Center. American Academy of Pediatrics.
- 2016 Surgeon General’s Report – E-Cigarette Use Among Youth and Young Adults. Centers for Disease Control and Prevention.
- 2014 Surgeon General’s Report - The Health Consequences of Smoking: 50 Years of Progress. Centers for Disease Control and Prevention.
- 2012 Surgeon General’s Report—Preventing Tobacco Use Among Youth and Young Adults. Centers for Disease Control and Prevention.
- Prevention and Cessation of Tobacco Use in Children and Adolescents: Primary Care Interventions. U.S. Preventive Services Task Force.
- Trends in the Age of Cigarette Smoking Initiation Among Young Adults in the U.S. From 2002 to 2018. Barrington-Trimis JL, Braymiller JL, Unger JB, McConnell R, Stokes A, et al. JAMA Netw Open. 2020;3(10):e2019022.
- Tobacco Product Use Among Middle and High School Students — National Youth Tobacco Survey, United States, 2024. Jamal A, Park-Lee E, Birdsey J, et al. MMWR. 2024;73(41):917-924.
- Correlates of tobacco product initiation among youth and young adults between waves 1-4 of the population assessment of tobacco and Health (PATH) study (2013-2018). Cooper M, Day HR, Ren C, et al. Addict Behav. 2022;134:107396.
- Prospective predictors of electronic nicotine delivery system initiation in tobacco naive young adults: A machine learning approach. Atuegwu NC, Mortensen EM, Krishnan-Sarin S, Laubenbacher RC, Litt MD. Prev Med Rep. 2023;32:102148.
- Age of initiation of cigarillos, filtered cigars and/or traditional cigars among youth: Findings from the Population Assessment of Tobacco and Health (PATH) study, 2013-2017. Chen B, Sterling KL, Bluestein MA, Kuk AE, Harrell MB, et al. PLoS One. 2020;15(12):e0243372.
- Vital Signs: Tobacco Product Use Among Middle and High School Students – United States, 2011-2018. Gentzke AS, Creamer M, Cullen KA, et al. MMWR. 2019; 68(6):157-164.