On This Page:
- Background
- Measure
- Healthy People 2030 Target
- Data Source
- Trends and Most Recent Estimates
- Related Cancers
- Additional Information

Background
Cigarette smoking is the leading preventable cause of disease and death in the United States. Smoking causes cancers of the lung, esophagus, larynx (voice box), mouth, throat, kidney, bladder, liver, pancreas, stomach, cervix, colon and rectum, as well as acute myeloid leukemia. Tobacco use is initiated and established primarily during adolescence (defined as ages 10-19): nearly 90 percent of adults in the U.S. who smoke daily first tried cigarettes by age 18, and 98 percent first tried cigarettes by age 26. Each day in the U.S., around 1,500 youth aged 17 or younger smoke their first cigarette.
Electronic cigarettes (e-cigarettes, also known as vapes or Electronic Nicotine Delivery Systems [ENDS]) are battery-powered devices that convert a liquid, often called e-liquid, into an aerosol. E-liquids typically contain nicotine, flavorings, vegetable glycerin, propylene glycol, and other chemicals. In addition to nicotine, e-cigarette aerosol may contain heavy metals, volatile organic compounds, and fine and ultrafine particles that can be inhaled deeply into the lungs by both users and bystanders. Nicotine use among youth increases the risk of lifelong tobacco addiction and may also increase the risk for future addiction to other drugs.
Youth cigarette smoking prevalence peaked around 1996/1997 but has been declining since. However, a substantial portion of youth use other tobacco products, including e-cigarettes, cigars, smokeless tobacco, nicotine pouches, and hookah/waterpipes. According to data from the 2024 National Youth Tobacco Survey (NYTS), 2.25 million (8.1%) middle and high school students reported current use of a tobacco product. Among youth who report any tobacco product use, use of more than one product (dual or polyuse) is common (36.6% of high school students who reported using tobacco and 38.9% of middle school students who reported using tobacco).
In 2014, e-cigarettes became the most commonly used tobacco product among youth, and, in 2018, former U.S. Surgeon General Jerome Adams issued an advisory declaring youth e-cigarette use an epidemic. At the time that the advisory was issued, according to data from the NYTS, the prevalence of e-cigarette use among high school students was 20.8%, and the prevalence of e-cigarette use among middle school students was 4.9%. In 2024, 7.8% of high school students and 3.5% of middle school students, currently used e-cigarettes. Moreover, in 2024, among high school students who reported current e-cigarette use, 38.4% reported using the products frequently (on 20 or more of the past 30 days) and 26.3% reported daily use. The most commonly used e-cigarette device type was disposable (55.6%). Flavors are an important aspect of appeal to middle and high school students who use e-cigarettes, with 87.6% reporting having used flavored e-cigarettes (e.g., fruit, candy, mint flavors) in 2024.
There are many factors associated with youth tobacco use, including social, environmental, cognitive, and genetic influences. In addition, Preventing Tobacco Use Among Youth and Young Adults: A Report of the Surgeon General, published by the Centers for Disease Control and Prevention in 2012, concluded that tobacco advertising, promotion, and depictions of smoking in movies are causally related to youth tobacco use. Initiation of smoking during adolescence is linked to persistent smoking during adult life and the many adverse health effects caused by smoking.
Understanding trends in youth initiation and use of tobacco products – including cigarettes, e-cigarettes, cigars, smokeless tobacco, and nicotine pouches – helps policy makers determine how to allocate prevention resources. Effective strategies to reduce youth initiation of tobacco use include federal regulation of tobacco products; comprehensive smokefree and tobacco-free policies; increasing excise taxes; restrictions on tobacco advertising and promotion; restricting the availability of tobacco products to youth; mass-media public education campaigns; and full implementation of comprehensive state and community tobacco control programs. On December 20, 2019, legislation was enacted to amend the Federal Food, Drug, and Cosmetic Act and raise the federal minimum age of sale of tobacco products from 18 to 21 years.
Measure
The percentage of middle and high school students (grades 6–12) who reported use of cigarettes, cigars, smokeless tobacco (chewing tobacco, snuff, dip, or snus), or e-cigarettes on at least 1 day during the 30 days before the survey.
The percentage of middle and high school students who reported use of any tobacco product (cigarettes, e-cigarettes, cigars, smokeless tobacco—including chewing tobacco, snuff, or dip—snus, hookah, pipe tobacco, bidis, heated tobacco products, nicotine pouches, and roll-your-own) on at least 1 day during the 30 days before the survey.1
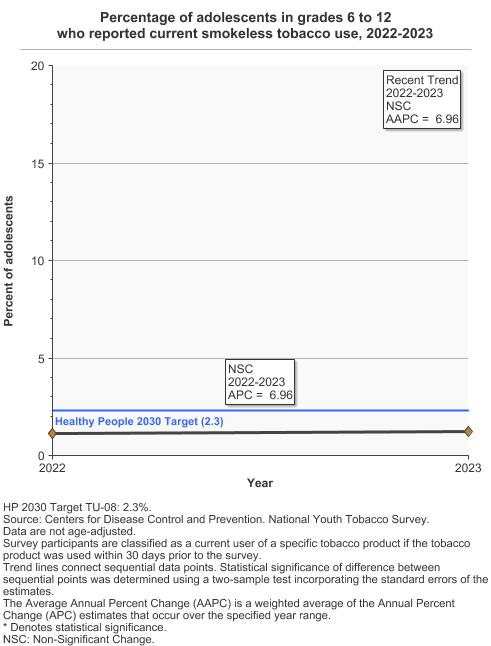
1The Healthy People 2030 target for smokeless tobacco use among middle and high school students includes chewing tobacco, snuff, dip, or snus, and dissolvables, however the National Youth Tobacco Survey no longer collects data on dissolvable tobacco use as of 2023. To facilitate comparisons across years in this report, the measure for current smokeless tobacco use will not include dissolvable tobacco.
Data Source
Centers for Disease Control and Prevention, National Youth Tobacco Survey (NYTS), 2022-2023.1
1 Between 1999 and 2018, the NYTS was conducted using paper-and-pencil questionnaires. In 2019, the mode of administration changed to an electronic survey, making prior years’ estimates incomparable.
Because NYTS is administered in schools, to accommodate students learning under varying instructional models (in-person, distance/virtual, and hybrid), the 2021 NYTS was administered using a web URL. Approximately half of respondents reported completing the survey at school or in the classroom, and half reported completing the survey at home or some other place. The proportion of students reporting any tobacco use in 2021 differed greatly between those who completed the survey at school vs. at another location. As such, this report focuses on data from 2022 and later.
Healthy People 2030 Target
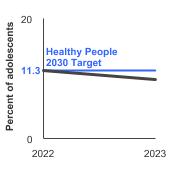
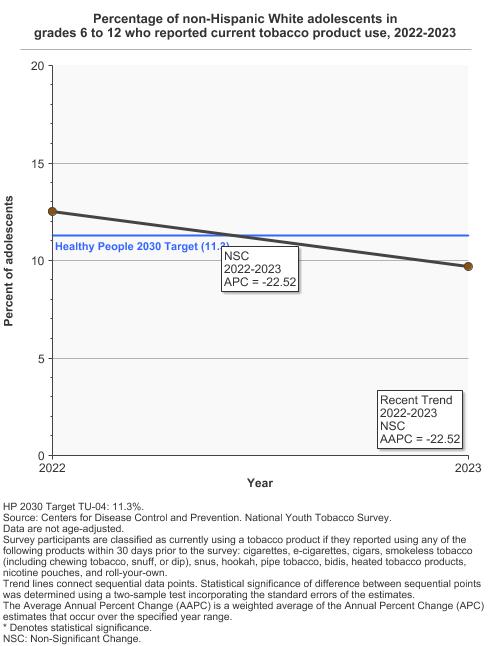
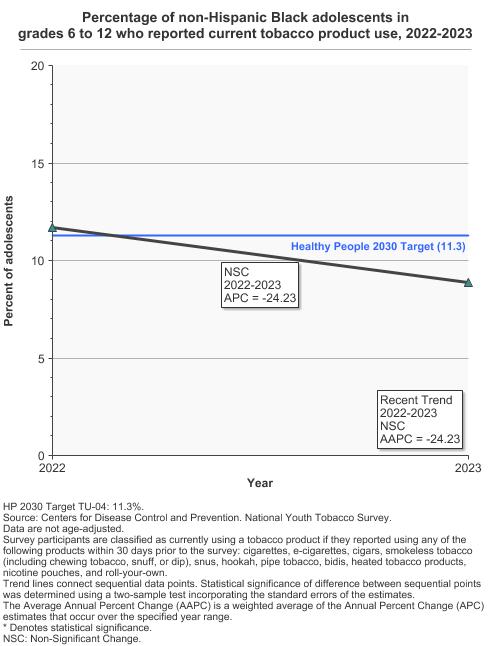
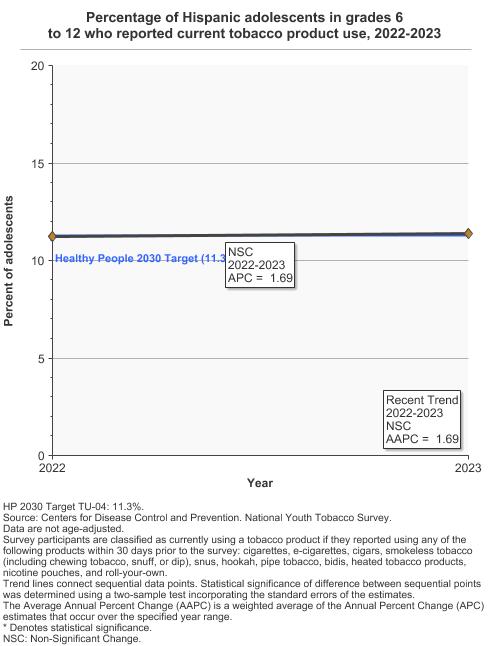
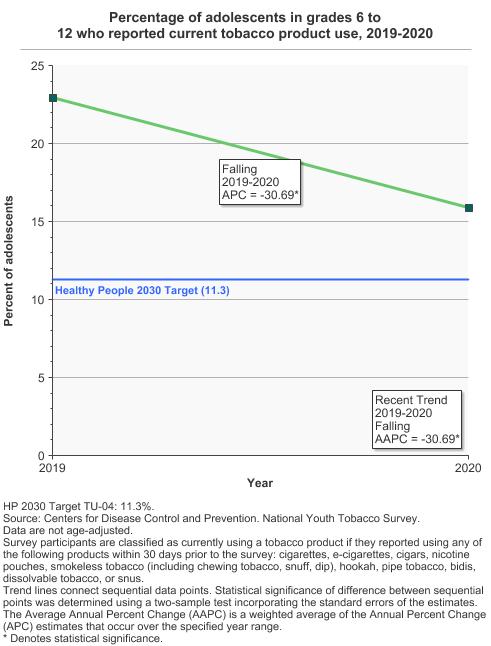
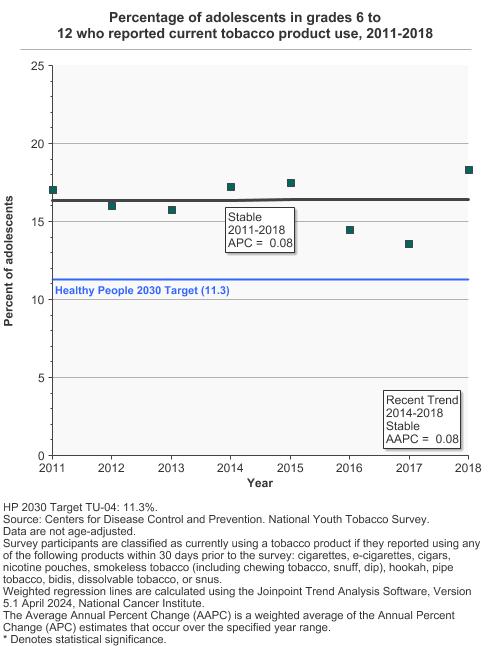
- Reduce to 11.3 percent the proportion of adolescents in grades 6–12 who used tobacco products (cigarettes, e-cigarettes, cigars, smokeless tobacco, hookah, pipe tobacco, and/or bidis) in the past 30 days.
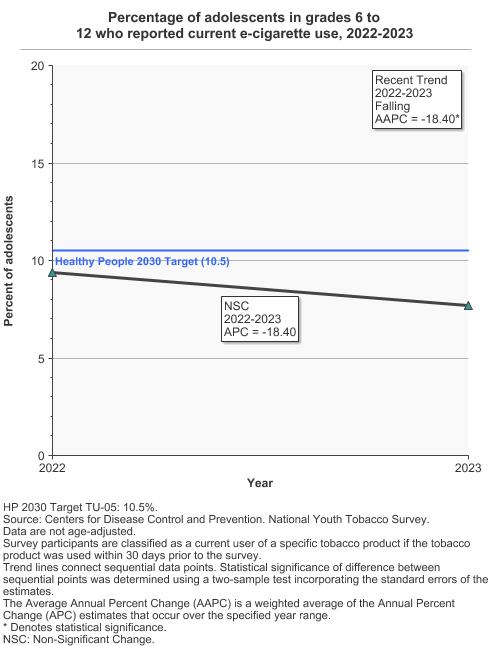
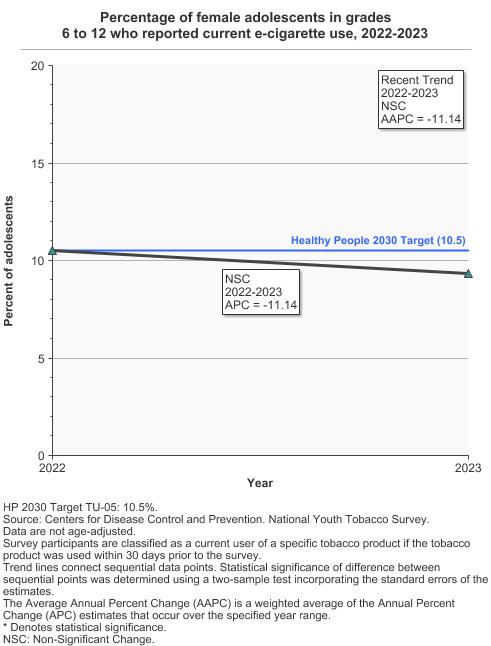
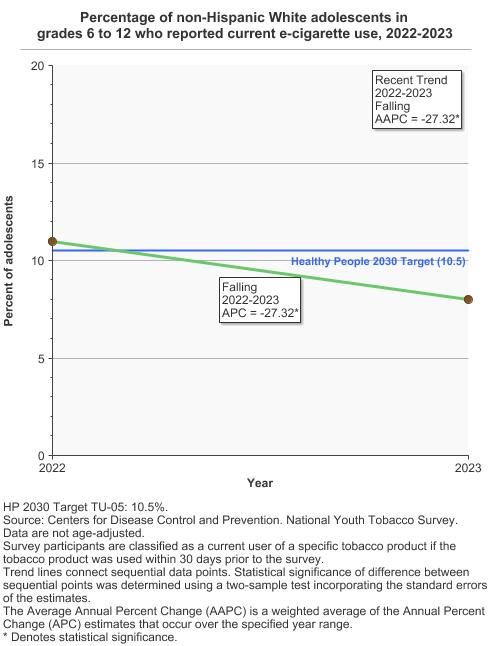
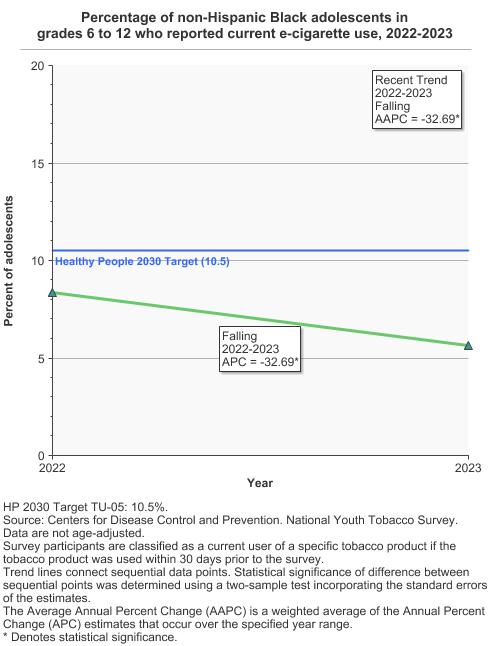
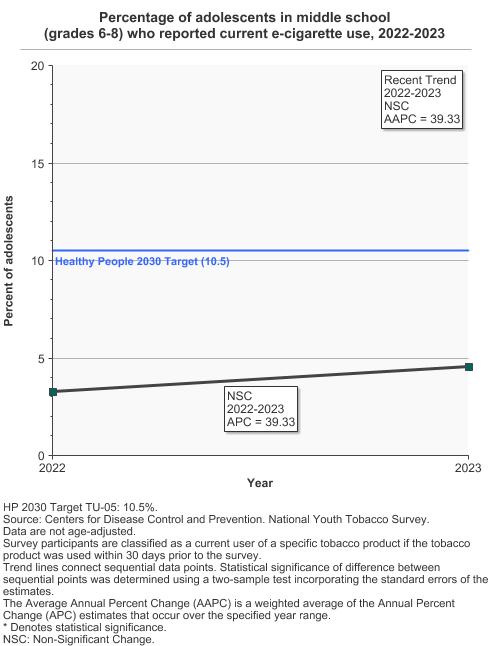
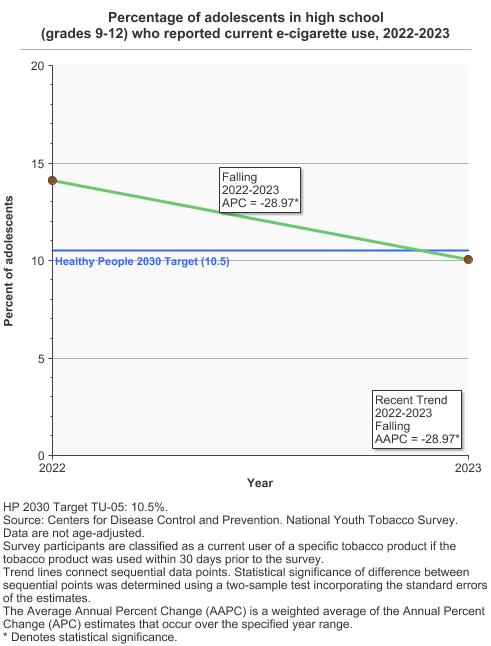
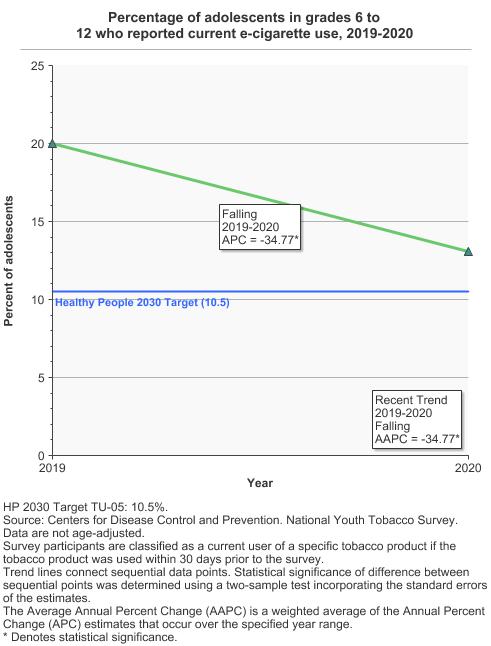
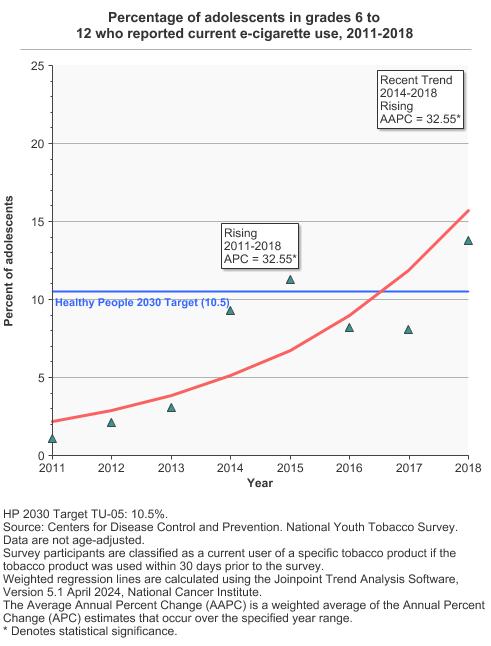
- Reduce to 10.5 percent the proportion of adolescents in grades 6-12 who used e-cigarettes in the past 30 days.
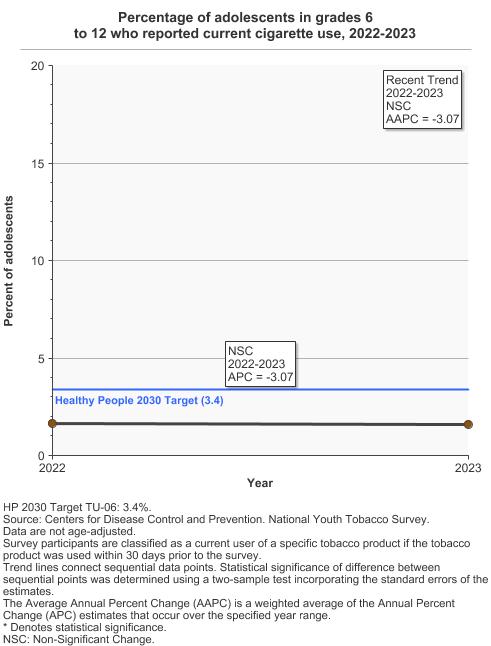
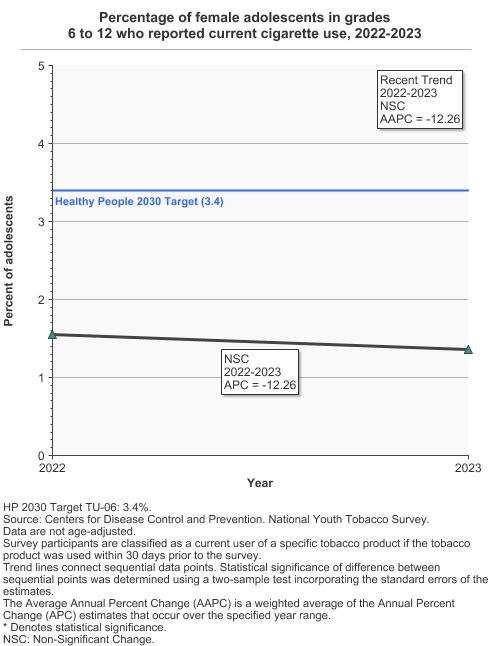
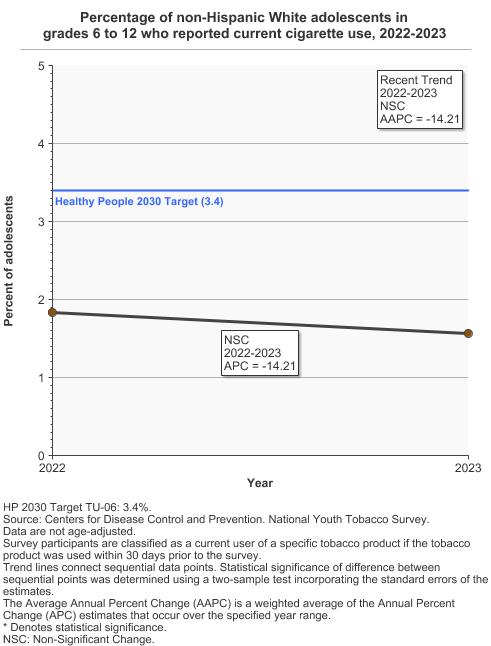
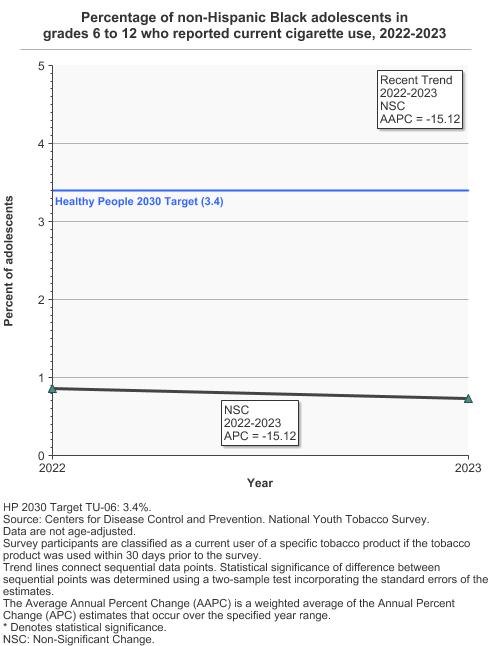
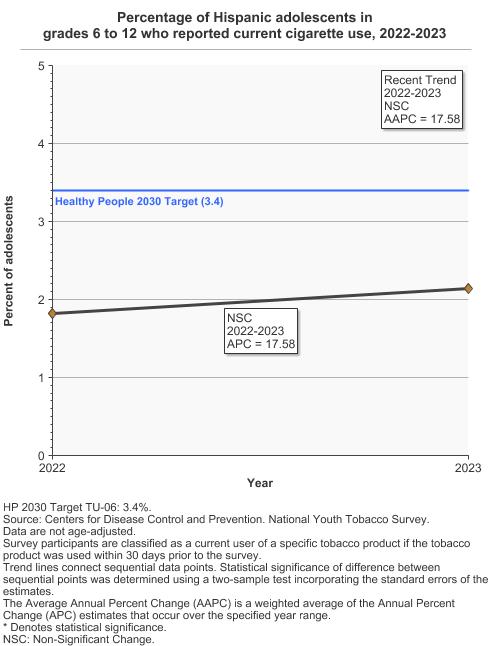
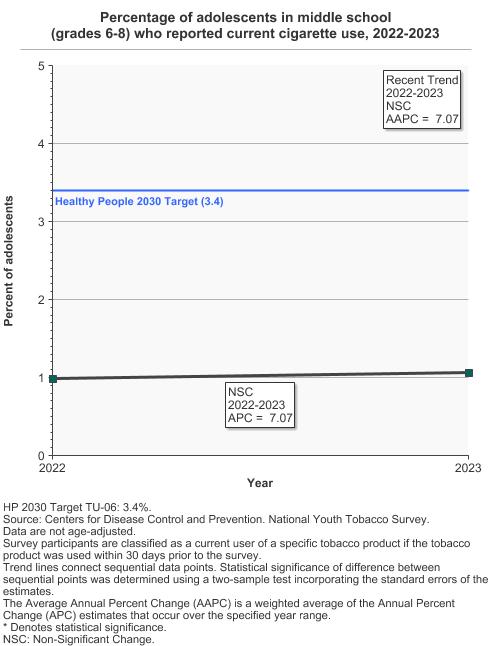
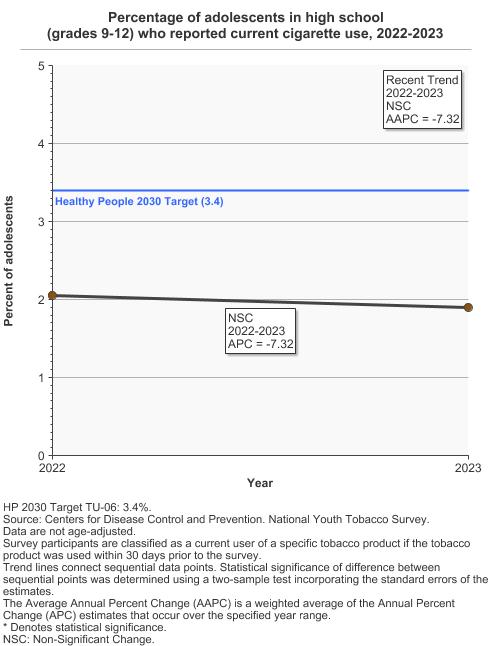
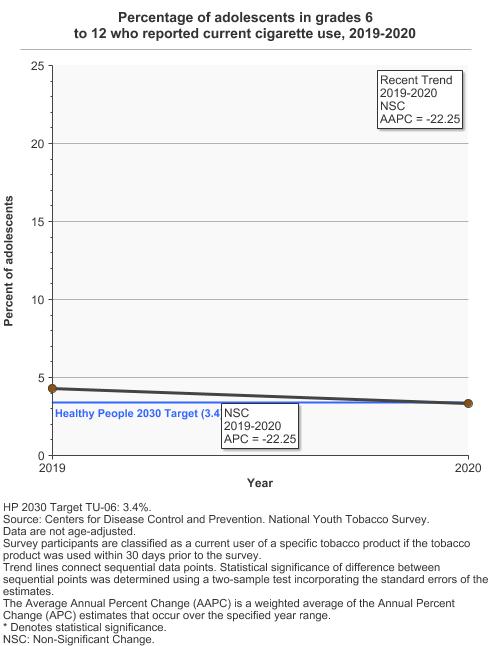
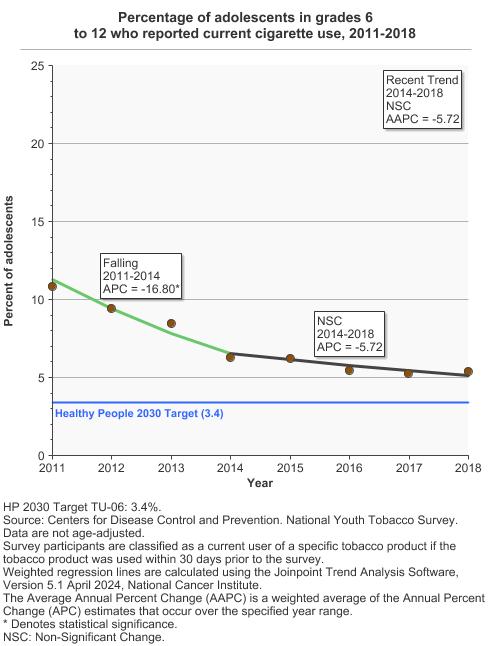
- Reduce to 3.4 percent the proportion of adolescents in grades 6–12 who smoked cigarettes in the past 30 days.
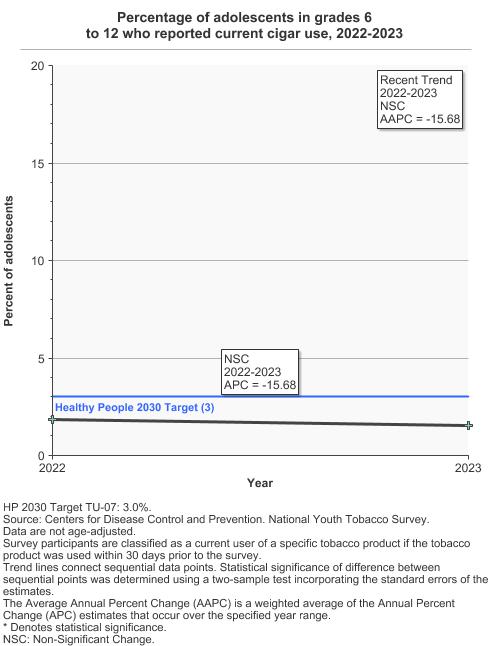
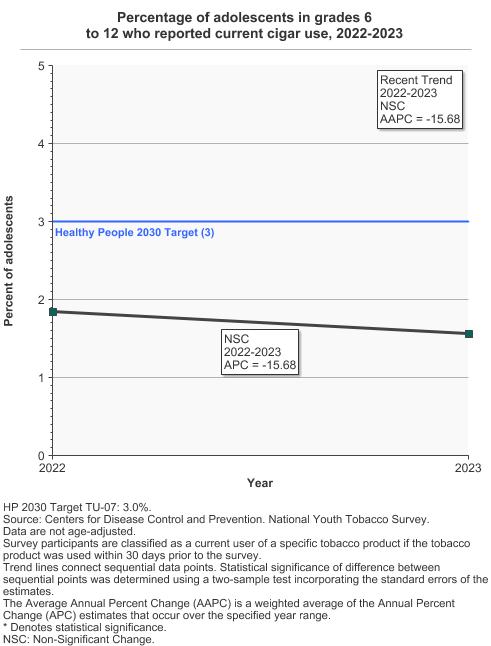
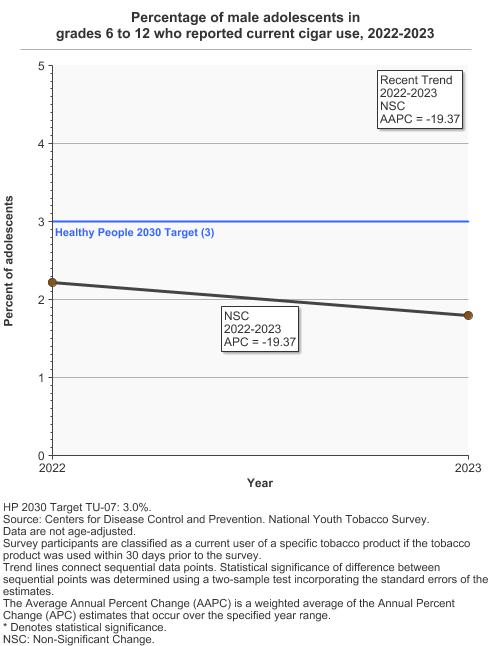
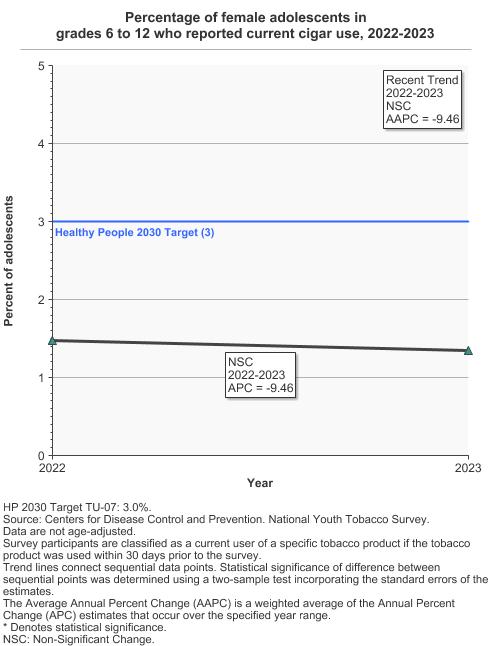
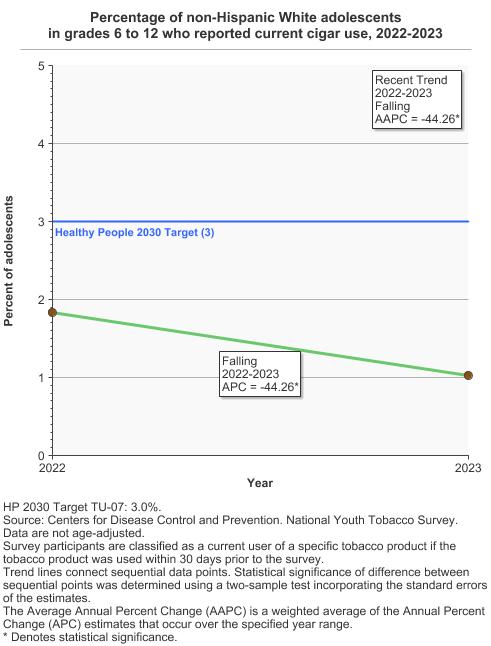
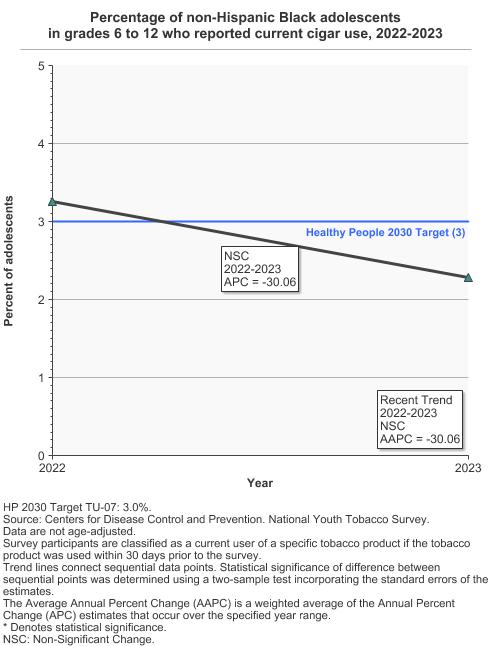
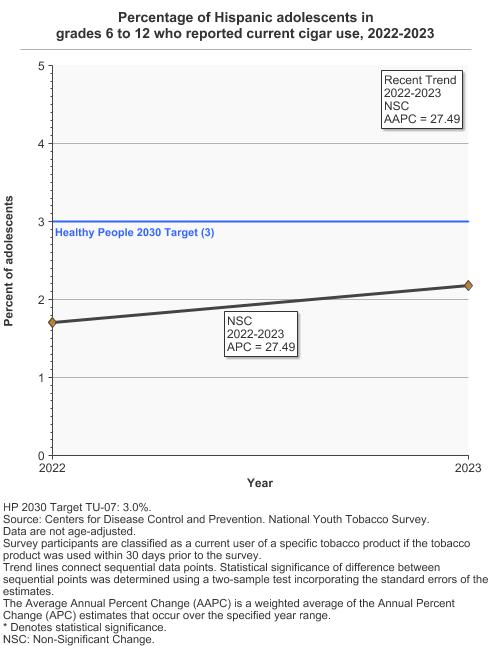
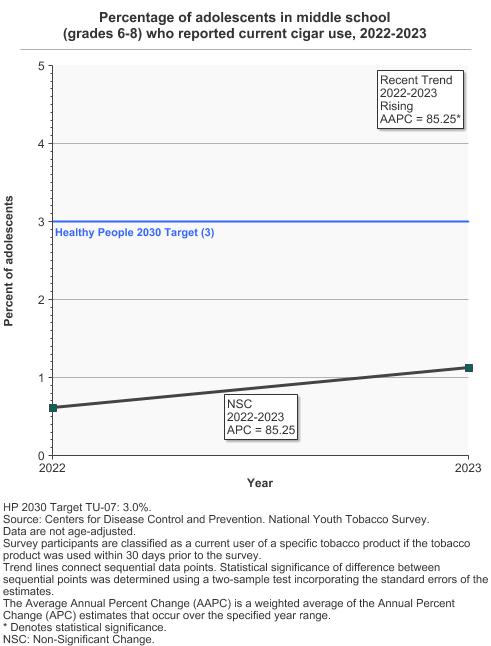
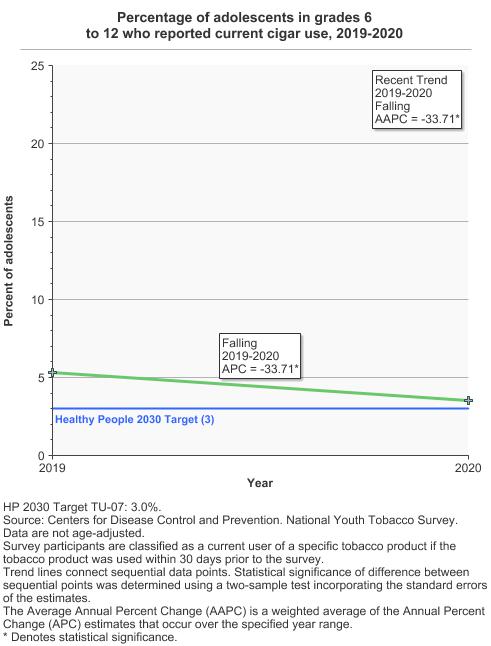
- Reduce to 3.0 percent the proportion of adolescents in grades 6–12 who smoked cigars (cigars, cigarillos, or little cigars) in the past 30 days.
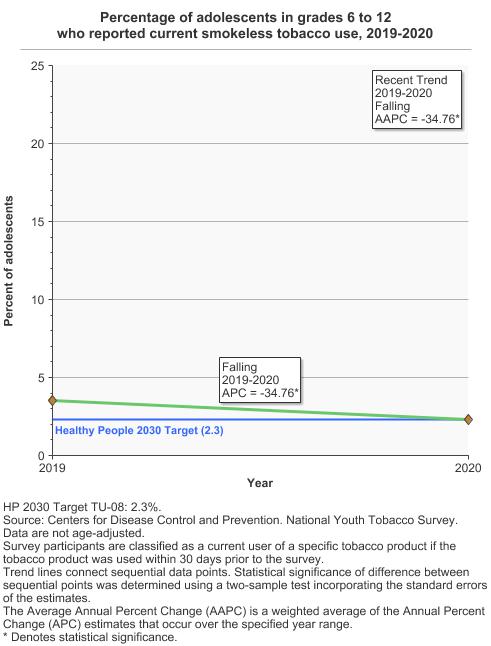
- Reduce to 2.3 percent the proportion of adolescents in grades 6–12 who used smokeless tobacco products (chewing tobacco, snuff, dip, or snus, and dissolvables) in the past 30 days.
Healthy People 2030 is a set of goals set forth by the Department of Health and Human Services.
Note: Goals are indicated as blue line on Detailed Trend Graphs.
Trends and Most Recent Estimates
- By Type of Tobacco Product
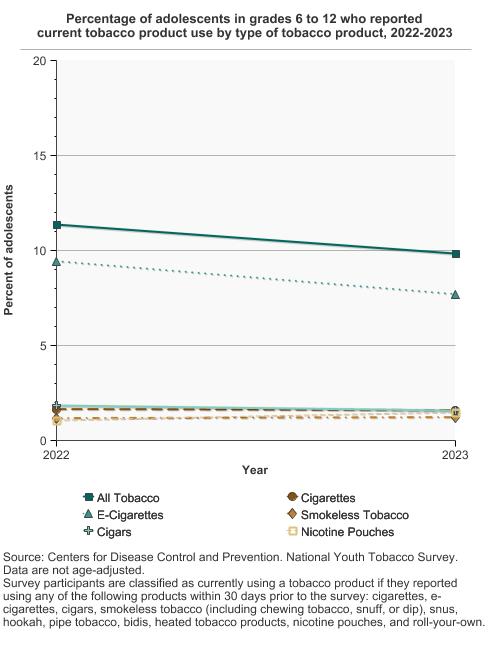
Percentage of adolescents in grades 6 to 12 who reported current tobacco product use by type of tobacco product, 2022-2023 Overview Graph Detailed Trend Graphs Most Recent Estimates (2023) Percent of adolescents 95% Confidence Interval 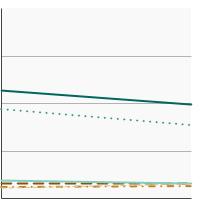

All Tobacco 
9.9 8.8 - 11.0 Cigarettes 1.6 1.2 - 2.0 E-Cigarettes 7.7 6.9 - 8.6 Smokeless Tobacco 1.2 0.9 - 1.7 Cigars 1.6 1.3 - 2.0 Nicotine Pouches 1.5 1.1 - 2.1 - All Tobacco Products
- By Sex
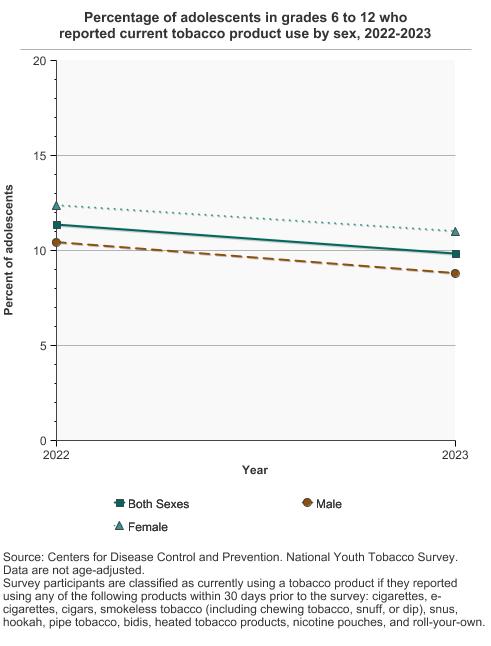
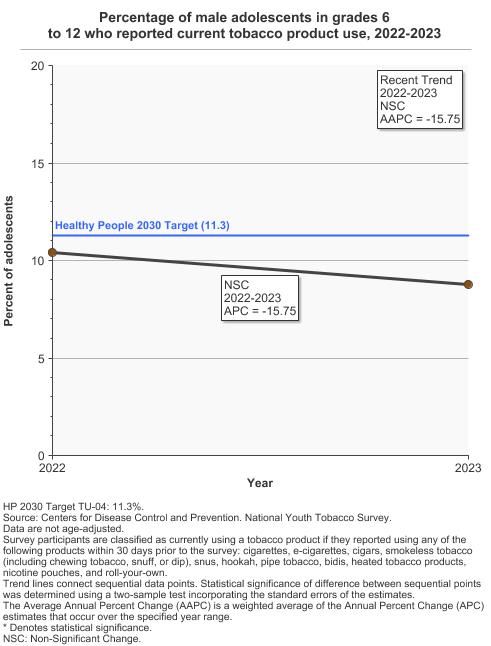
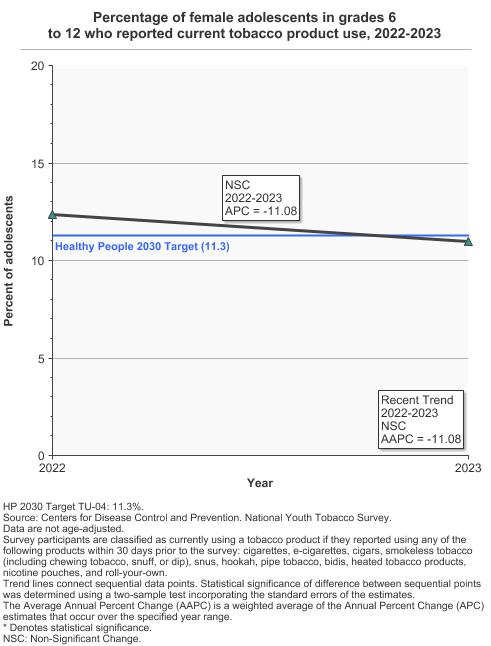
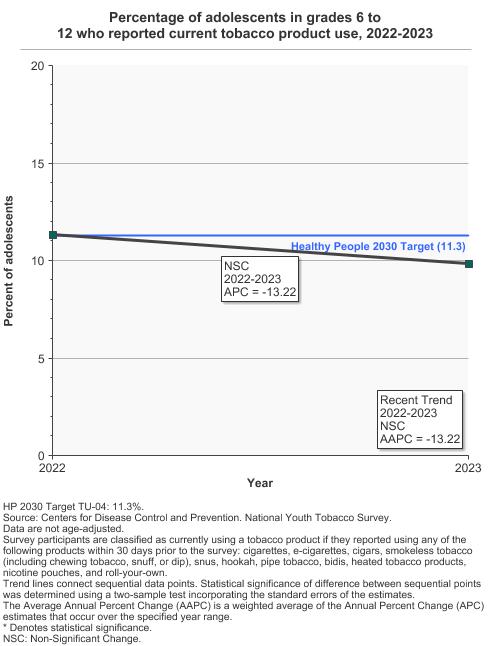
Percentage of adolescents in grades 6 to 12 who reported current tobacco product use by sex, 2022-2023 Overview Graph Detailed Trend Graphs Most Recent Estimates (2023) Percent of adolescents 95% Confidence Interval 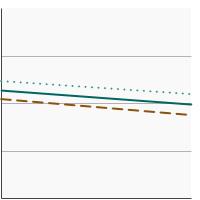
Both Sexes 9.9 8.8 - 11.0 Male 8.8 7.6 - 10.1 Female 11.0 9.4 - 12.8 - By Race/Ethnicity
Percentage of adolescents in grades 6 to 12 who reported current tobacco product use by race/ethnicity, 2022-2023 Overview Graph Detailed Trend Graphs Most Recent Estimates (2023) Percent of adolescents 95% Confidence Interval 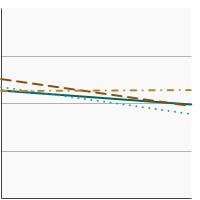
All Races/Ethnicities 9.9 8.8 - 11.0 Non-Hispanic White 9.7 8.0 - 11.7 Non-Hispanic Black 8.9 7.2 - 10.8 Hispanic 11.4 9.9 - 13.1 - By Current Grade Level
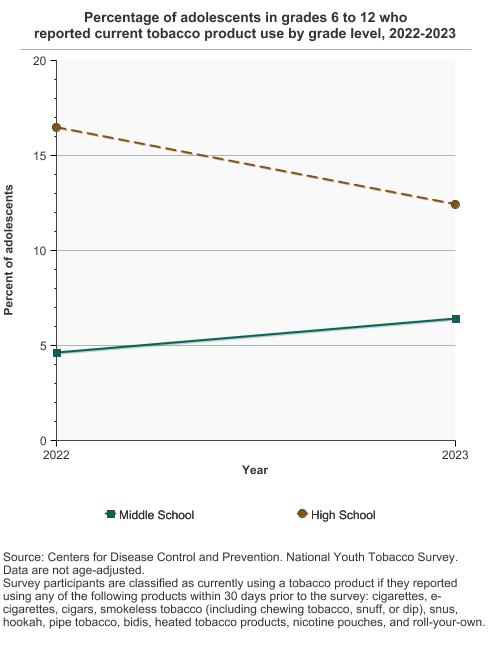
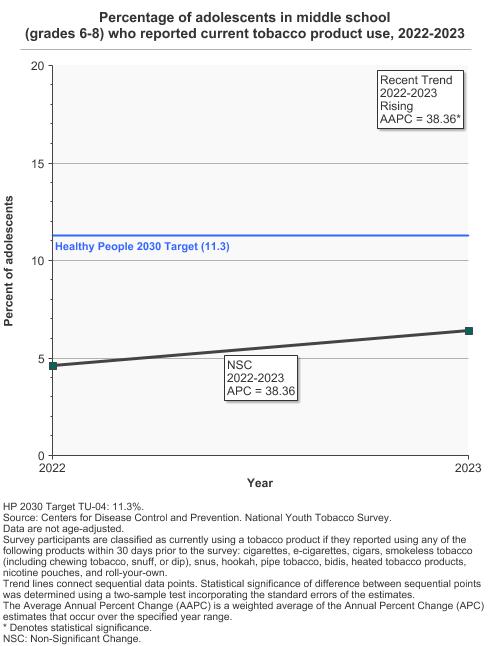
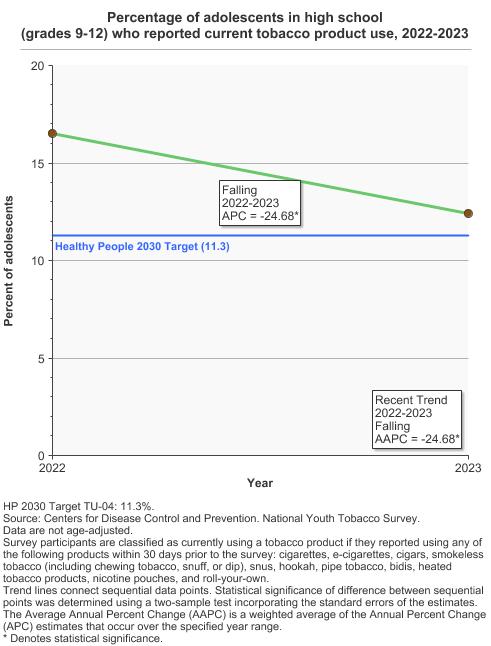
Percentage of adolescents in grades 6 to 12 who reported current tobacco product use by grade level, 2022-2023 Overview Graph Detailed Trend Graphs Most Recent Estimates (2023) Percent of adolescents 95% Confidence Interval 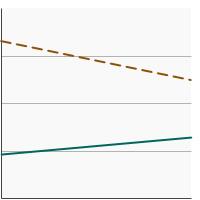
Middle School 6.4 5.0 - 8.2 High School 12.4 11.0 - 14.0
- Cigarettes
- By Sex
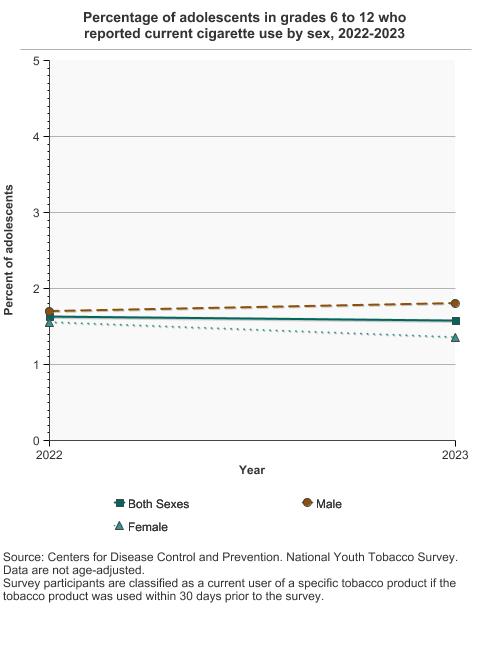
Percentage of adolescents in grades 6 to 12 who reported current cigarette use by sex, 2022-2023 Overview Graph Detailed Trend Graphs Most Recent Estimates (2023) Percent of adolescents 95% Confidence Interval 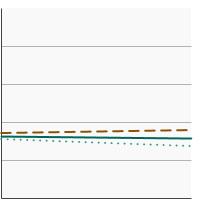
Both Sexes 1.6 1.2 - 2.0 Male 1.8 1.4 - 2.4 Female 1.4 1.0 - 1.9 - By Race/Ethnicity
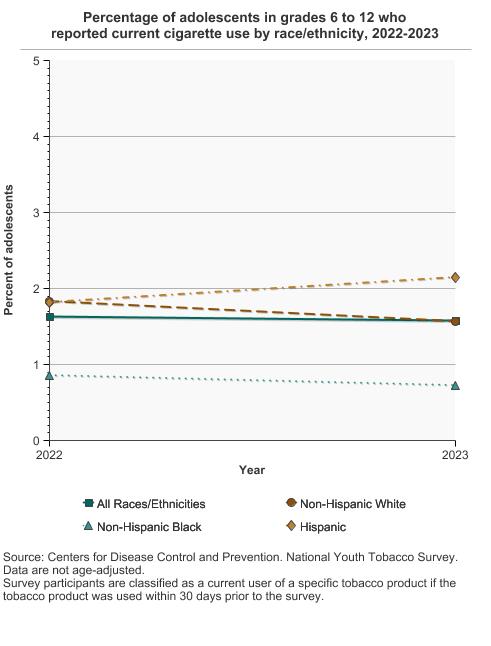
Percentage of adolescents in grades 6 to 12 who reported current cigarette use by race/ethnicity, 2022-2023 Overview Graph Detailed Trend Graphs Most Recent Estimates (2023) Percent of adolescents 95% Confidence Interval 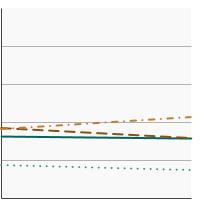
All Races/Ethnicities 1.6 1.2 - 2.0 Non-Hispanic White 1.6 1.1 - 2.2 Non-Hispanic Black 0.7 0.4 - 1.3 Hispanic 2.1 1.5 - 3.0 - By Current Grade Level
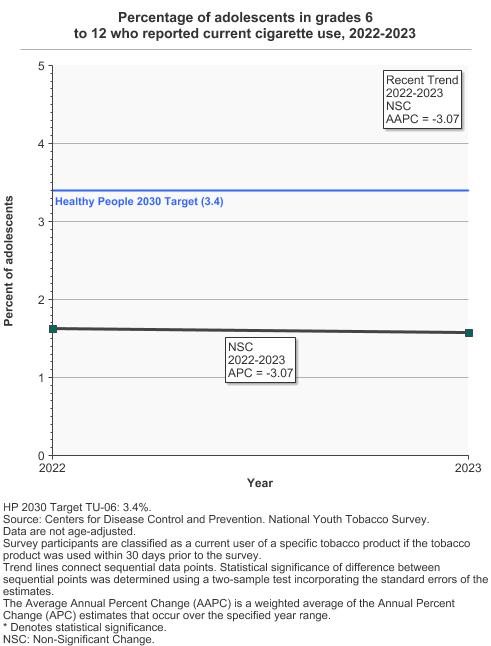
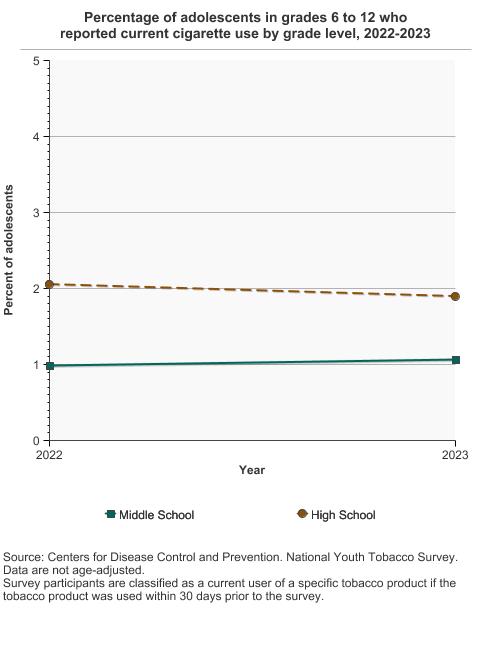
Percentage of adolescents in grades 6 to 12 who reported current cigarette use by grade level, 2022-2023 Overview Graph Detailed Trend Graphs Most Recent Estimates (2023) Percent of adolescents 95% Confidence Interval 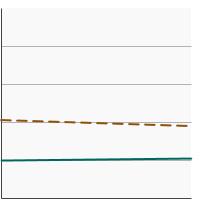
Middle School 1.1 0.6 - 1.9 High School 1.9 1.5 - 2.4
- E-Cigarettes
- By Sex
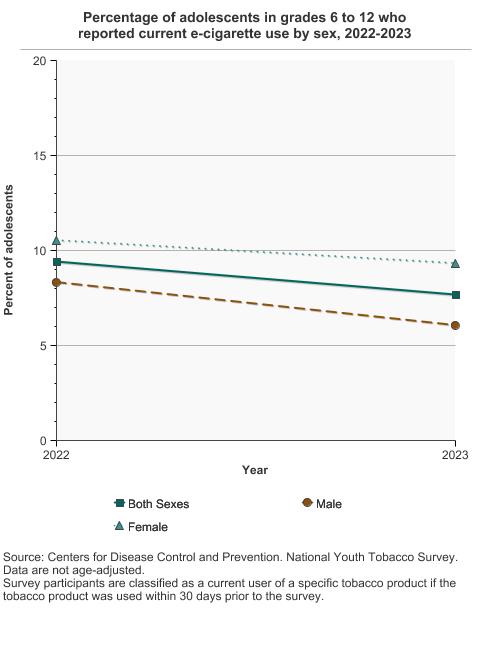
Percentage of adolescents in grades 6 to 12 who reported current e-cigarette use by sex, 2022-2023 Overview Graph Detailed Trend Graphs Most Recent Estimates (2023) Percent of adolescents 95% Confidence Interval 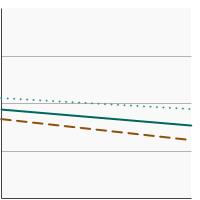
Both Sexes 7.7 6.9 - 8.6 Male 6.1 5.0 - 7.3 Female 9.3 8.1 - 10.7 - By Race/Ethnicity
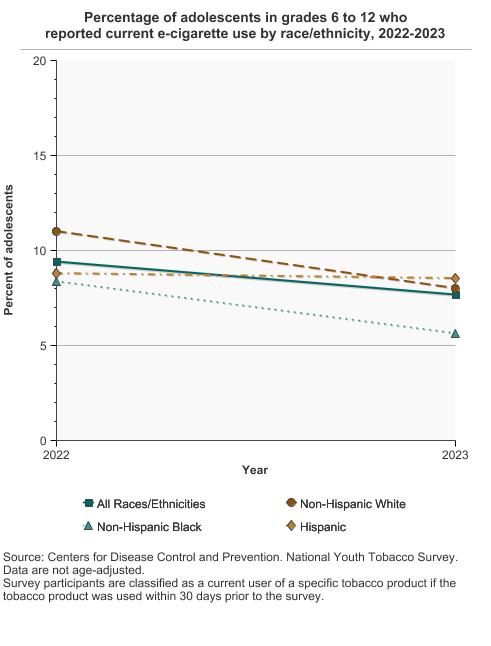
Percentage of adolescents in grades 6 to 12 who reported current e-cigarette use by race/ethnicity, 2022-2023 Overview Graph Detailed Trend Graphs Most Recent Estimates (2023) Percent of adolescents 95% Confidence Interval 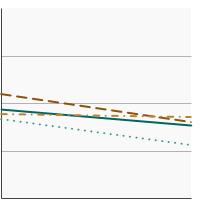
All Races/Ethnicities 7.7 6.9 - 8.6 Non-Hispanic White 8.0 6.6 - 9.6 Non-Hispanic Black 5.6 4.5 - 7.0 Hispanic 8.5 7.4 - 9.8 - By Current Grade Level
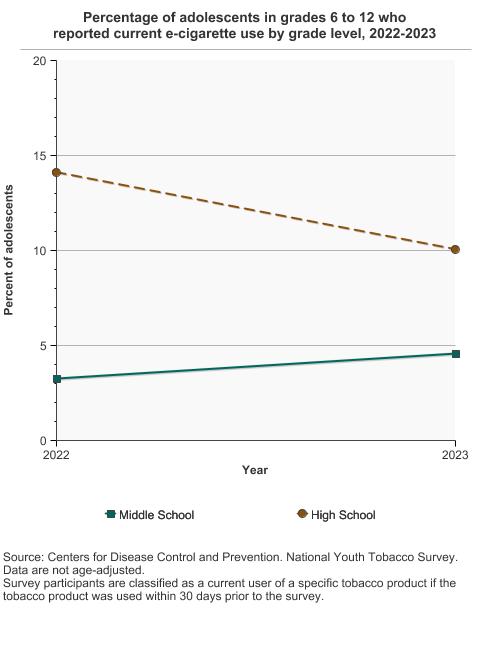
Percentage of adolescents in grades 6 to 12 who reported current e-cigarette use by grade level, 2022-2023 Overview Graph Detailed Trend Graphs Most Recent Estimates (2023) Percent of adolescents 95% Confidence Interval 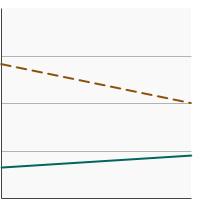
Middle School 4.6 3.6 - 5.7 High School 10.0 8.8 - 11.4
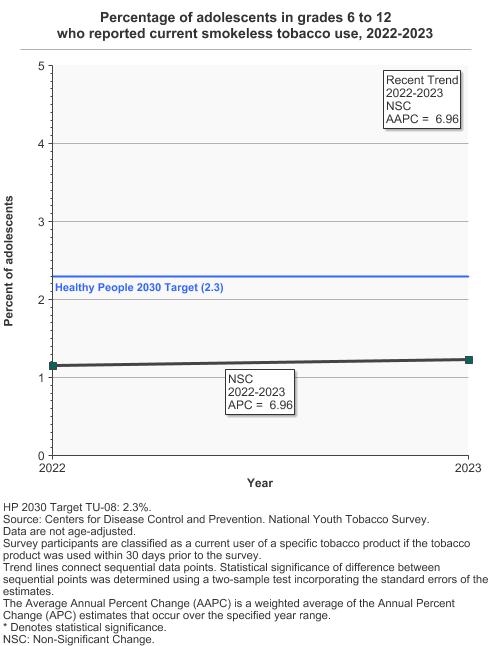
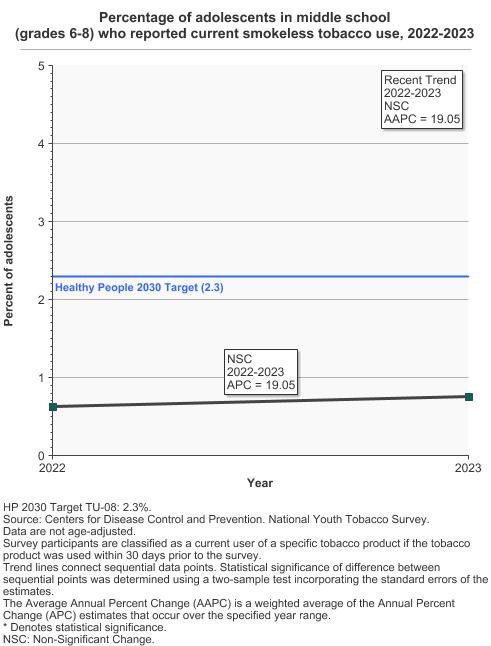
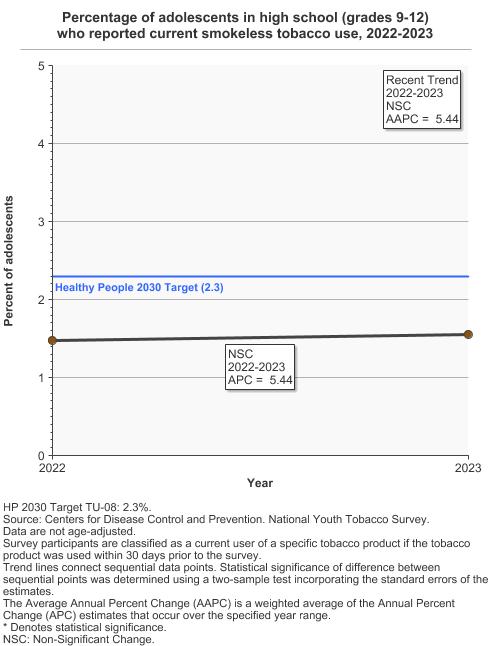
- Smokeless Tobacco
- By Sex
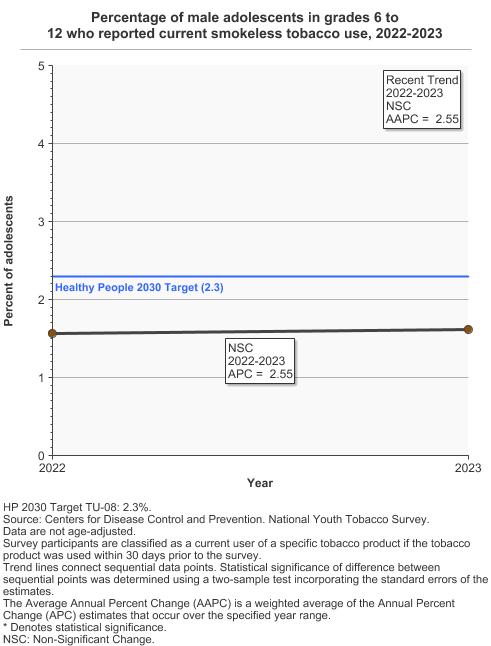
Percentage of adolescents in grades 6 to 12 who reported current smokeless tobacco use by sex, 2022-2023 Overview Graph Detailed Trend Graphs Most Recent Estimates (2023) Percent of adolescents 95% Confidence Interval 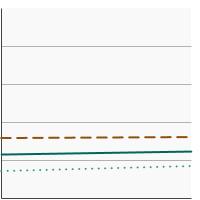
Both Sexes 1.2 0.9 - 1.7 Male 1.6 1.1 - 2.3 Female 0.8 0.5 - 1.6 - By Race/Ethnicity
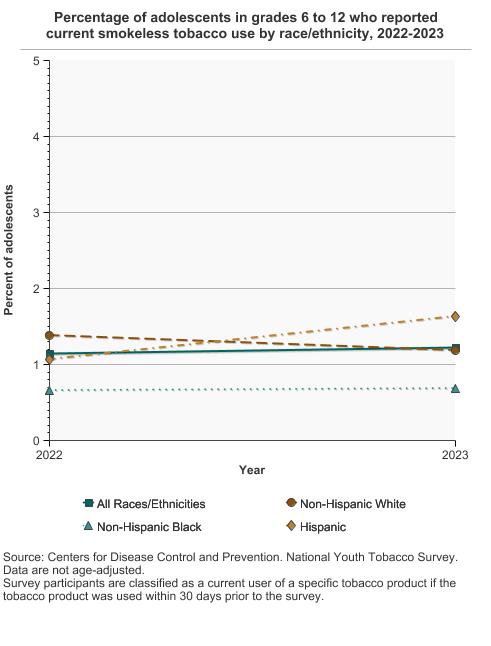
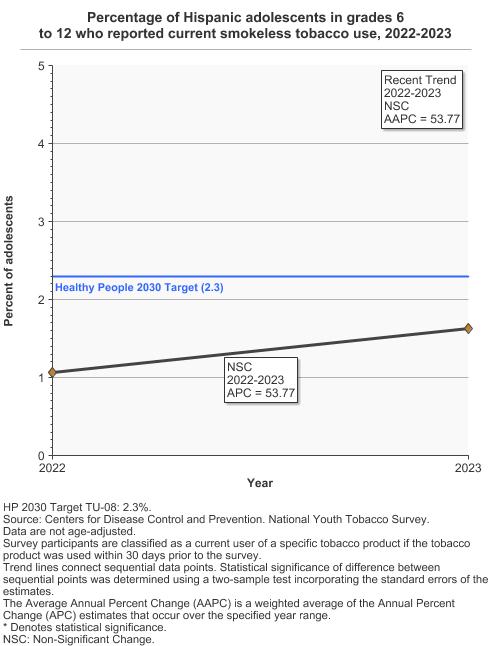
Percentage of adolescents in grades 6 to 12 who reported current smokeless tobacco use by race/ethnicity, 2022-2023 Overview Graph Detailed Trend Graphs Most Recent Estimates (2023) Percent of adolescents 95% Confidence Interval 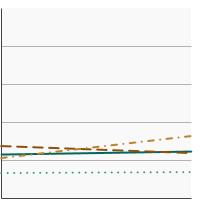
All Races/Ethnicities 1.2 0.9 - 1.7 Non-Hispanic White 1.2 0.8 - 1.8 Non-Hispanic Black 0.7 0.4 - 1.2 Hispanic 1.6 1.1 - 2.3 - By Current Grade Level
Percentage of adolescents in grades 6 to 12 who reported current smokeless tobacco use by grade level, 2022-2023 Overview Graph Detailed Trend Graphs Most Recent Estimates (2023) Percent of adolescents 95% Confidence Interval 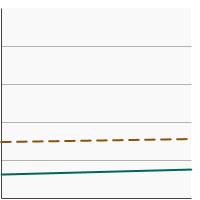
Middle School 0.8 0.5 - 1.2 High School 1.6 1.1 - 2.2
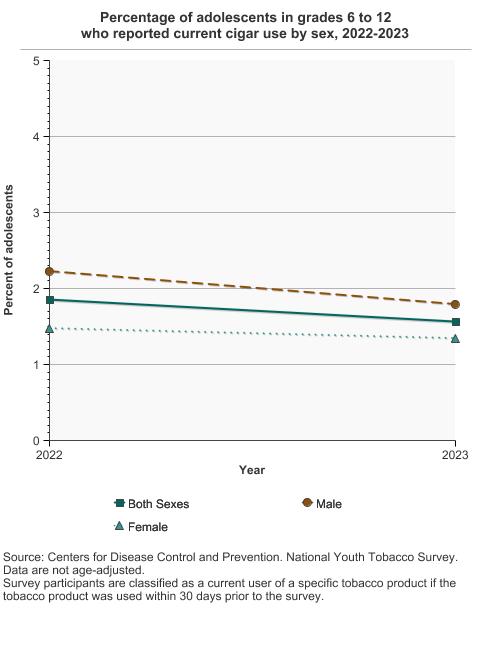
- Cigars
- By Sex
Percentage of adolescents in grades 6 to 12 who reported current cigar use by sex, 2022-2023 Overview Graph Detailed Trend Graphs Most Recent Estimates (2023) Percent of adolescents 95% Confidence Interval 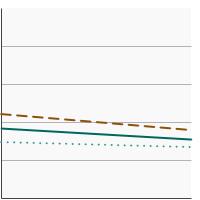
Both Sexes 1.6 1.3 - 2.0 Male 1.8 1.4 - 2.3 Female 1.3 0.9 - 2.0 - By Race/Ethnicity
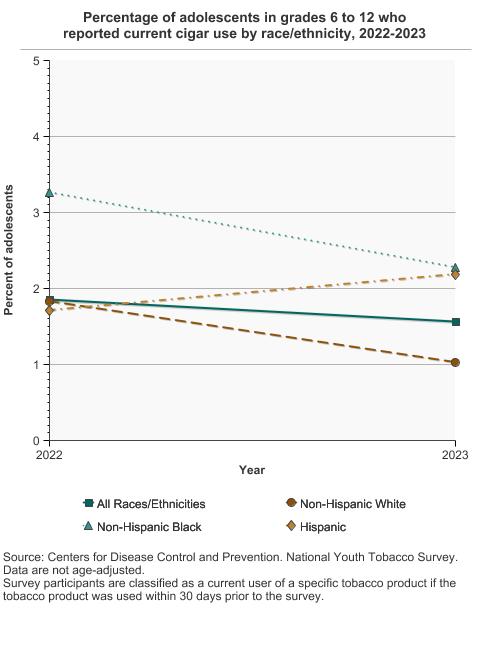
Percentage of adolescents in grades 6 to 12 who reported current cigar use by race/ethnicity, 2022-2023 Overview Graph Detailed Trend Graphs Most Recent Estimates (2023) Percent of adolescents 95% Confidence Interval 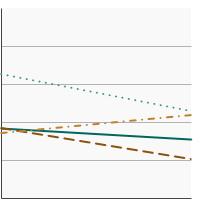
All Races/Ethnicities 1.6 1.3 - 2.0 Non-Hispanic White 1.0 0.7 - 1.4 Non-Hispanic Black 2.3 1.5 - 3.6 Hispanic 2.2 1.7 - 2.8 - By Current Grade Level
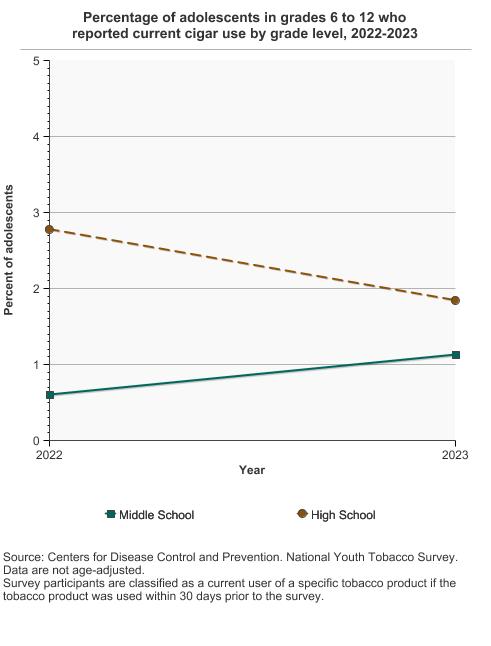
Percentage of adolescents in grades 6 to 12 who reported current cigar use by grade level, 2022-2023 Overview Graph Detailed Trend Graphs Most Recent Estimates (2023) Percent of adolescents 95% Confidence Interval 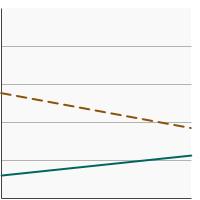
Middle School 1.1 0.7 - 1.8 High School 1.8 1.4 - 2.4
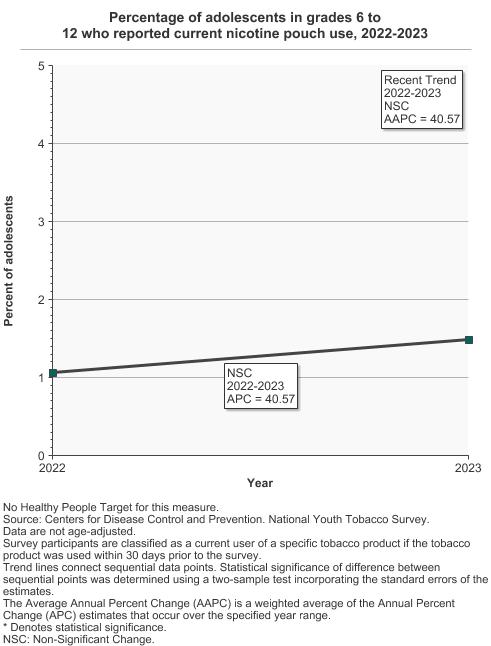
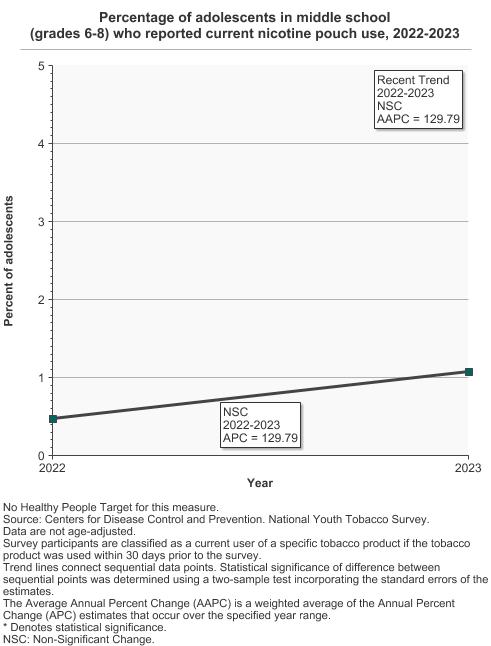
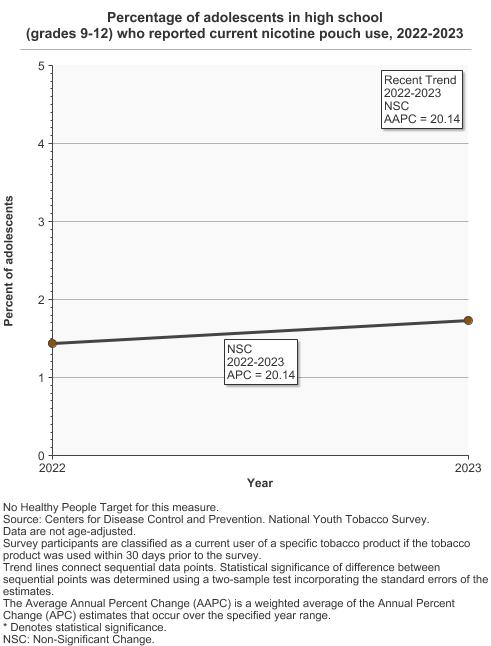
- Nicotine Pouches
- By Sex
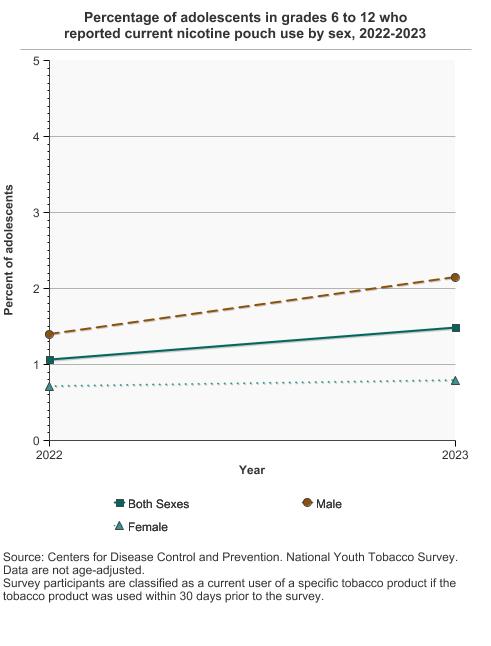
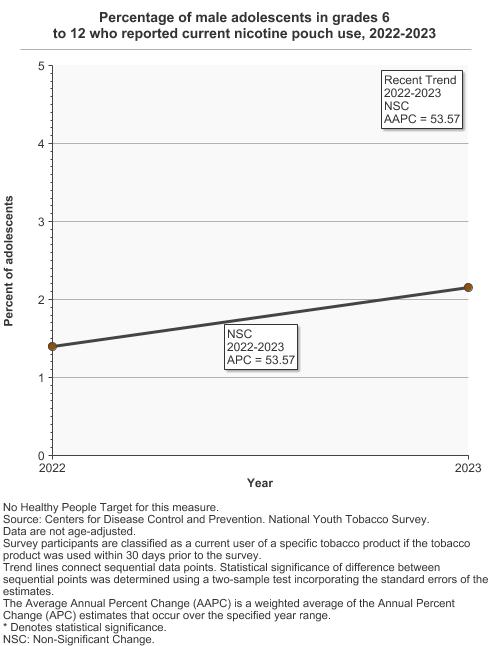
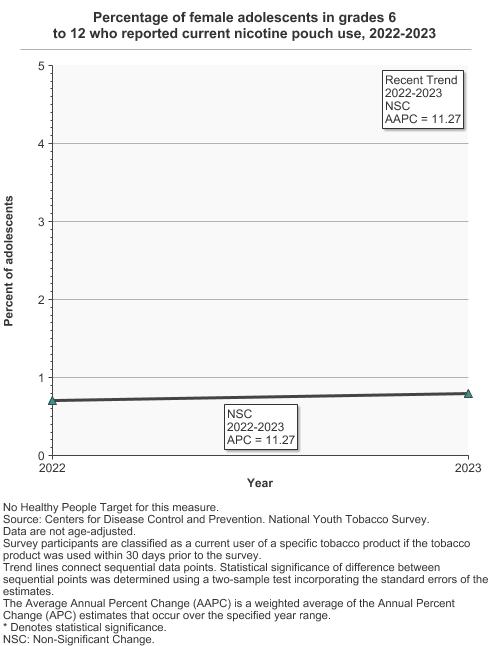
Percentage of adolescents in grades 6 to 12 who reported current nicotine pouch use by sex, 2022-2023 Overview Graph Detailed Trend Graphs Most Recent Estimates (2023) Percent of adolescents 95% Confidence Interval 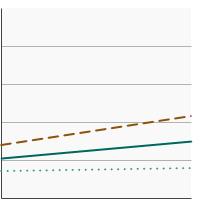
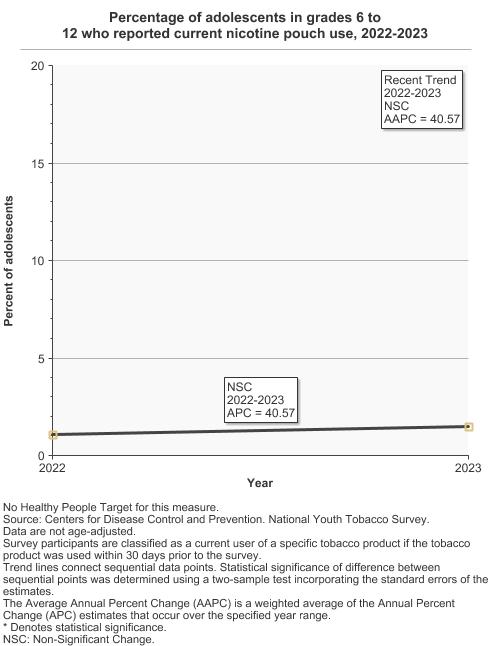
Both Sexes 1.5 1.1 - 2.1 Male 2.2 1.6 - 3.0 Female 0.8 0.5 - 1.3 - By Race/Ethnicity
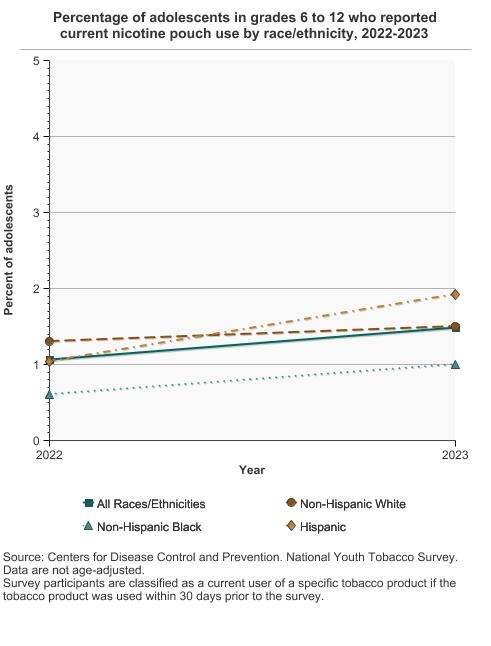
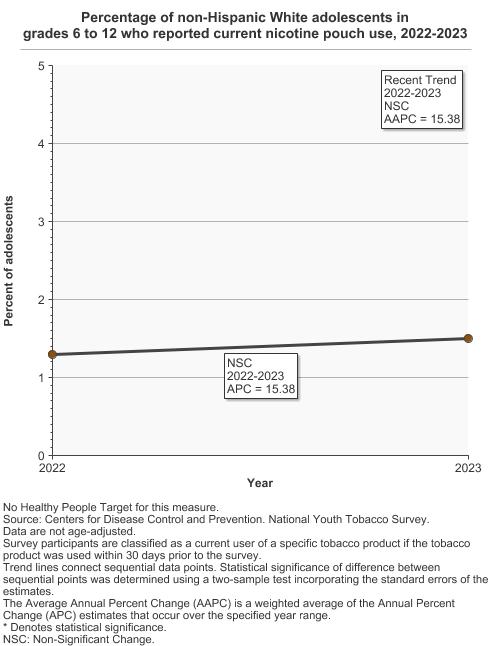
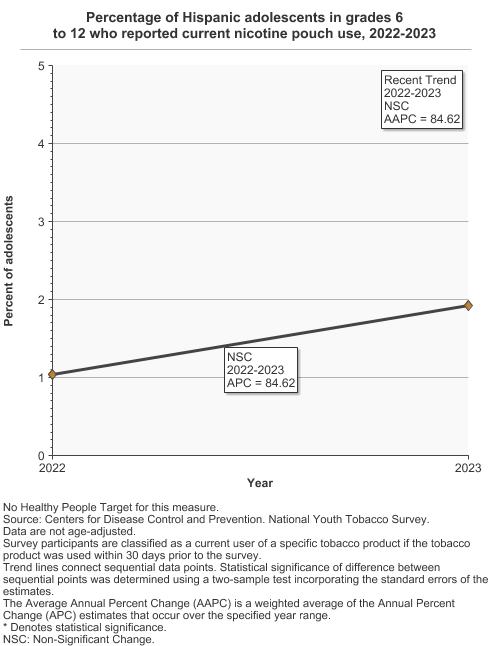
Percentage of adolescents in grades 6 to 12 who reported current nicotine pouch use by race/ethnicity, 2022-2023 Overview Graph Detailed Trend Graphs Most Recent Estimates (2023) Percent of adolescents 95% Confidence Interval 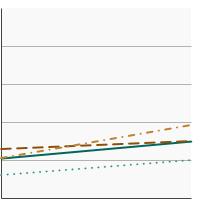
All Races/Ethnicities 1.5 1.1 - 2.1 Non-Hispanic White 1.5 1.0 - 2.3 Non-Hispanic Black 1.0 0.5 - 1.9 Hispanic 1.9 1.1 - 3.3 - By Current Grade Level
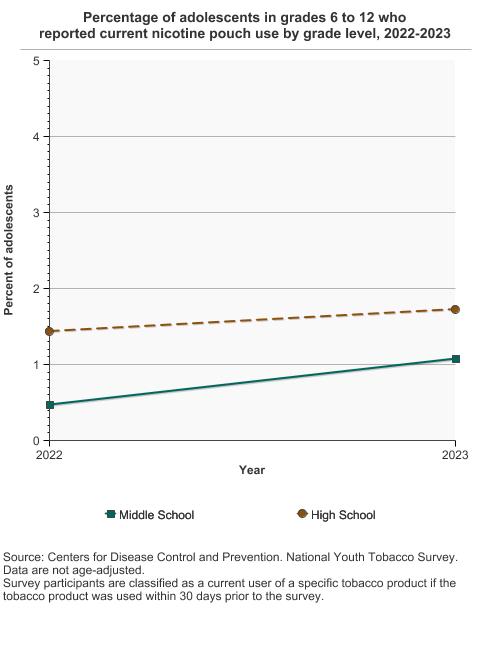
Percentage of adolescents in grades 6 to 12 who reported current nicotine pouch use by grade level, 2022-2023 Overview Graph Detailed Trend Graphs Most Recent Estimates (2023) Percent of adolescents 95% Confidence Interval 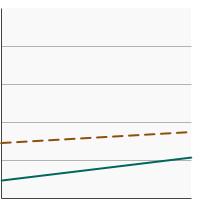
Middle School 1.1 0.5 - 2.3 High School 1.7 1.2 - 2.5
- Previous Trends
- 2019-2020
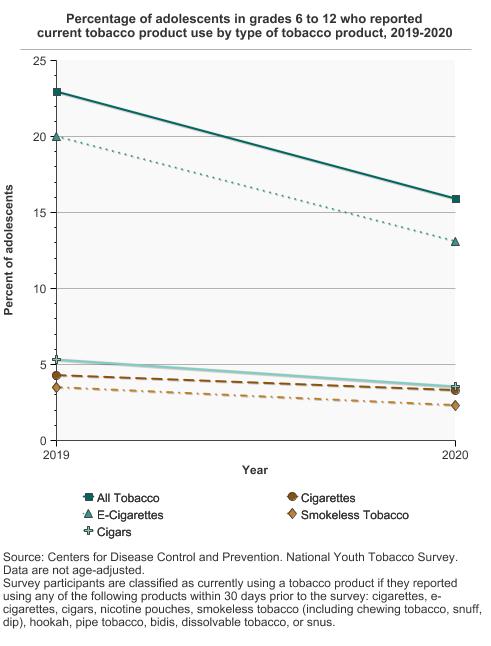
Percentage of adolescents in grades 6 to 12 who reported current tobacco product use by type of tobacco product, 2019-2020 Overview Graph Detailed Trend Graphs Most Recent Estimates (2020) Percent of adolescents 95% Confidence Interval 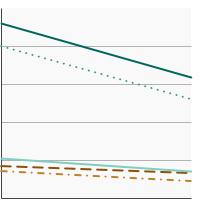
All Tobacco 15.9 13.9 - 18.1 Cigarettes 3.3 2.6 - 4.2 E-Cigarettes 13.1 11.2 - 15.1 Smokeless Tobacco 2.3 1.8 - 3.0 Cigars 3.5 2.9 - 4.3 - 2011-2018
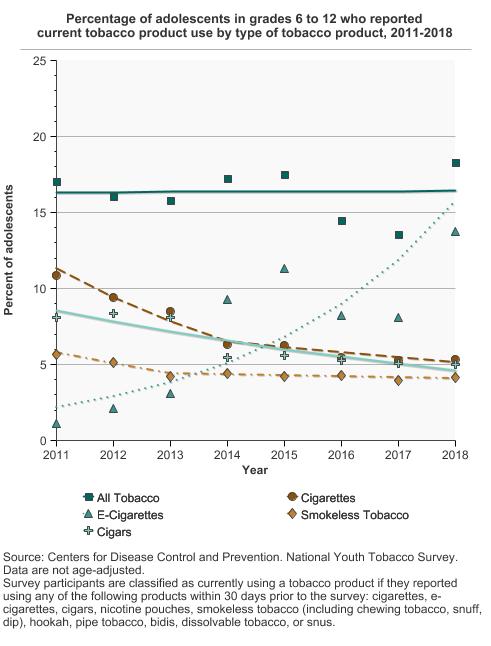
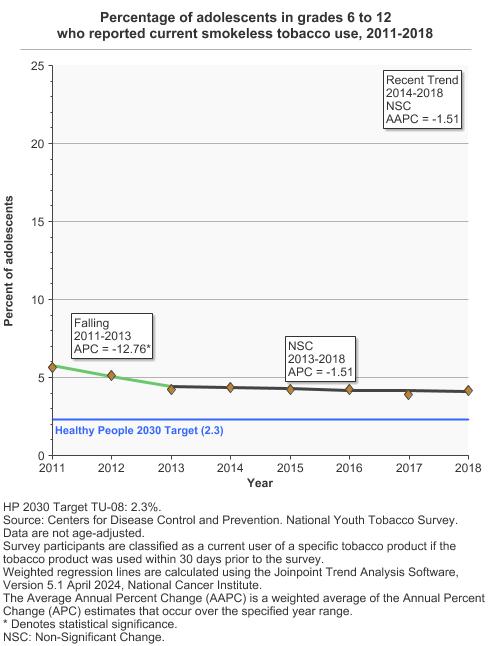
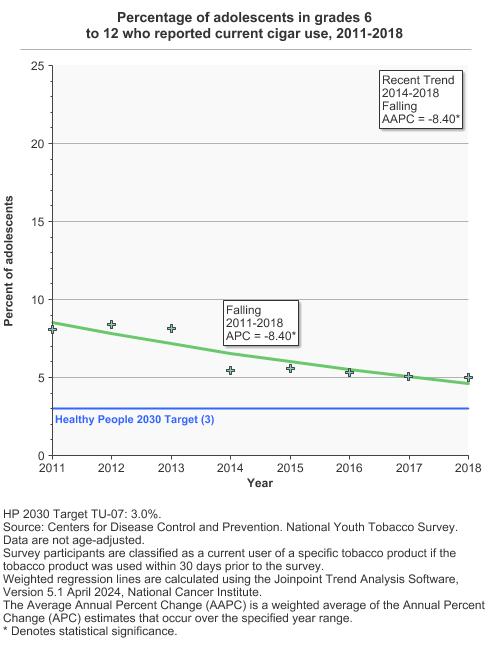
Percentage of adolescents in grades 6 to 12 who reported current tobacco product use by type of tobacco product, 2011-2018 Overview Graph Detailed Trend Graphs Most Recent Estimates (2018) Percent of adolescents 95% Confidence Interval 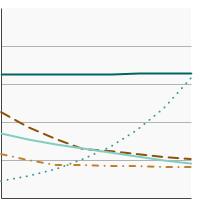
All Tobacco 18.3 16.9 - 19.9 Cigarettes 5.4 4.6 - 6.2 E-Cigarettes 13.8 12.4 - 15.3 Smokeless Tobacco 4.1 3.5 - 4.9 Cigars 5.0 4.4 - 5.7


Additional Information
- Tobacco. National Cancer Institute.
- Stay Away from Tobacco. American Cancer Society.
- Protecting Youth From the Harms of Vaping. Centers for Disease Control and Prevention.
- 2018 Surgeon General’s Advisory on E-cigarette Use Among Youth. U.S. Department of Health and Human Services, Office of the Surgeon General.
- Youth and Tobacco Use. Centers for Disease Control and Prevention.
- Youth and Tobacco. U.S. Food and Drug Administration.
Quitting Resources
- Smokefreeteen.gov. National Cancer Institute.
- SmokefreeTXT. National Cancer Institute.
- Cigarette Smoking: Health Risks and How to Quit (PDQ®)–Patient Version. National Cancer Institute.
- Smokefree.gov. National Cancer Institute.
- Where To Get Help When You Decide To Quit Smoking. National Cancer Institute.
- How to Quit Using Tobacco. American Cancer Society.
- Cigarette Smoking: Health Risks and How to Quit (PDQ®)–Health Professional Version. National Cancer Institute.
- Tobacco Control Evidence-Based Programs Listing. National Cancer Institute.
- Tobacco Control and Prevention. American Academy of Pediatrics.
- 2016 Surgeon General’s Report—E-cigarette Use Among Youth and Young Adults. Centers for Disease Control and Prevention.
- Best Practices for Comprehensive Tobacco Control Programs—2014. Centers for Disease Control and Prevention.
- Smoking and Tobacco Use—Patient Care. Centers for Disease Control and Prevention.
- 50 Years of Progress: A Report of the Surgeon General, 2014. U.S. Department of Health and Human Services.
- Monograph 19: The Role of the Media in Promoting and Reducing Tobacco Use. National Cancer Institute. Smoking and Tobacco Control Monographs.
- Tobacco Use in Top-Grossing Movies-United States, 2010-2018. Centers for Disease Control and Prevention. MMWR. 2019; 68(43):974-978.
- Tobacco Product Use Among High School Students — Youth Risk Behavior Survey, United States, 2019. Creamer MR, Everett Jones S, Gentzke AS, et al. MMWR Suppl. 2020;69(Suppl-1):56–63.
- Vital Signs: Tobacco Product Use Among Middle and High School Students – United States, 2011-2018. Gentzke AS, Creamer M, Cullen KA, et al. MMWR. 2019; 68(6):157-164.
- Tobacco Product Use Among Middle and High School Students – National Youth Tobacco Survey, United States, 2024. Jamal A, Park-Lee E, Birdsey, et al. MMWR. 2024; 73:917-924.
- Notes from the Field: E-Cigarette and Nicotine Pouch Use Among Middle and High School Students – United States, 2024. Park-Lee E, Jamal A, Cowan H, et al. MMWR. 2024;73(35);774-778.