
Mortality and Person-Years of Life Lost - End of Life Summary Table
Only one measure per topic is displayed in the summary table. A complete set of measures, where they exist, can be found by following the More Information link in the table below.
 |
green - headed in the right direction |
 |
red - headed in the wrong direction |
 |
black - stable or non-significant change (NSC) |
 |
purple - indeterminate |
 |
blue - Healthy People 2030 target |
| Measure Name | Mortality | Years of Life Lost |
|---|---|---|
| Year Range | 1975-2020 | 1975-2020 |
| Measure |
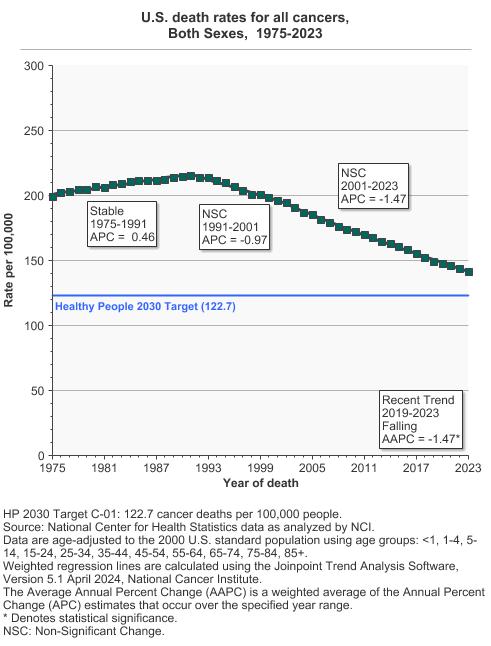
The number of cancer deaths per 100,000 people per year, age-adjusted to a U.S. 2000 standard population. |
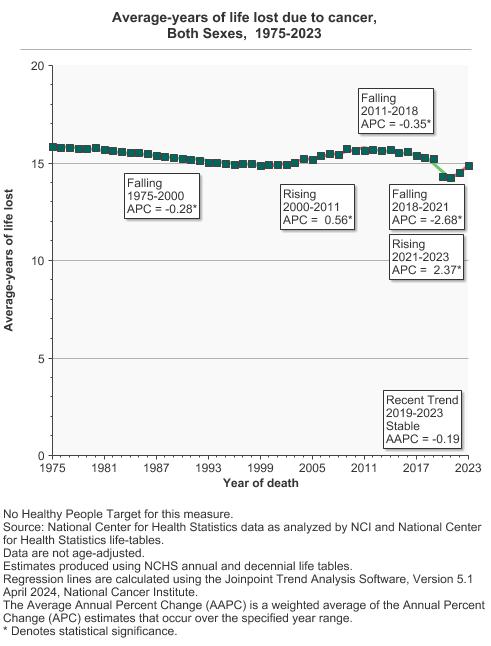
The difference between the actual age stemming from the disease/cause and the expected age of death. |
| Recent Summary Trend | Falling | Falling |
| Recent Summary Trend Year Range | 2016-2020 | 2016-2020 |
| Desired Direction | Falling | Falling |
| Summary Graph |
|
|
| Trends and Most Recent Estimates | In 2020, the death rate for all cancers combined was 144.1 per 100,000 people per year. | In 2020, the average years of life lost due to cancer was 15.2. |
| Healthy People 2030 Target | Reduce the overall cancer death rate to 122.7 cancer deaths per 100,000 people per year. | No Healthy People Target for this measure. |
| More Information | Mortality | Years of Life Lost |
| Last Updated | March 2024 | March 2024 |
| Measure Name | Mortality |
|---|---|
| Year Range | 1975-2020 |
| Measure |
The number of cancer deaths per 100,000 people per year, age-adjusted to a U.S. 2000 standard population. |
| Recent Summary Trend | Falling |
| Recent Summary Trend Year Range | 2016-2020 |
| Desired Direction | Falling |
| Summary Graph |
|
| Trends and Most Recent Estimates | In 2020, the death rate for all cancers combined was 144.1 per 100,000 people per year. |
| Healthy People 2020 Target | Reduce the overall cancer death rate to 122.7 cancer deaths per 100,000 people per year. |
| More Information | Mortality |
| Measure Name | Years of Life Lost |
|---|---|
| Year Range | 1975-2020 |
| Measure |
The difference between the actual age stemming from the disease/cause and the expected age of death. |
| Recent Summary Trend | Falling |
| Recent Summary Trend Year Range | 2016-2020 |
| Desired Direction | Falling |
| Summary Graph |
|
| Trends and Most Recent Estimates | In 2020, the average years of life lost due to cancer was 15.2. |
| Healthy People 2020 Target | No Healthy People Target for this measure. |
| More Information | Years of Life Lost |